Group By
Overview
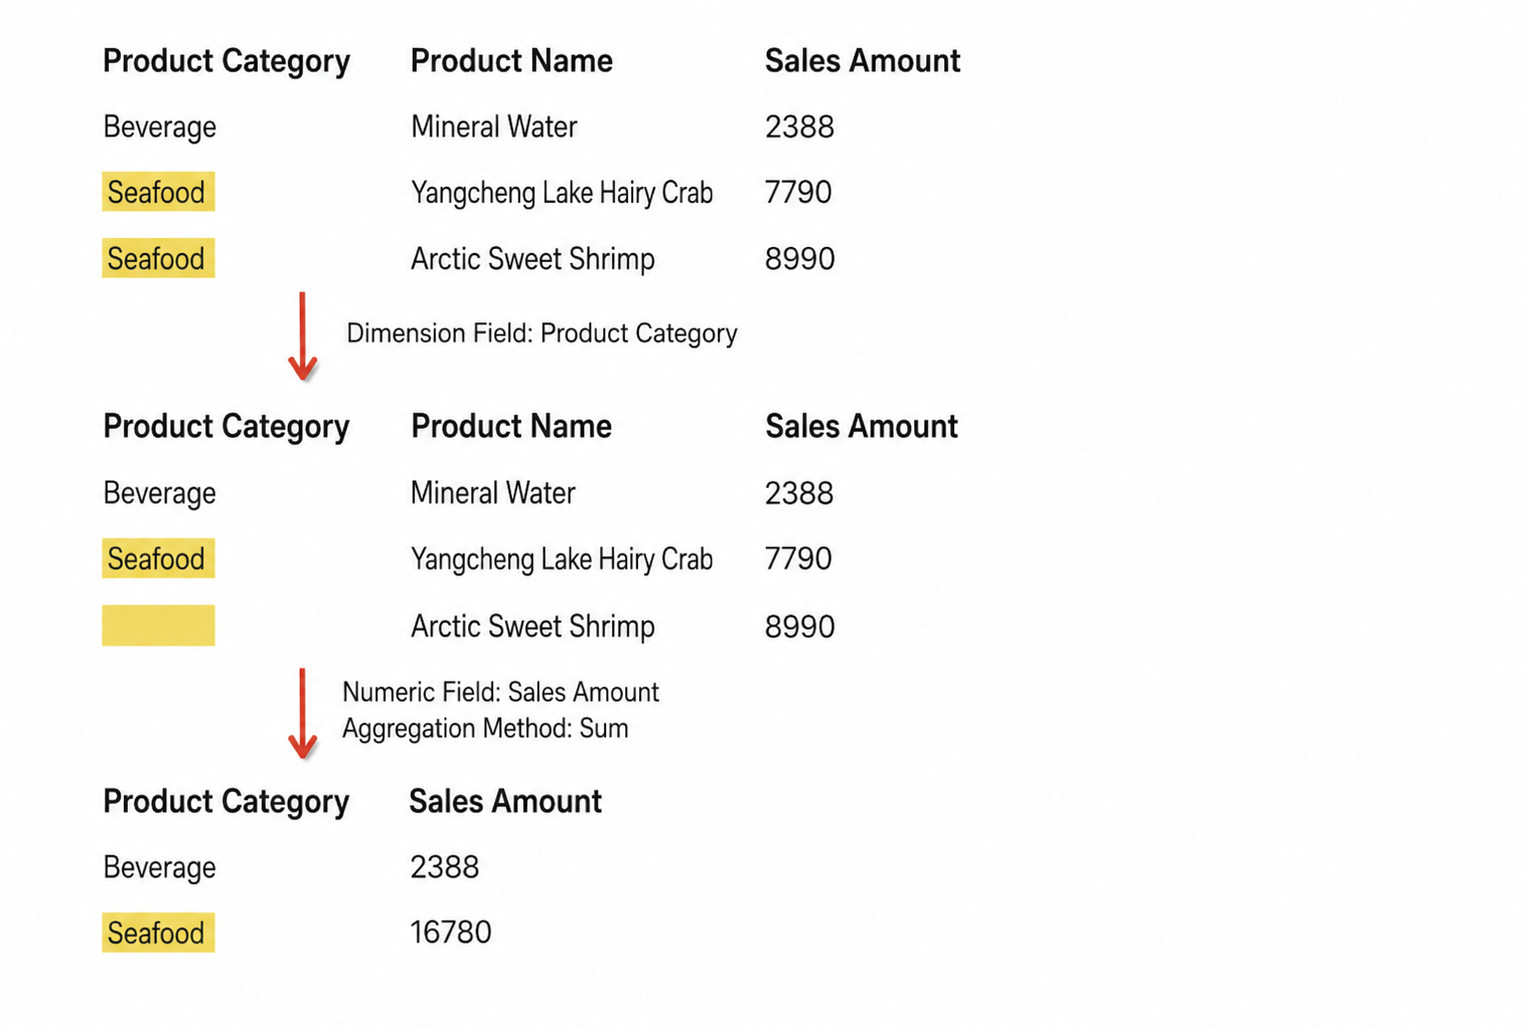
Group Aggregate means aggregating multiple rows into a single row by processing measures across one or more dimensions. When multiple dimensions are selected, aggregation is performed at the finest granularity among those dimensions.
For example, in retail sales analysis, data with the same product category can be merged together and the corresponding total sales amount can be calculated.
User Guide
Steps
- Drag the
Group Aggregateoperator from the ETL operator area to the canvas on the right. - Click the
Group Aggregateoperator and drag fields into theDimensionsandMeasuressections. - Click the added fields to set field aliases and choose aggregation methods as needed.
- At the current node, click
Previewto confirm the data result.
Detailed Explanation
The following example shows how to configure Regional Quantity_Sold.
Aggregate sales quantities by store region and group them together. Preview before aggregation:
-
Drag the
Group Byoperator from the ETL operator area to the canvas on the right and connect it to the upstream node. -
Click the
Group Byoperator. The left panel becomes the current operator configuration area. Rename it based on business needs, for exampleRegional Quantity_Sold.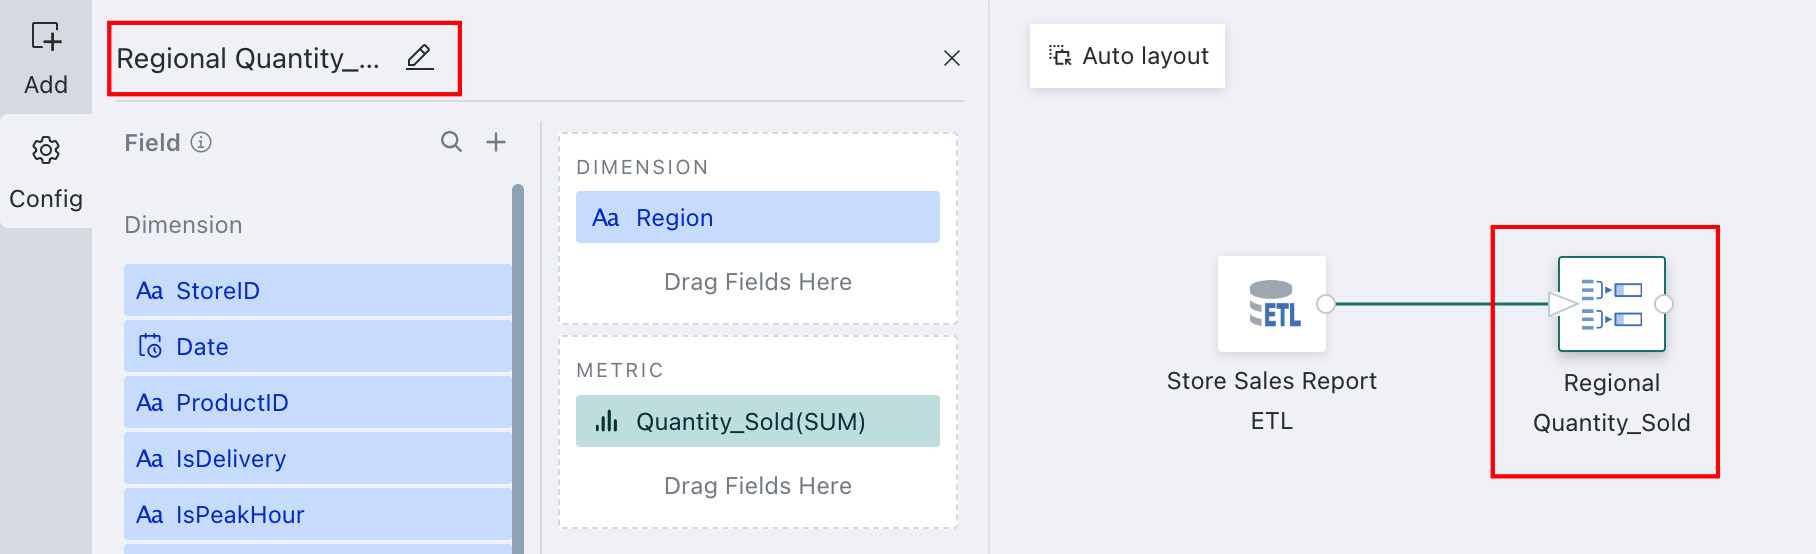
-
Drag
Regioninto theDimensionssection, then click the field and configure its alias as needed.NotesThe default aggregation for fields in the
Measuressection isCountfor text fields andSumfor numeric fields.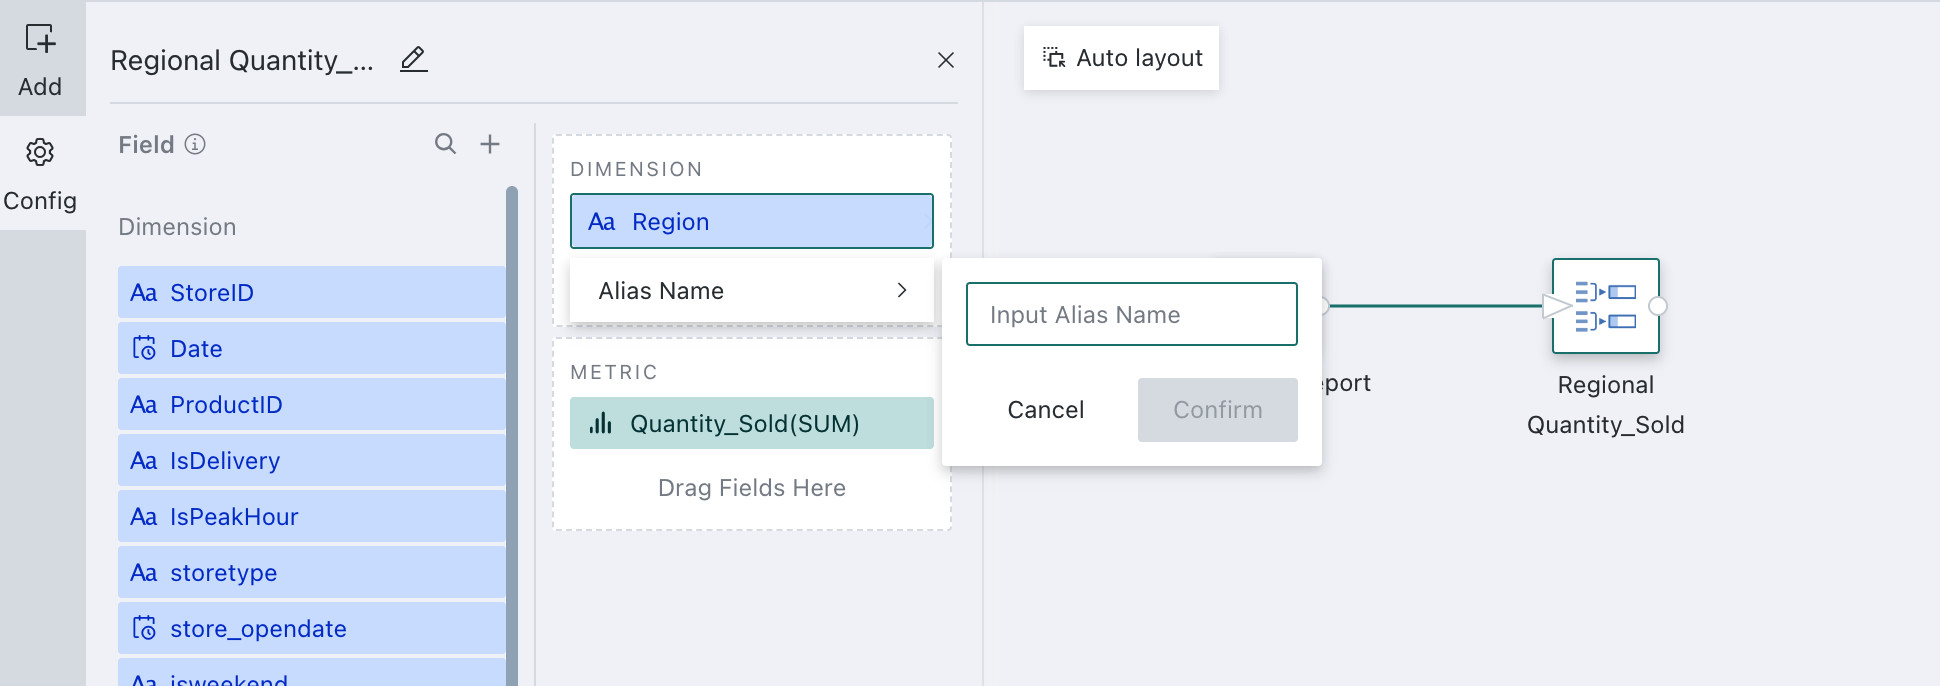
-
Drag
Quantity_Soldinto theMetricsection, click the field, chooseSumas the aggregation method, and configure the field alias if needed.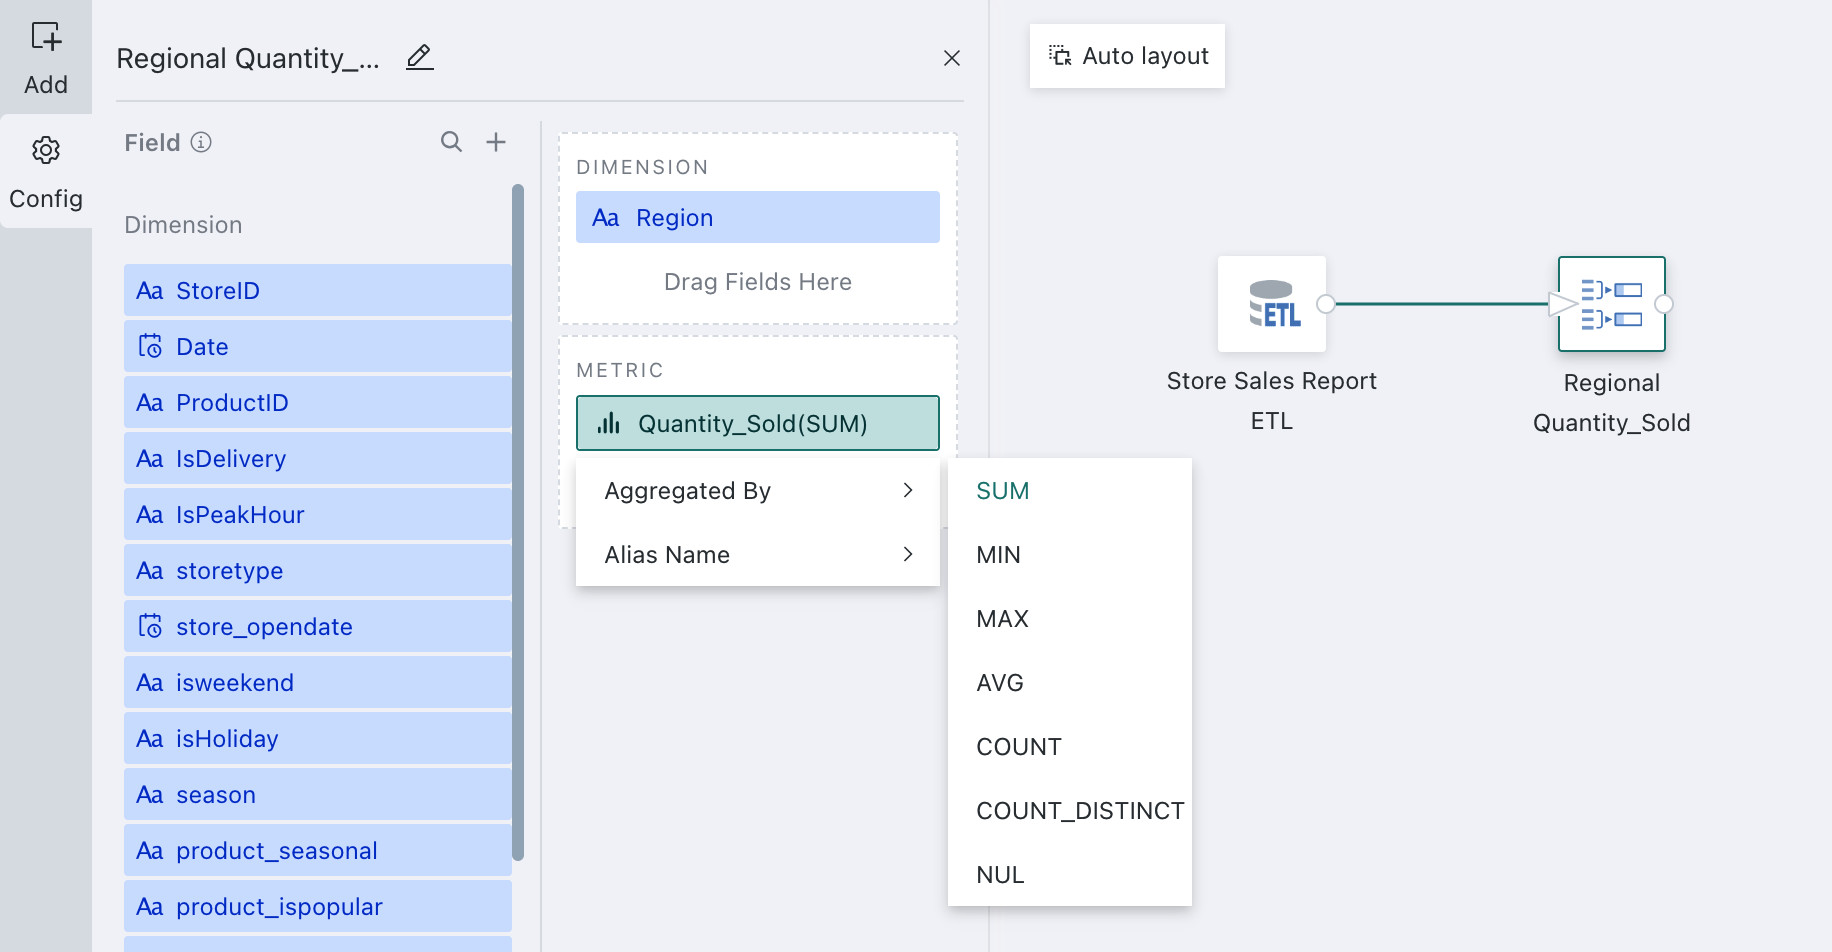
For error details, see The ETL Group Aggregate node reports a missing field, but the field is actually present.
For error details, see Type mismatch field.
We support 7 aggregation methods, including but not limited to Sum, Minimum, and Maximum.
| Aggregation Method | Purpose | Usage Scenario | Example |
|---|---|---|---|
| Sum | Add measure values under the specified dimension to calculate a total | When measures can be accumulated | Monthly total sales, daily website visits |
| Minimum | Get the minimum measure value under the specified dimension | When measures have a meaningful minimum value | Lowest sales price for each product, monthly minimum temperature |
| Maximum | Get the maximum measure value under the specified dimension | When measures have a meaningful maximum value | Highest sales price for each product, monthly maximum temperature |
| Average | Calculate the average measure value under the specified dimension | When measures can be averaged | Average monthly sales, average weekly user logins |
| Count | Count the number of records under the specified dimension | When you need to know how many records exist under a dimension | Count of records under a specific dimension |
| Distinct Count | Count the number of distinct values under the specified dimension | When you need to know how many different values exist under a dimension | Number of distinct products sold each month, distinct customers in each region |
| None | - | - | - |
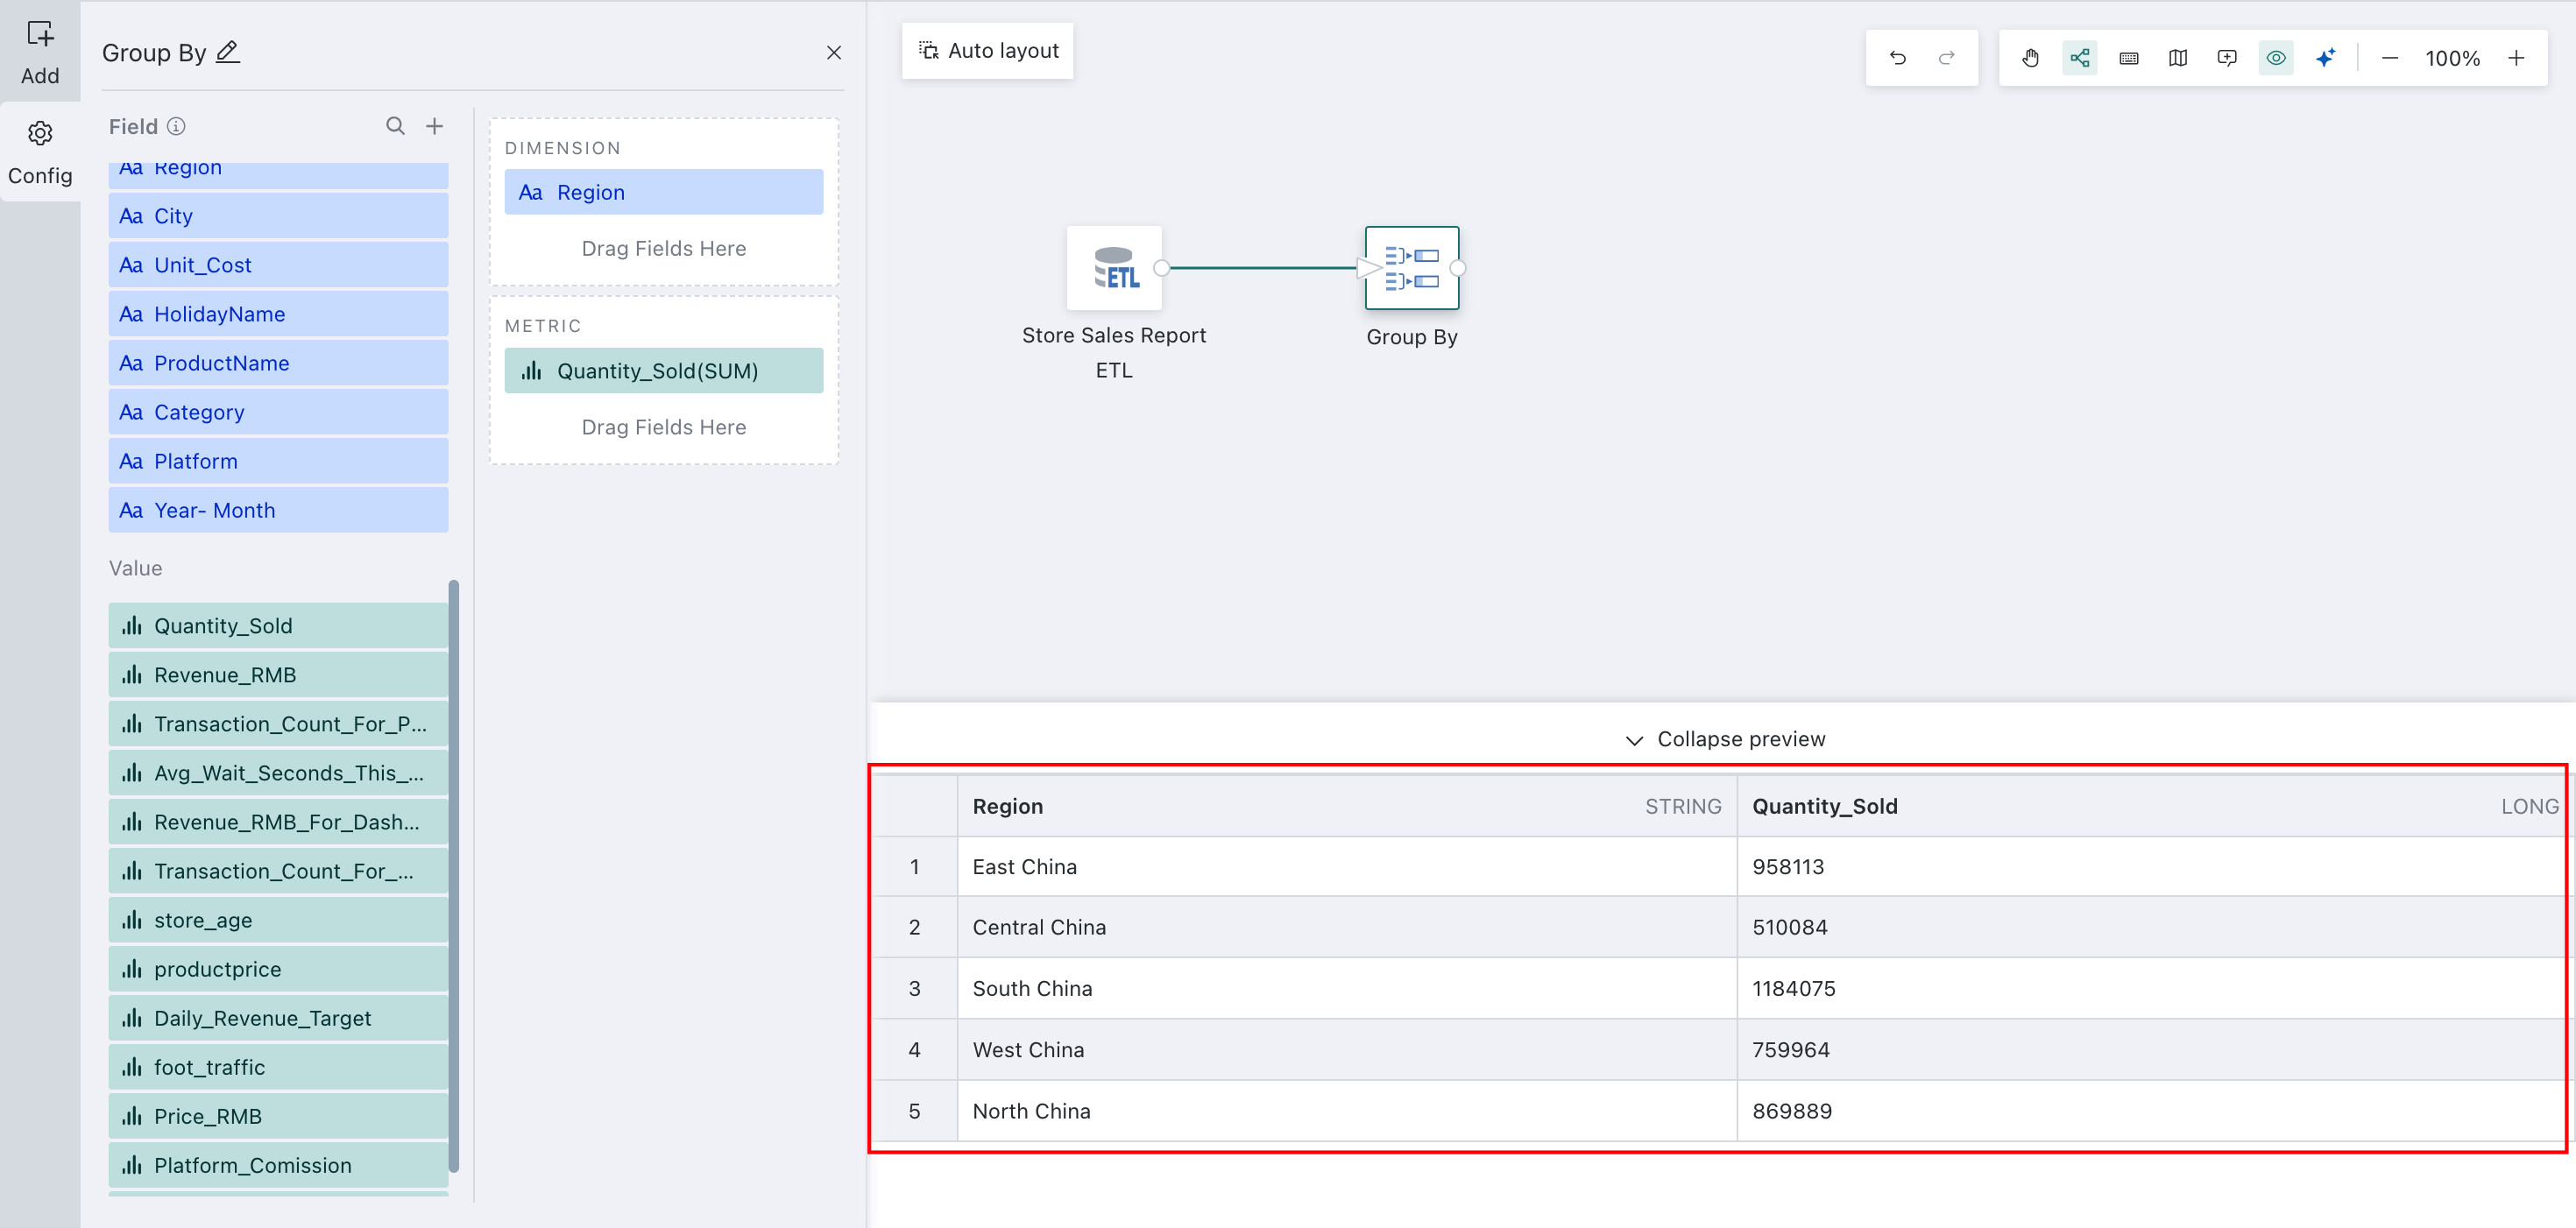
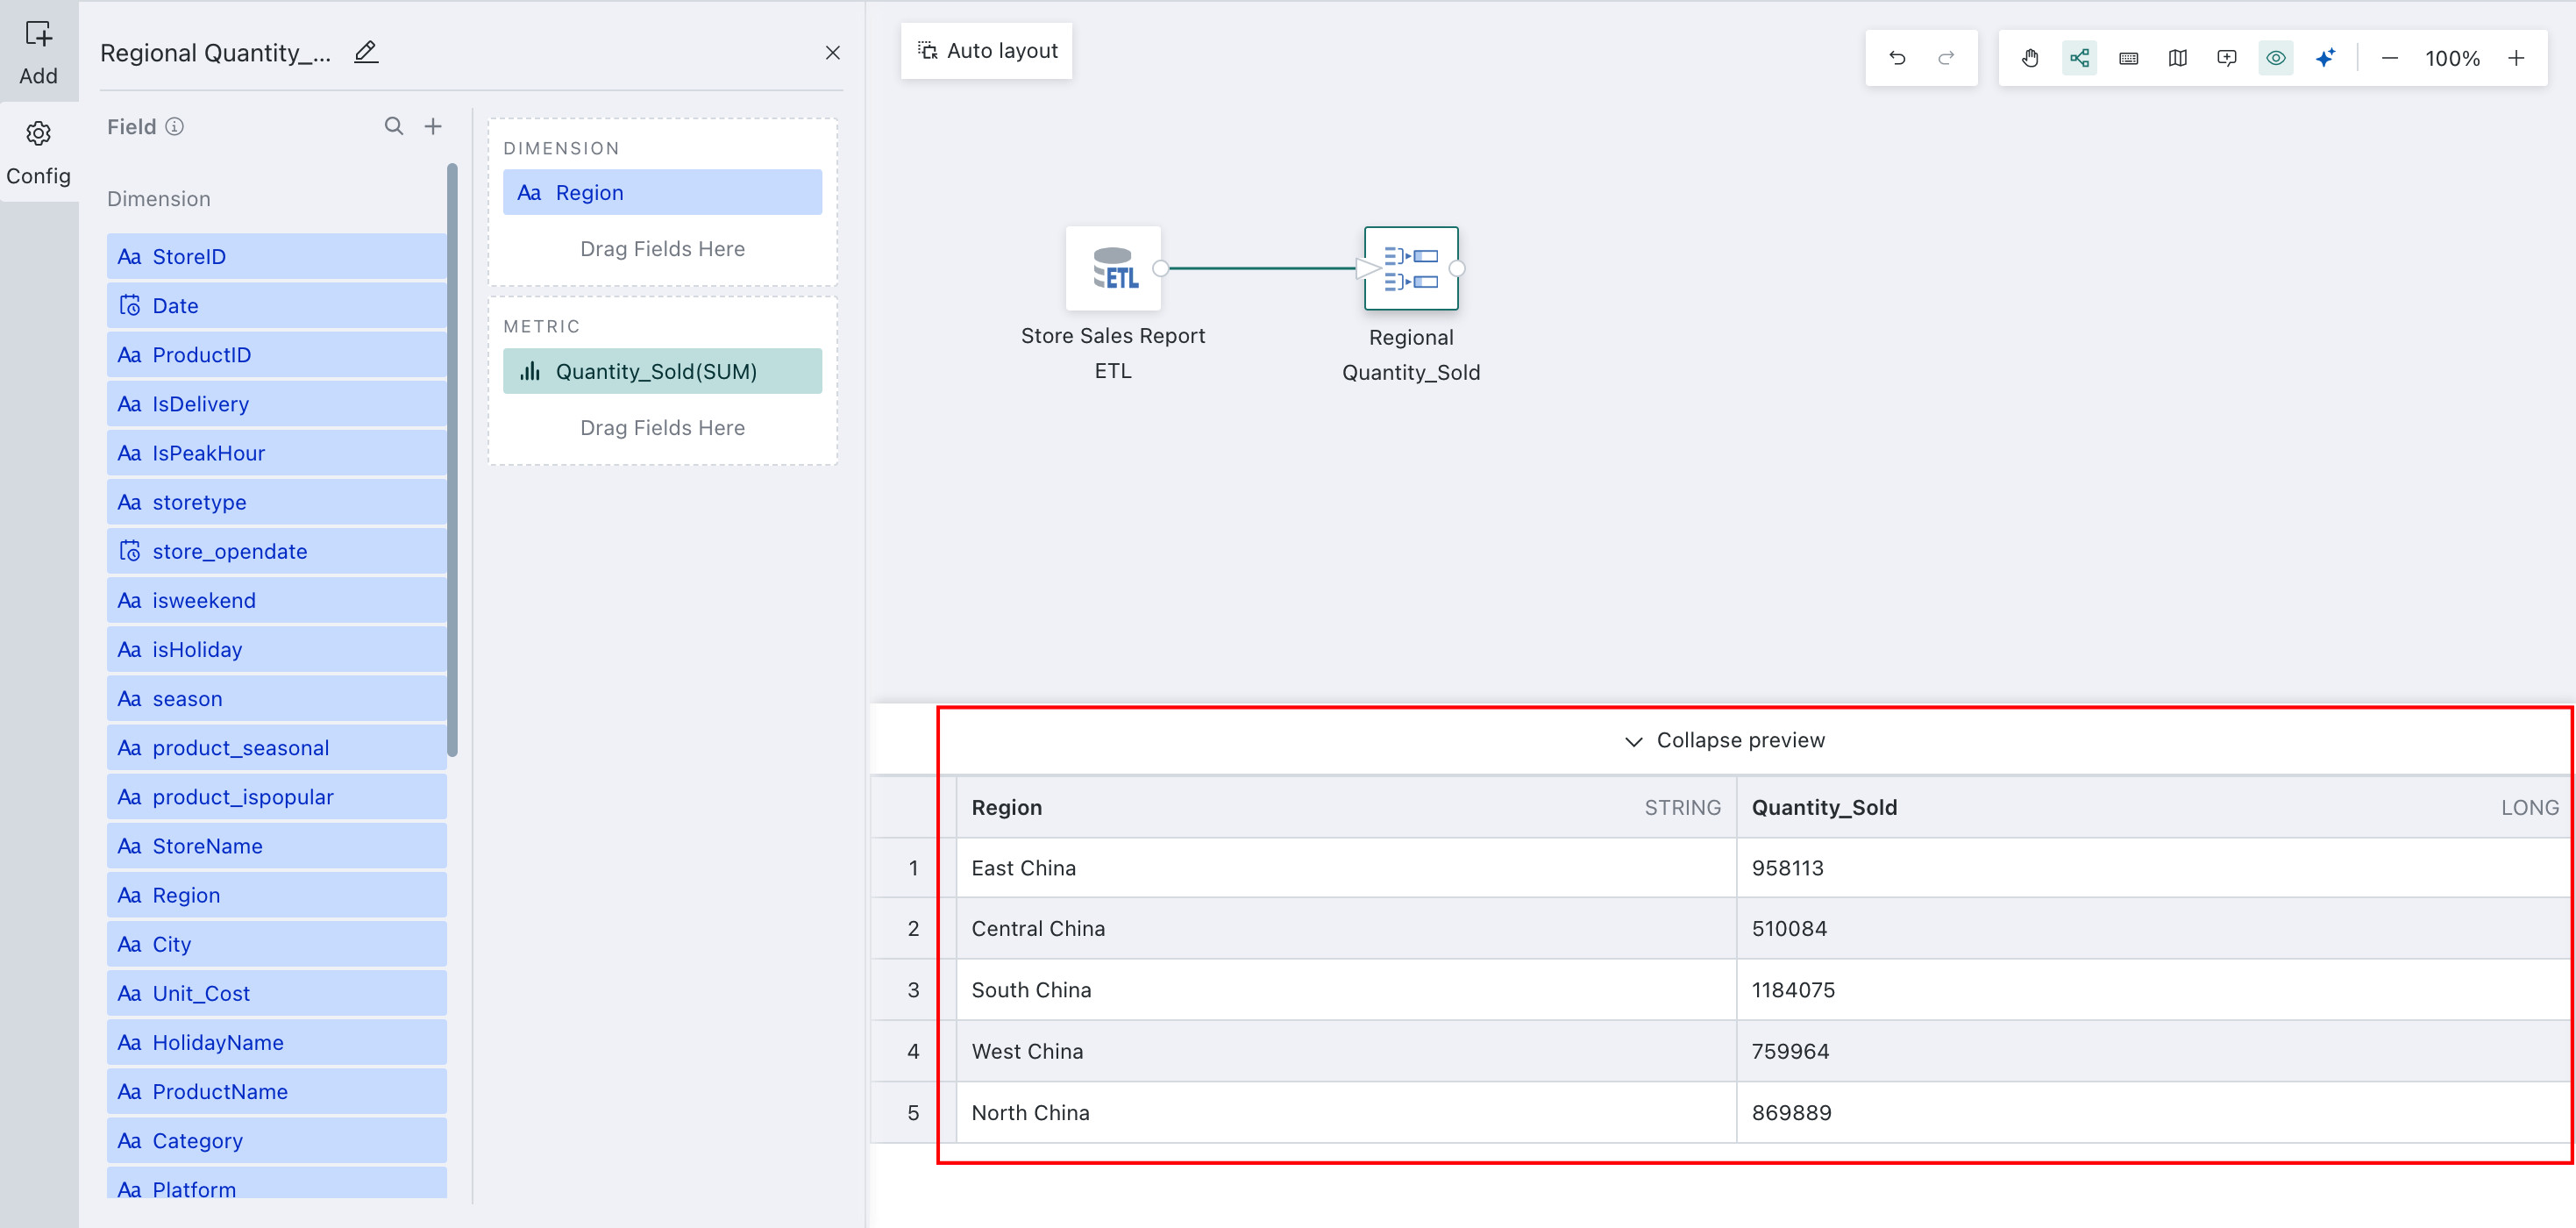
-
Click Preview to preview the data result and ensure the aggregated data matches expectations and does not contain errors or abnormal values.
For other data processing operators used later, see Getting Started.