Build a Simple Data Preparation Flow
Overview
This case shows how to use Smart ETL to perform data preparation efficiently. You will learn how to combine product data, store data, and retail transaction data into a single sales detail table that is ready for further analysis.
The sample datasets used in this case are available in ETL Sample Data.
Prerequisites
- Create folders in
Data Preparation > DatasetandSmart ETLto store the input datasets and Output Datasets for this example. You can name the folderStore Sales Statistics. - Under
Data Preparation > Dataset, ingest the three file datasets used as the raw source data.
Steps
- Open
Smart ETL, create a new ETL task in the folder, and name the task. - Drag the
Input Datasetoperator into the canvas three times and select the product table, store table, and retail table. - Use multiple ETL operators to merge the three source tables, remove dirty data, and add calculated columns to create a sales detail table suitable for visual analysis.
- Drag the
Output Datasetoperator into the canvas, preview the data flow and result, confirm the logic, and then save and run the ETL task. - After the task runs successfully, review the result or adjust the task configuration if needed.
Create a New ETL Task
-
In the target folder under
Smart ETL, clickAdd ETL.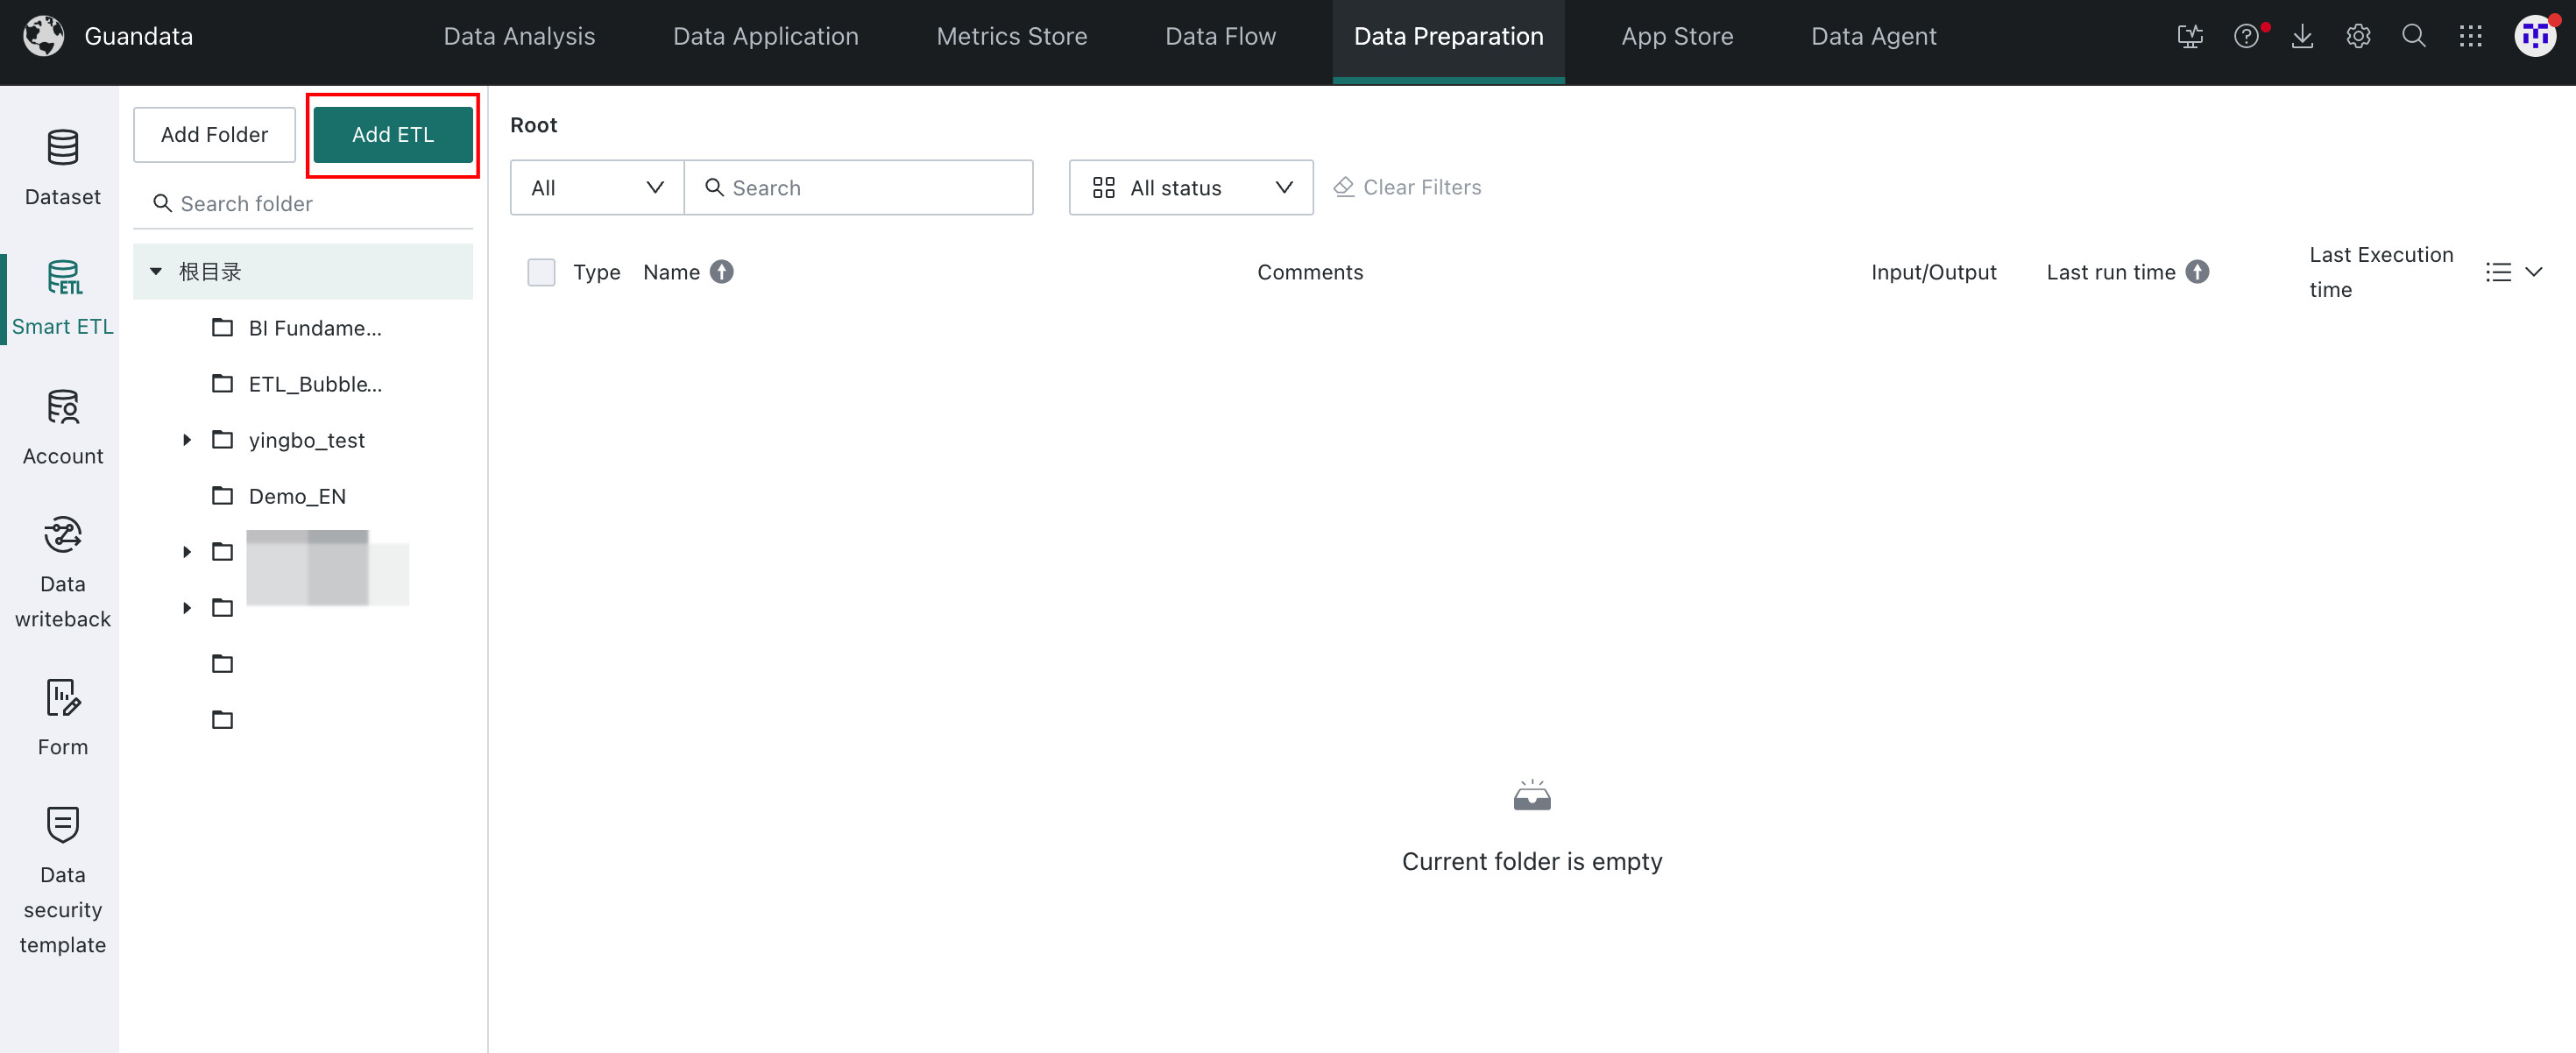
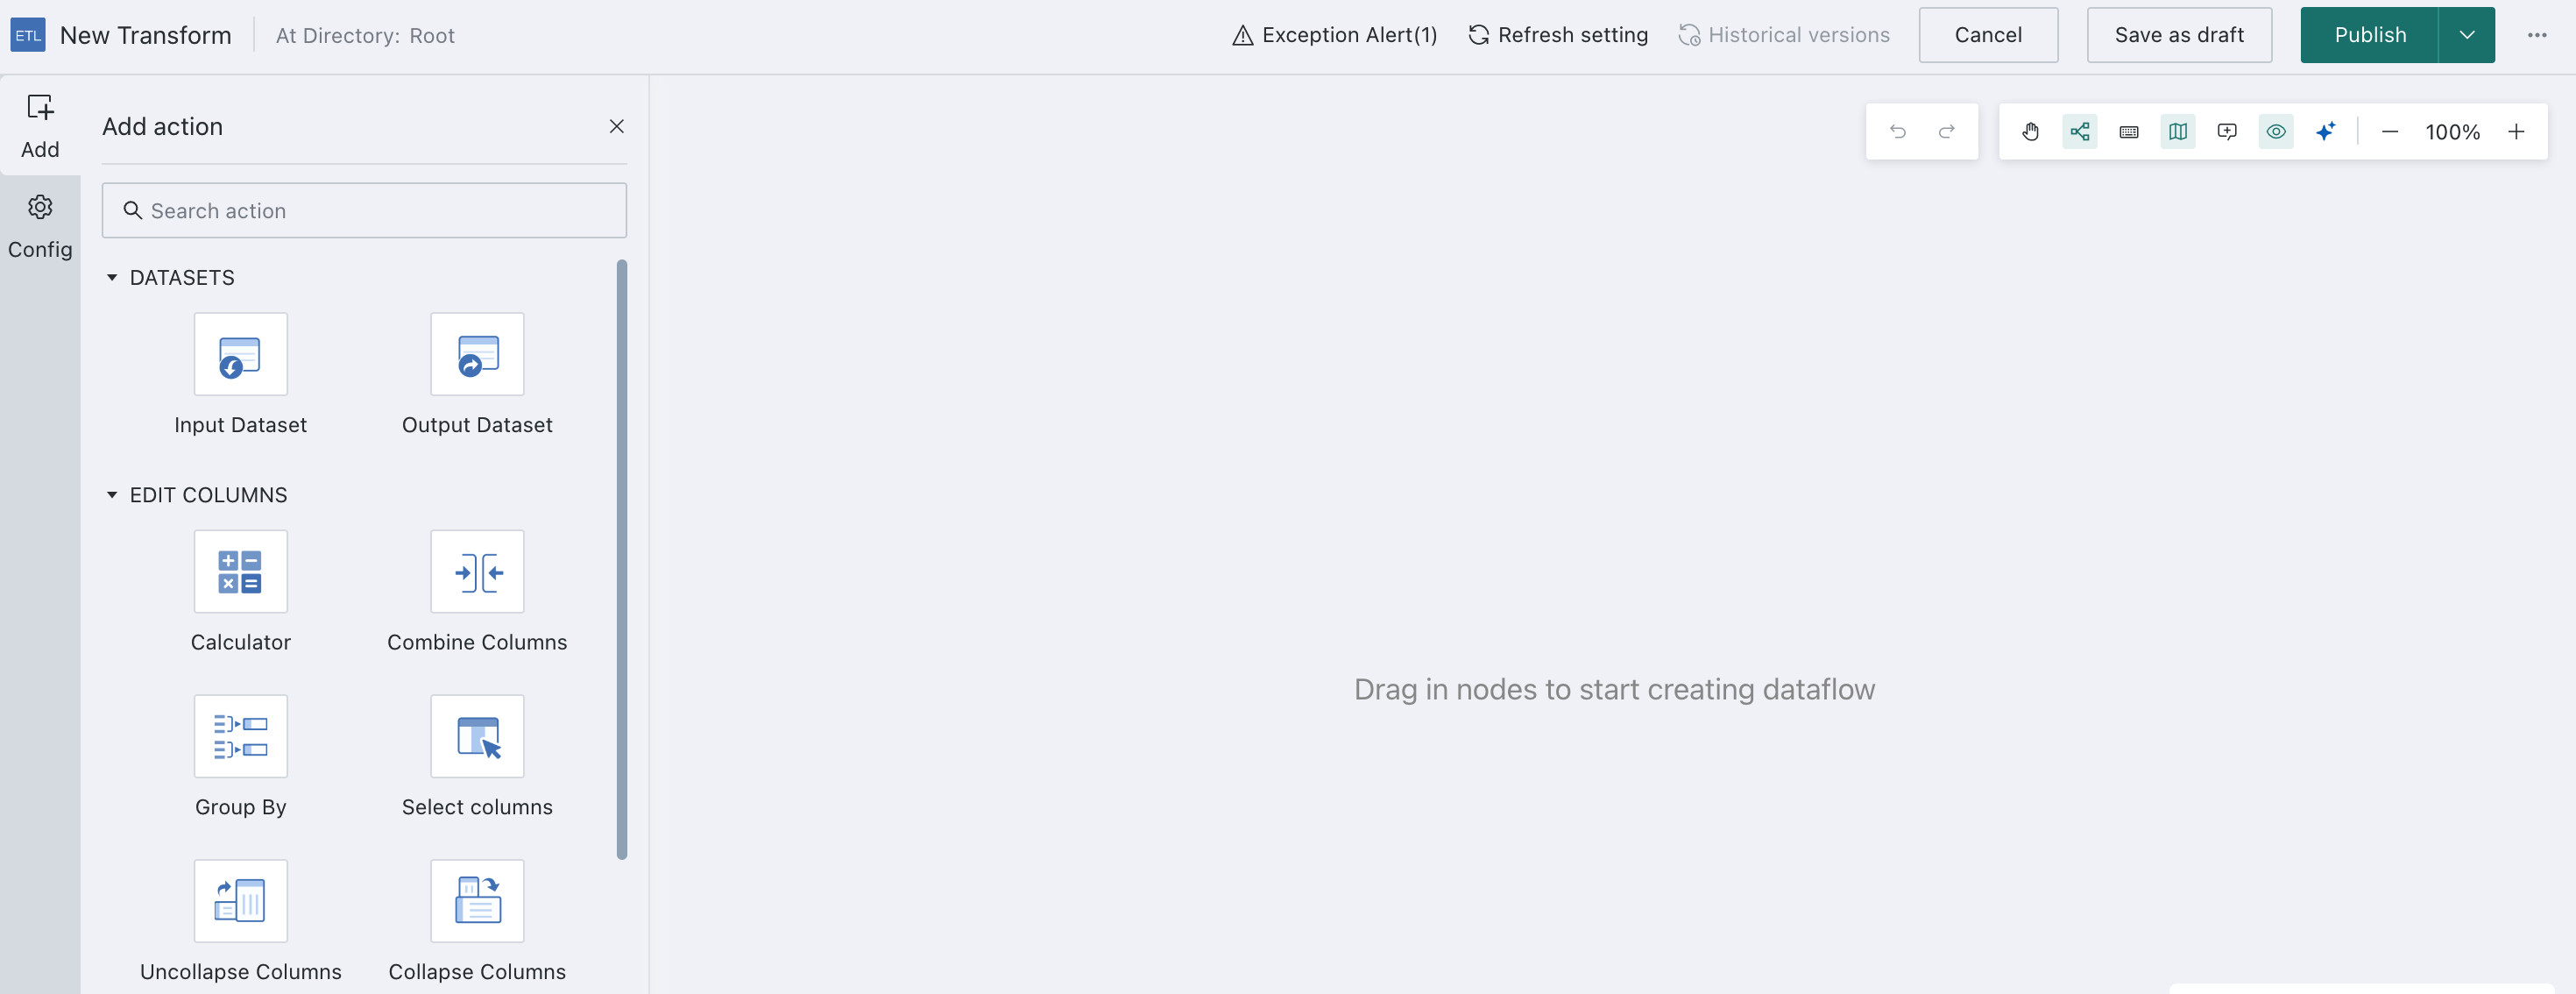
-
After the task is created, the system opens the ETL editor directly.
-
Rename the task to
ETL_Store Sales Statisticsand choose the storage path.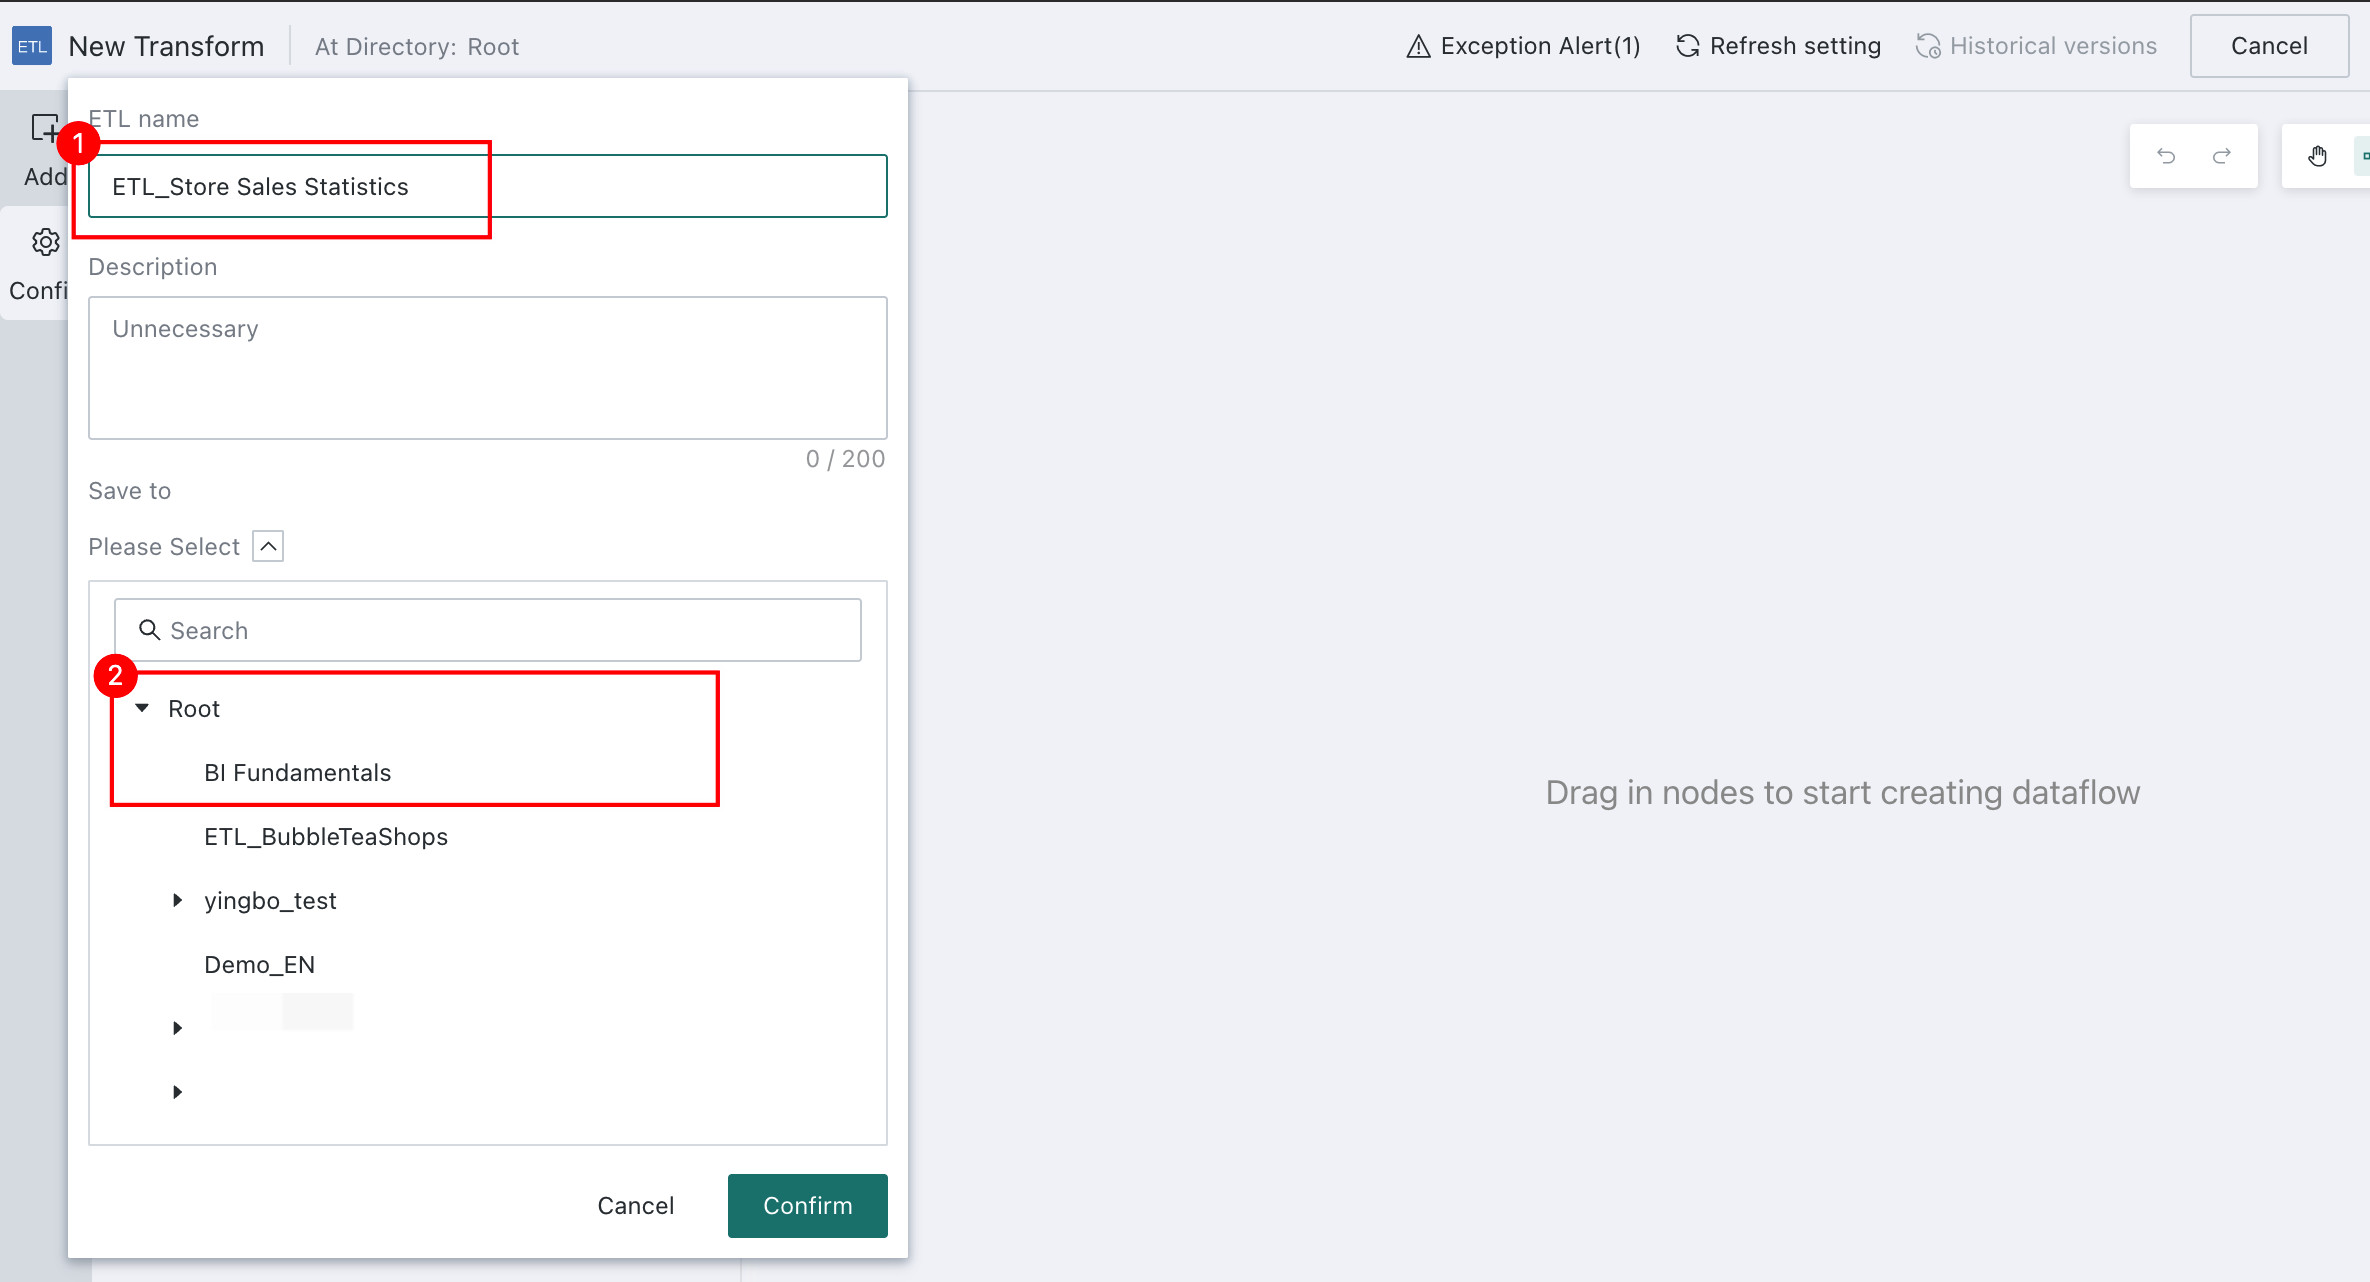
Build the ETL Flow
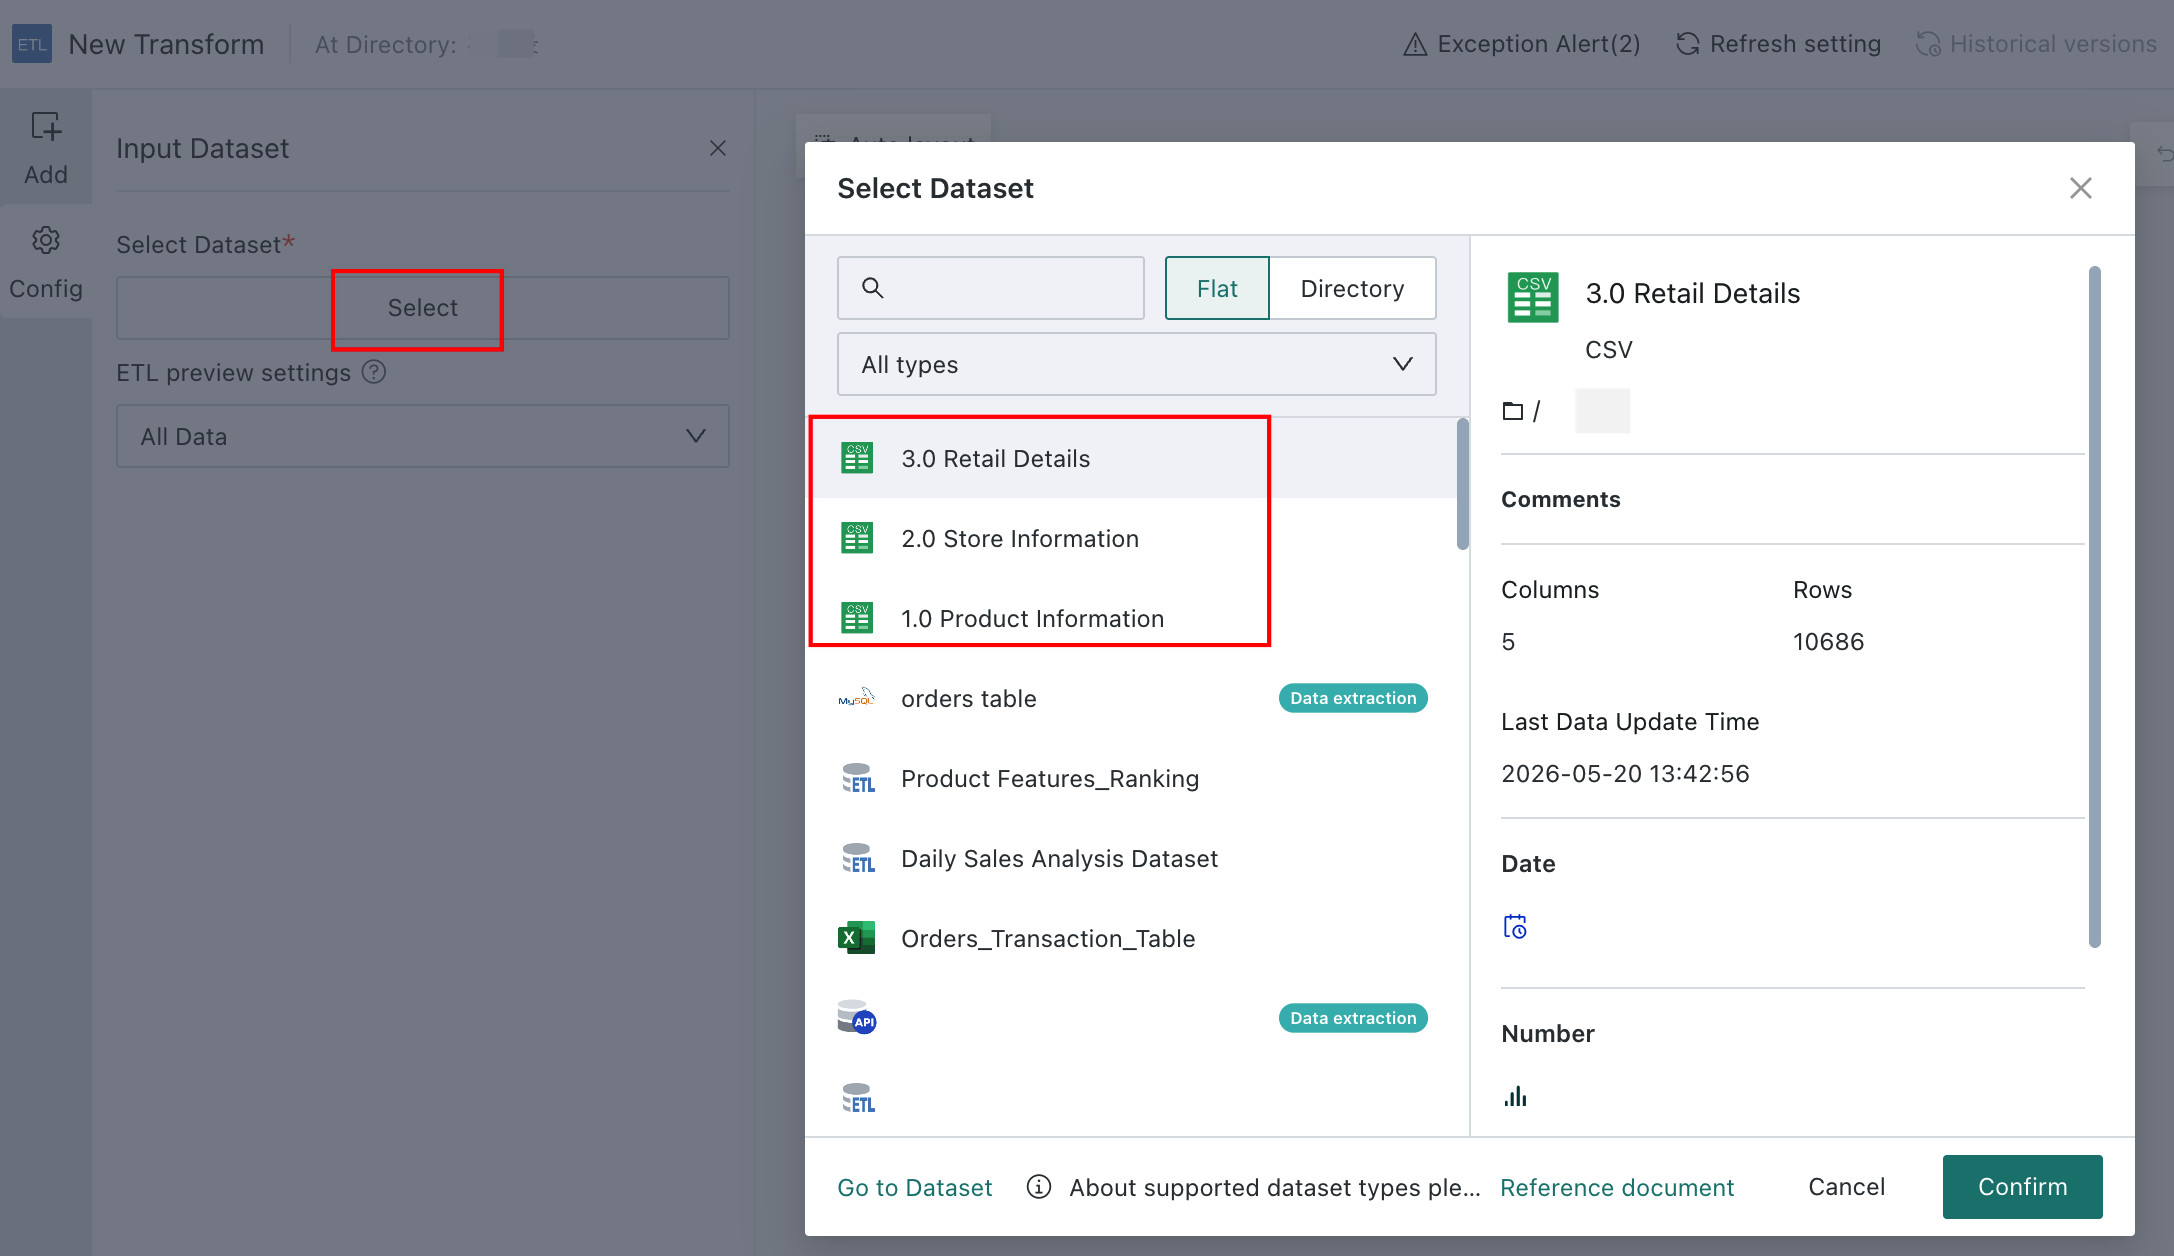
Add Input Datasets
Drag the Input Dataset operator into the canvas and select datasets:
- 1.0 Product Information
- 2.0 Store Information
- 3.0 Retail Details
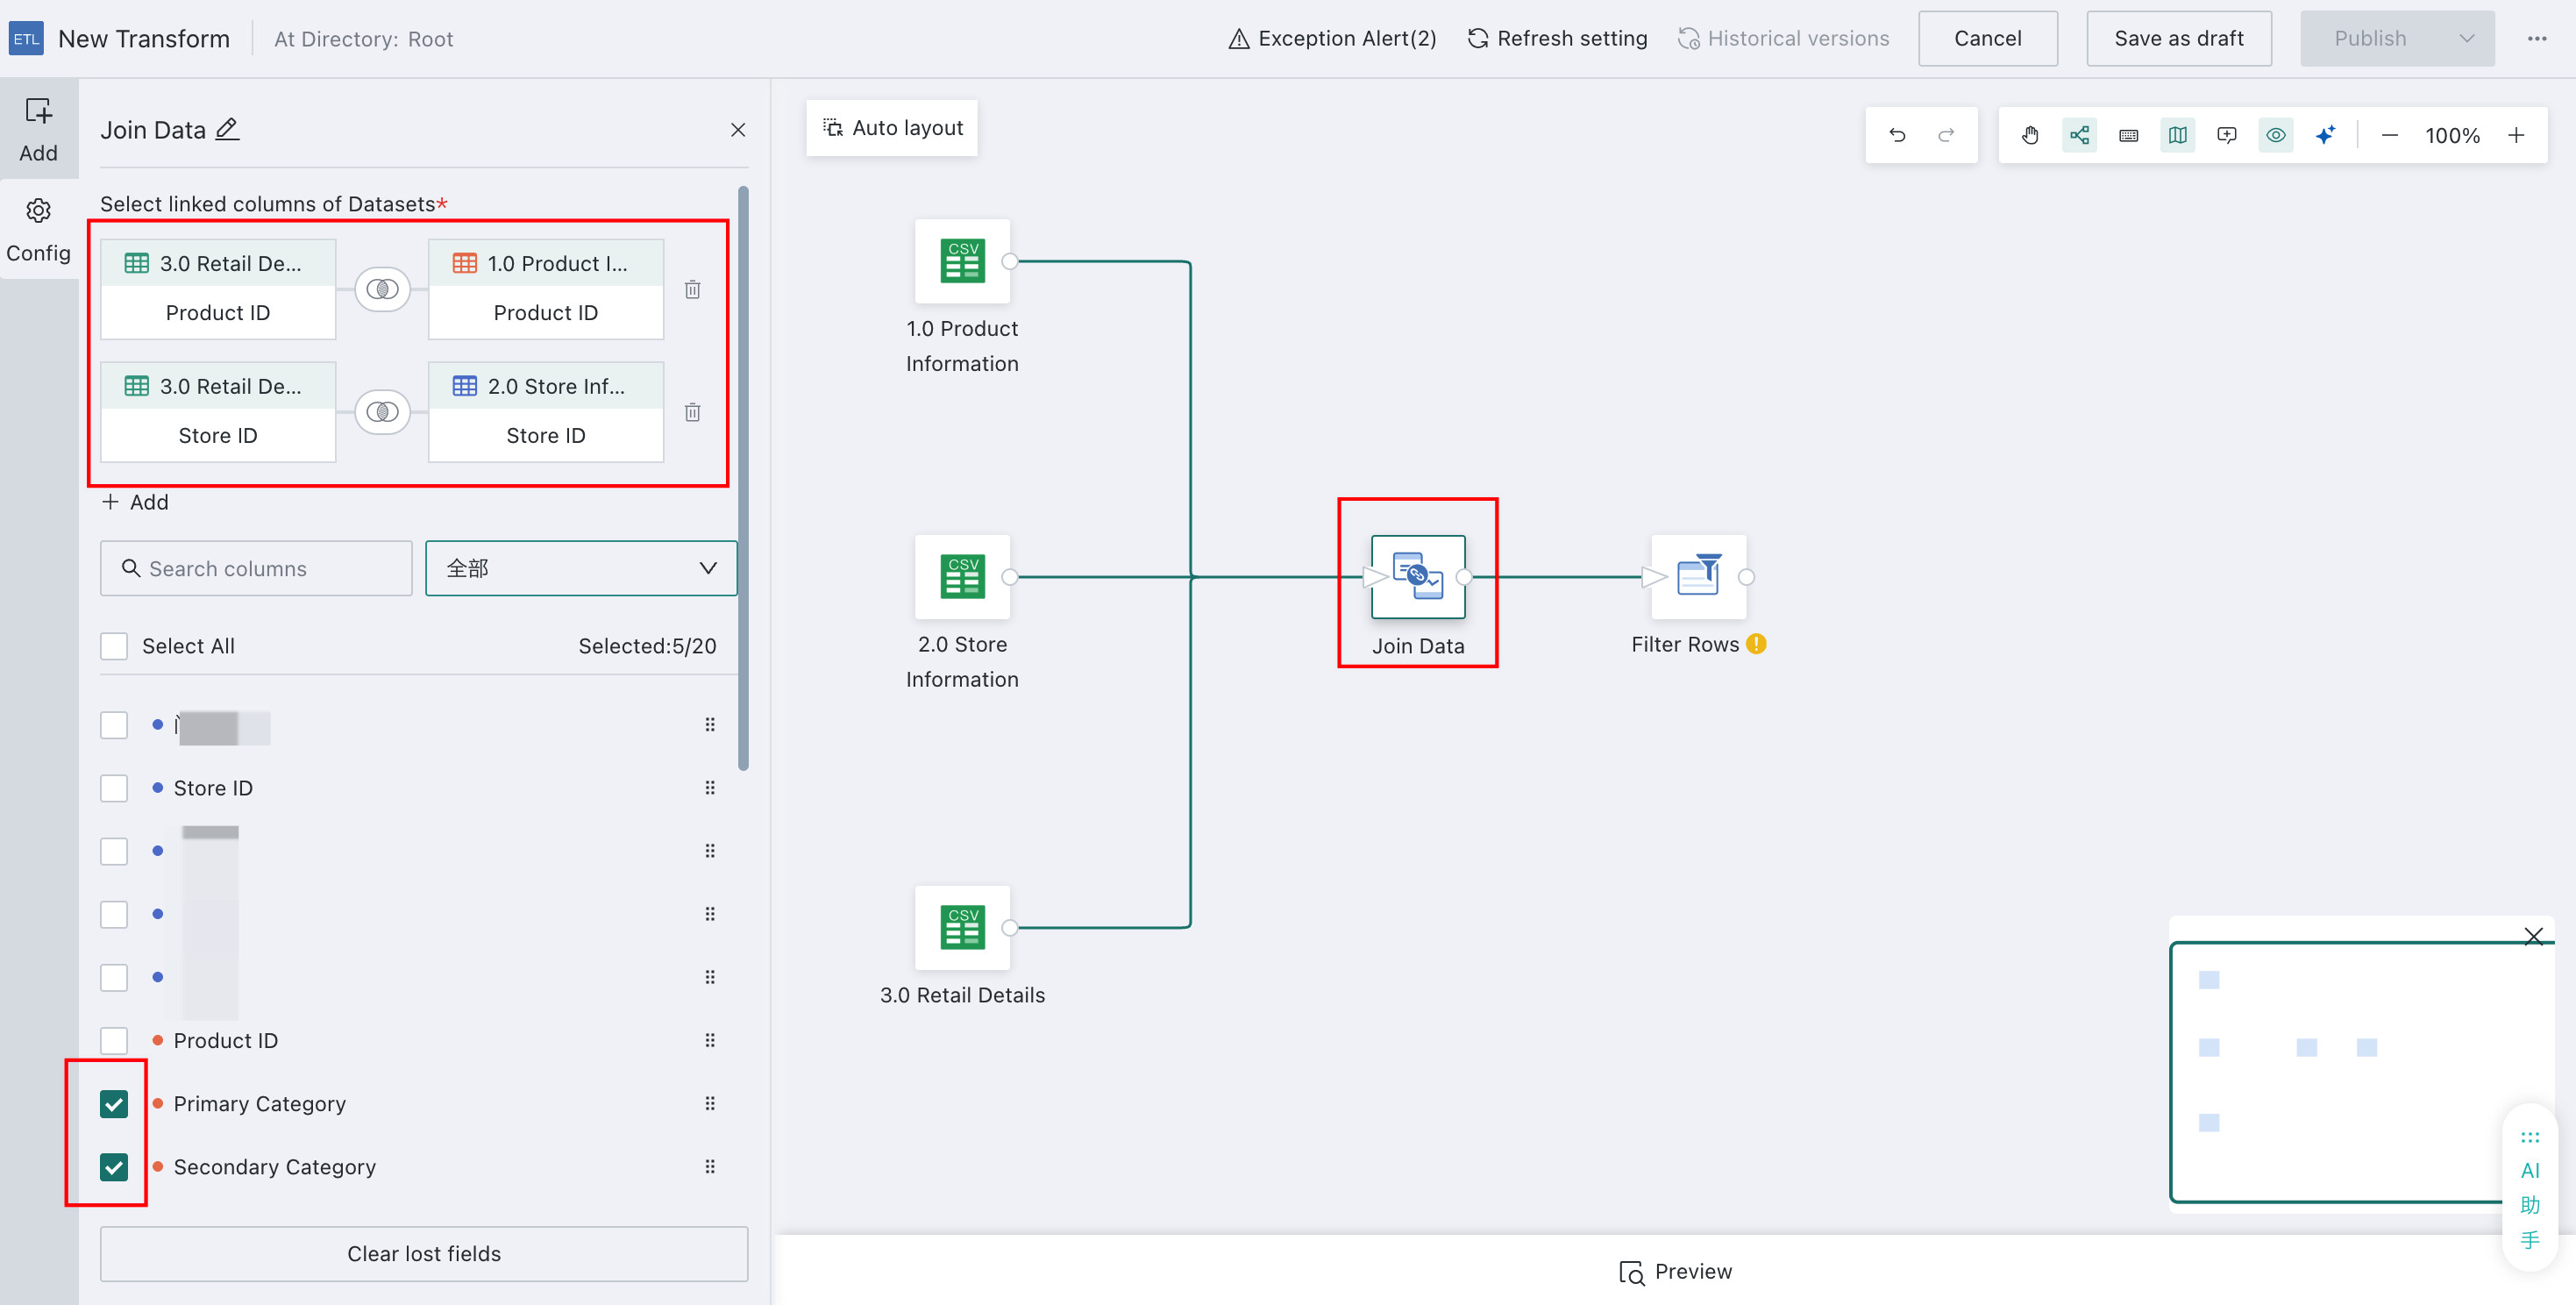
Configure Table Joins
Use Join Data to combine the three datasets into one so that you can produce product sales details for each store.
- Drag the
Join Dataoperator into the canvas and connect the three Input Datasets. - Configure the joins using the following Left Join rules:
3.0 Retail Details / Product ID = 1.0 Product Information / Product ID3.0 Retail Details / Store ID = 2.0 Store Information / Store ID
- Select the columns to output. Since
3.0 Retail Detailsis the main table, avoid selecting duplicate join fields from the secondary tables.
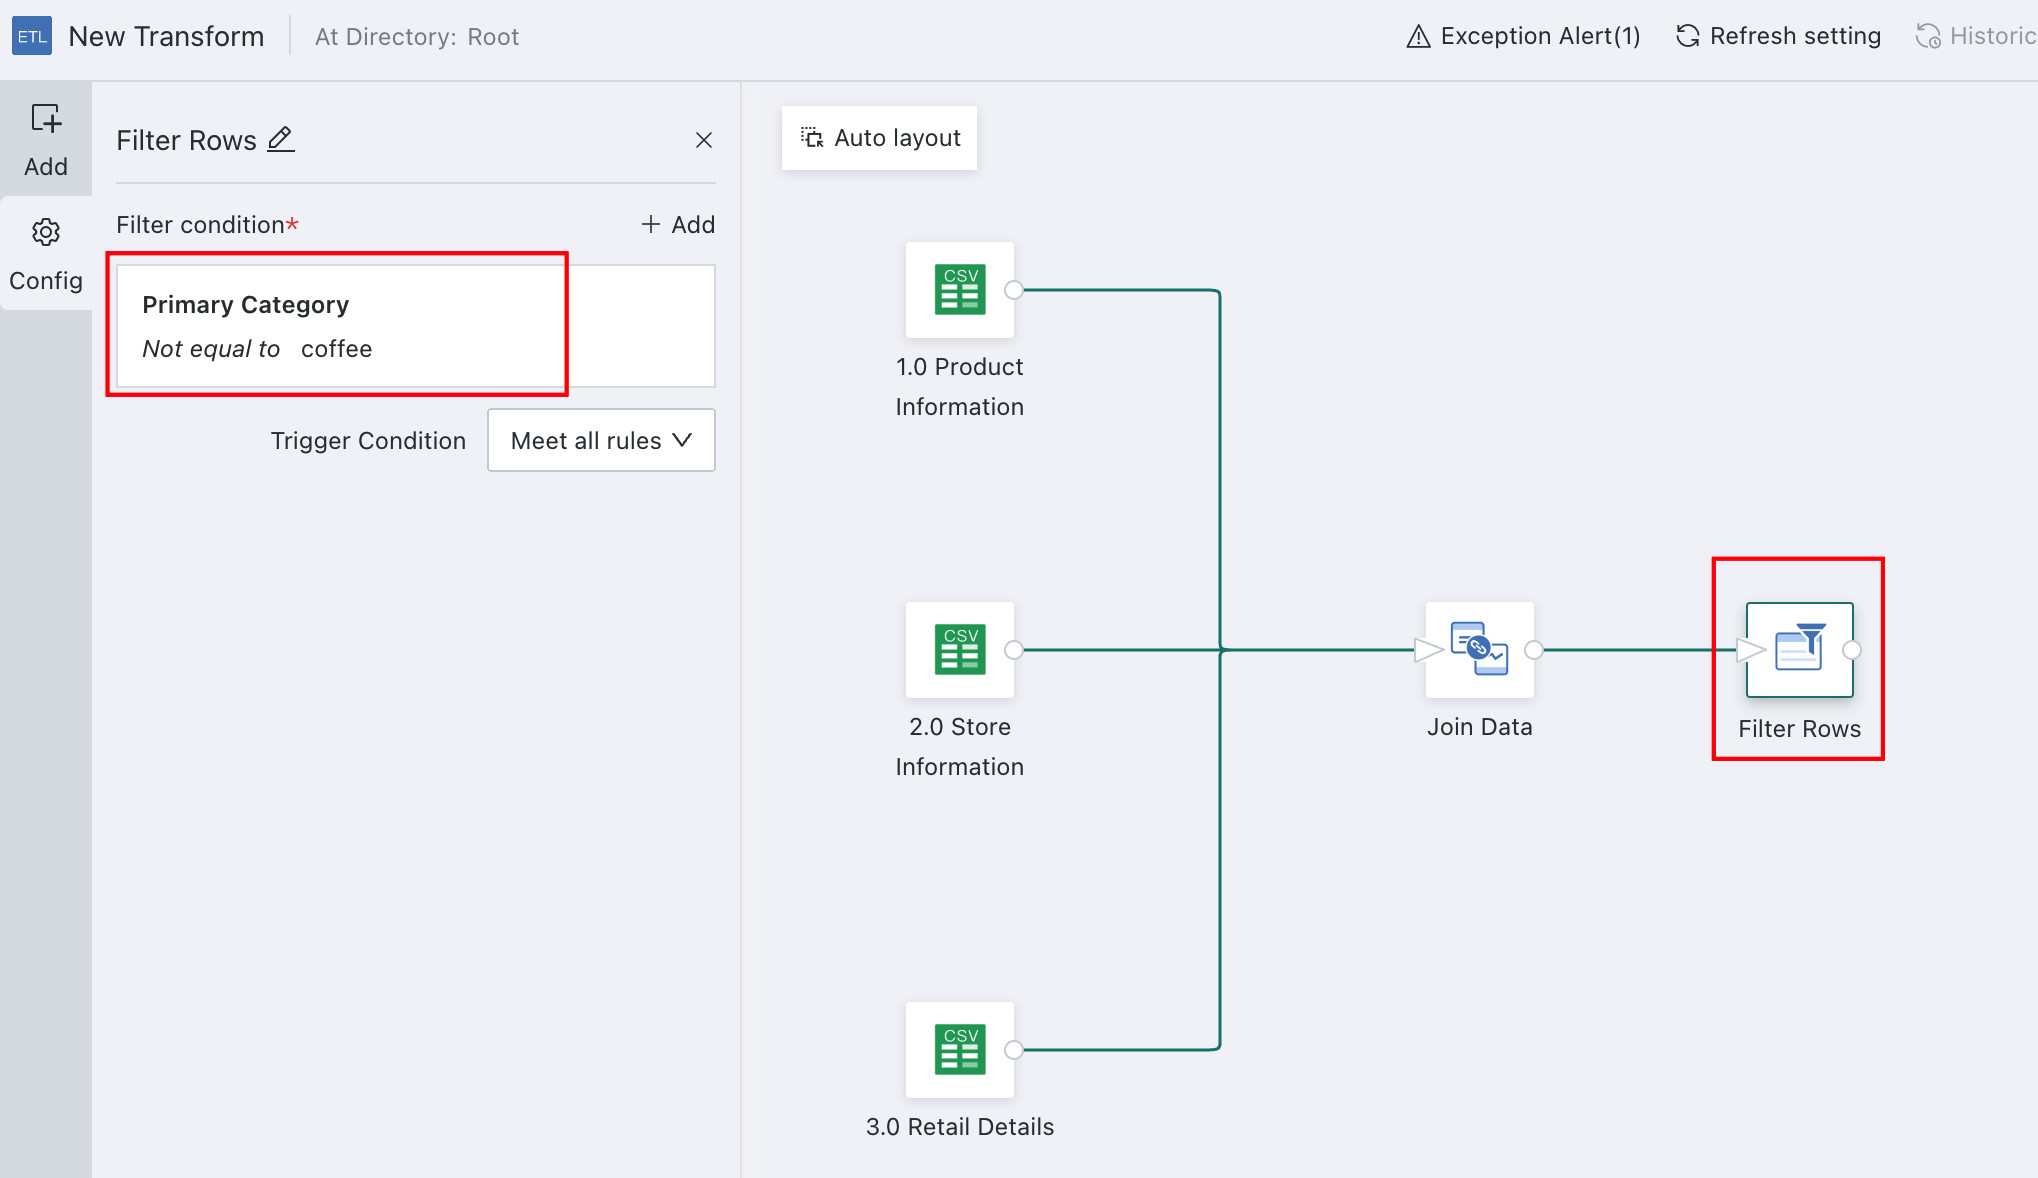
Remove Invalid Dirty Data
When the source data contains large amounts of dirty data, or only part of the data is needed, use Filter Data Rows.
In this example, rows related to Coffee are excluded because they are not included in store consumption analysis.
- Drag the
Filter Data Rowsoperator into the ETL canvas. - Add the filter conditions: Category
!= Coffee
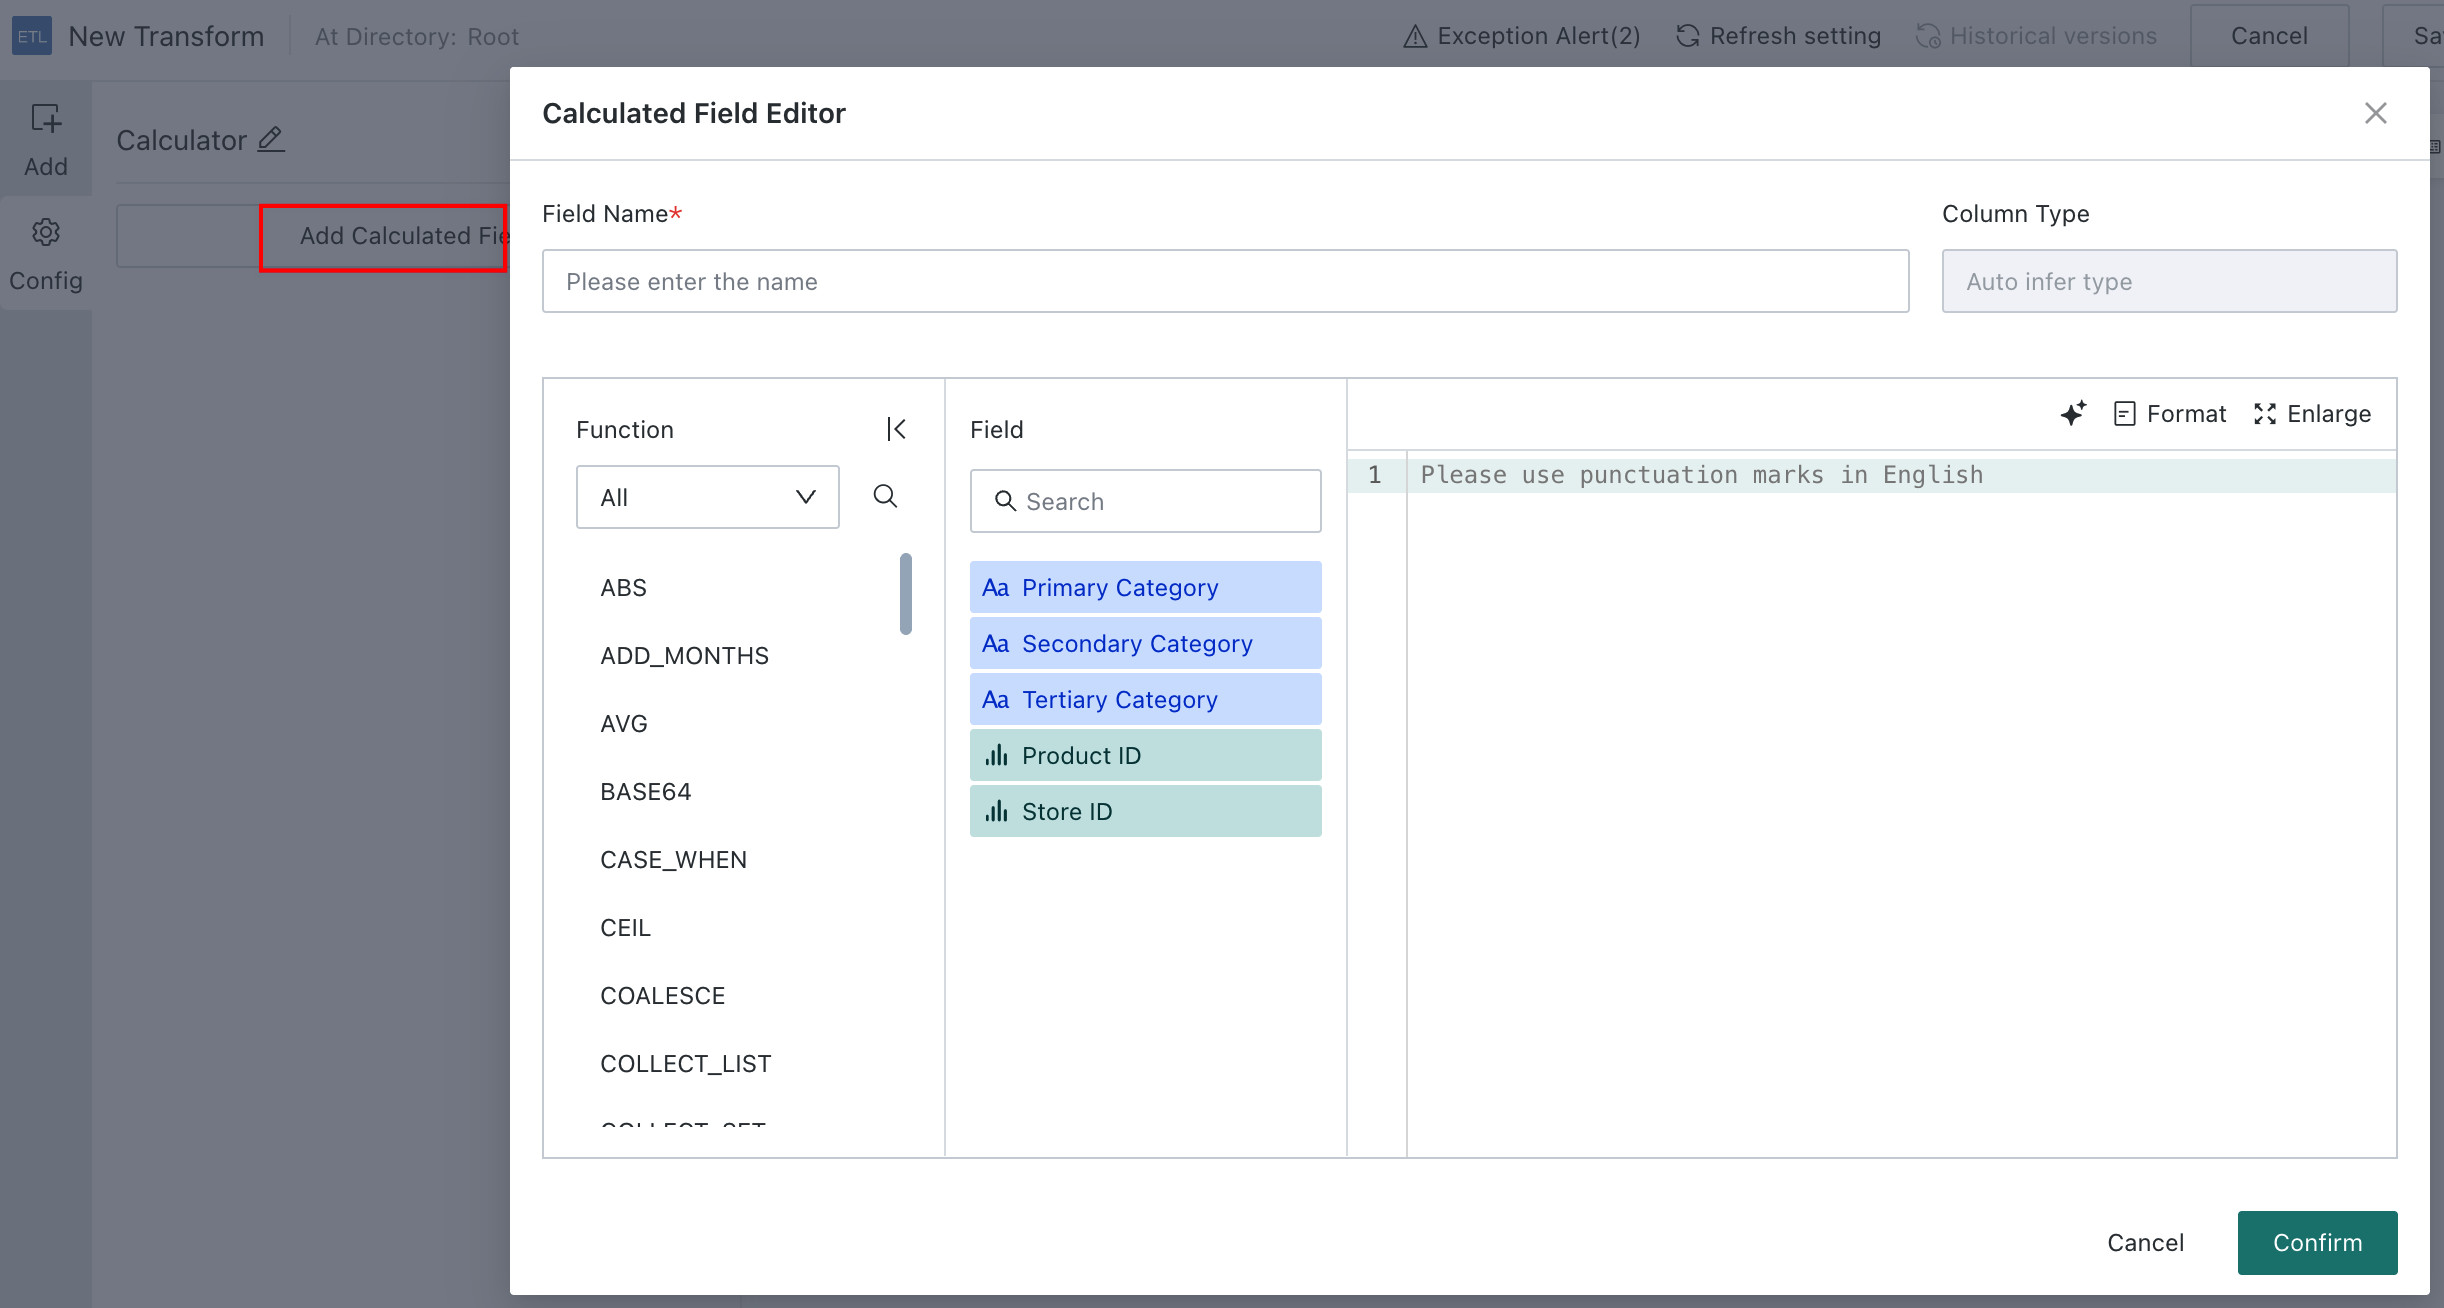
Add a Calculated Column
Extend the existing dataset by adding new metrics needed for analysis.
In this example, create a new field named Amount with the formula:
Amount = Quantity * Retail Price
Drag the Add Calculated Column operator, click Add Calculated Field, create the Amount field, and set the field type to Number.
Output the Dataset and Run the ETL
Use the Output Dataset operator to export the processed data as a reusable dataset for later analysis and visualization.
-
Drag the
Output Datasetoperator, name the resultSales Detail Dataset, and choose the output path.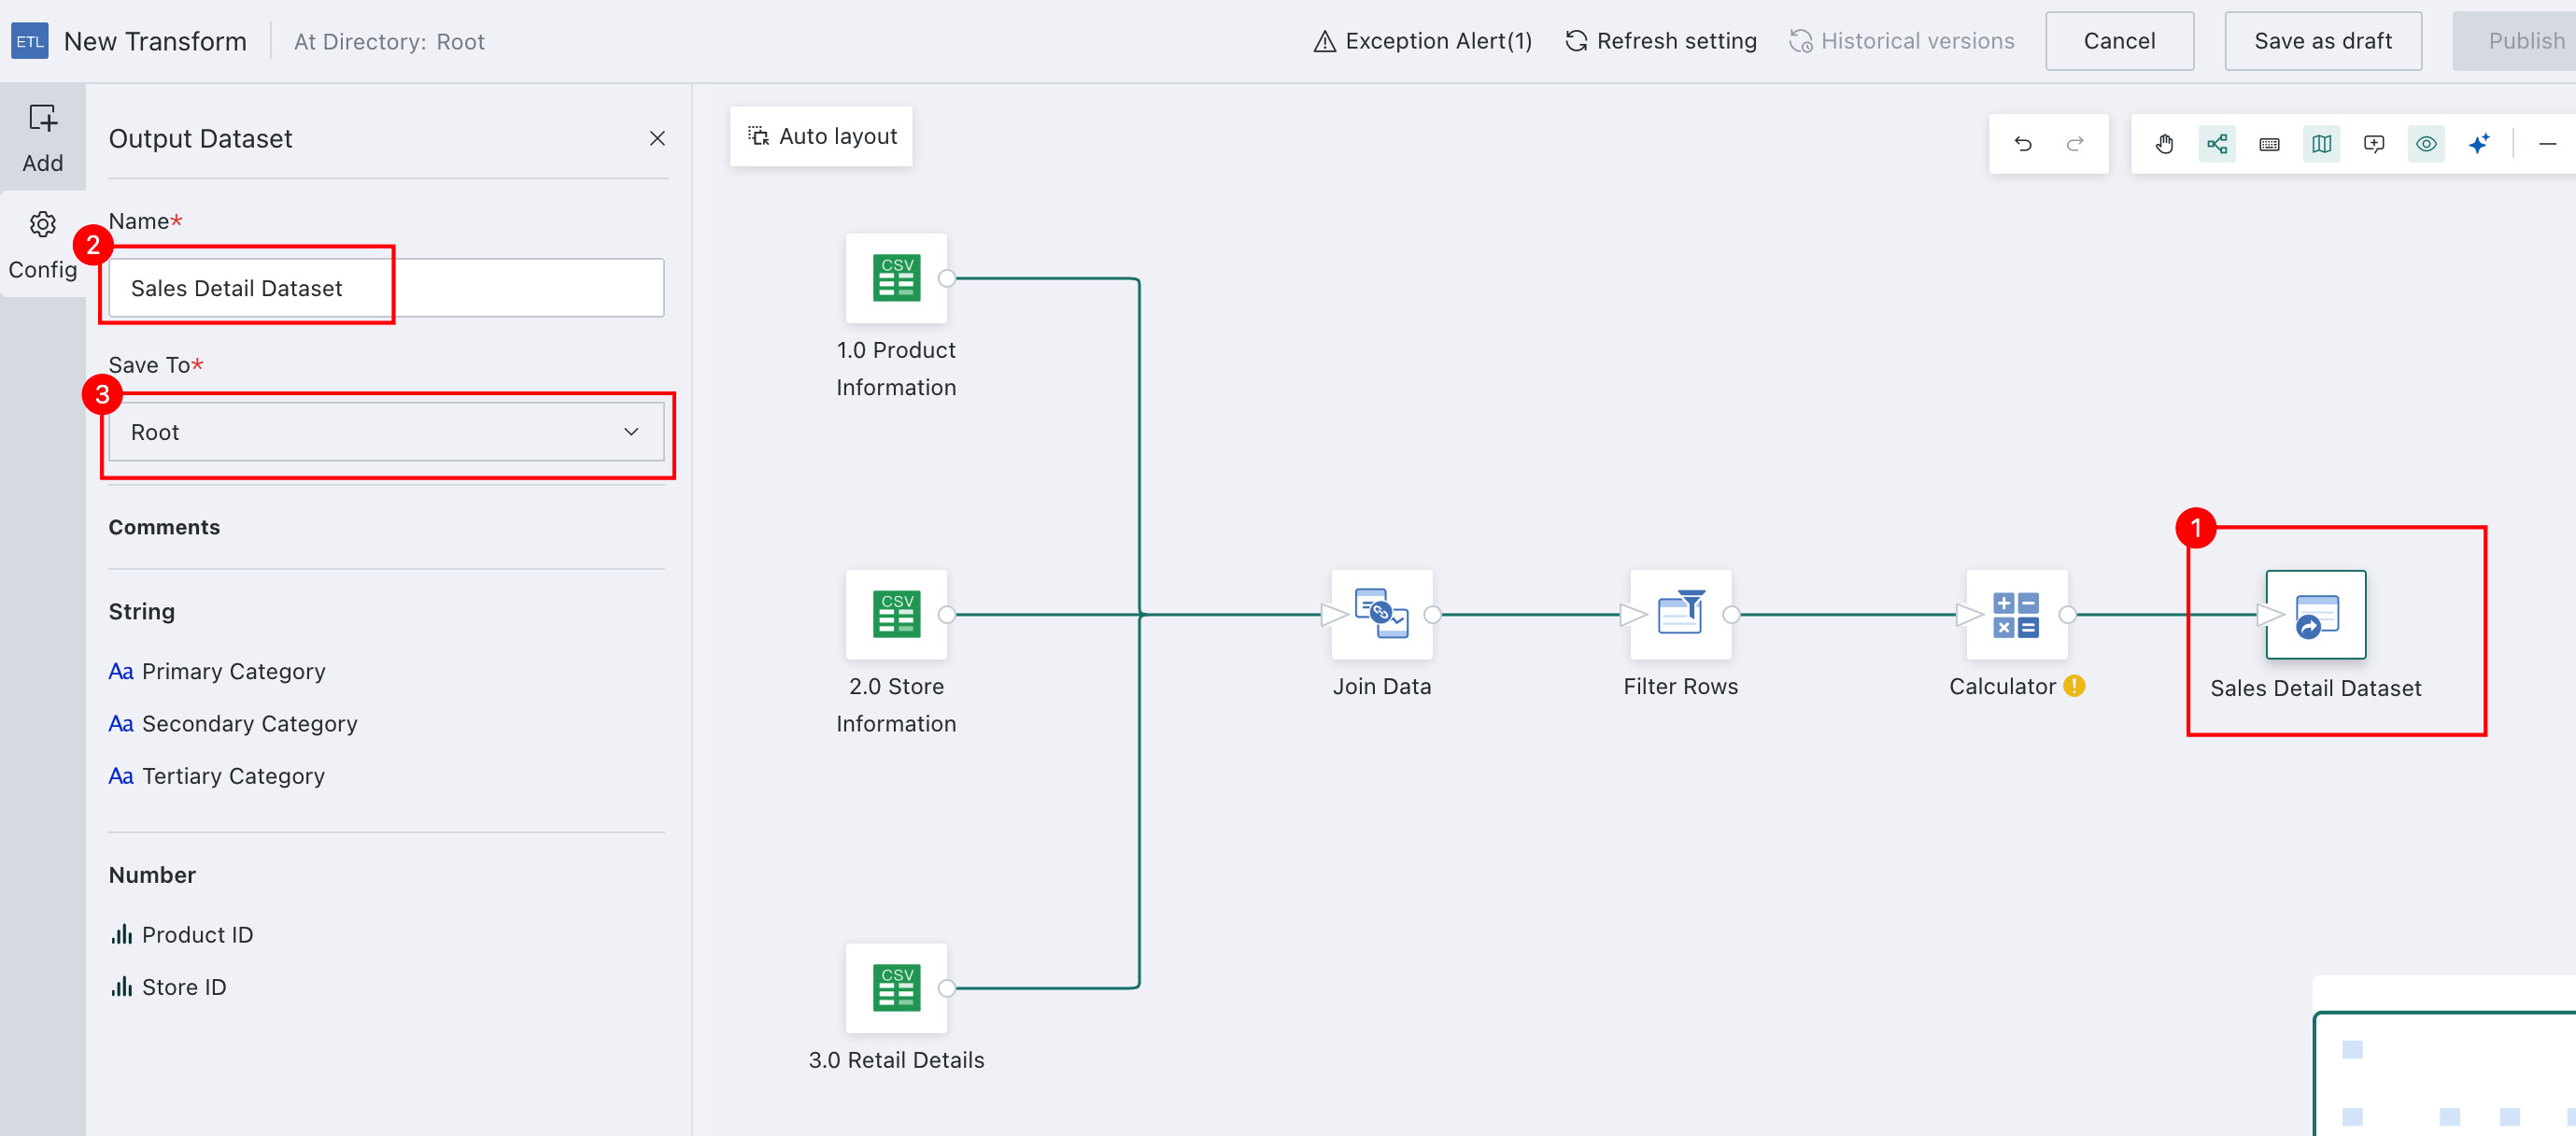
-
Click the
Publishdropdown in the upper-right corner and chooseSave, Run, and Exit.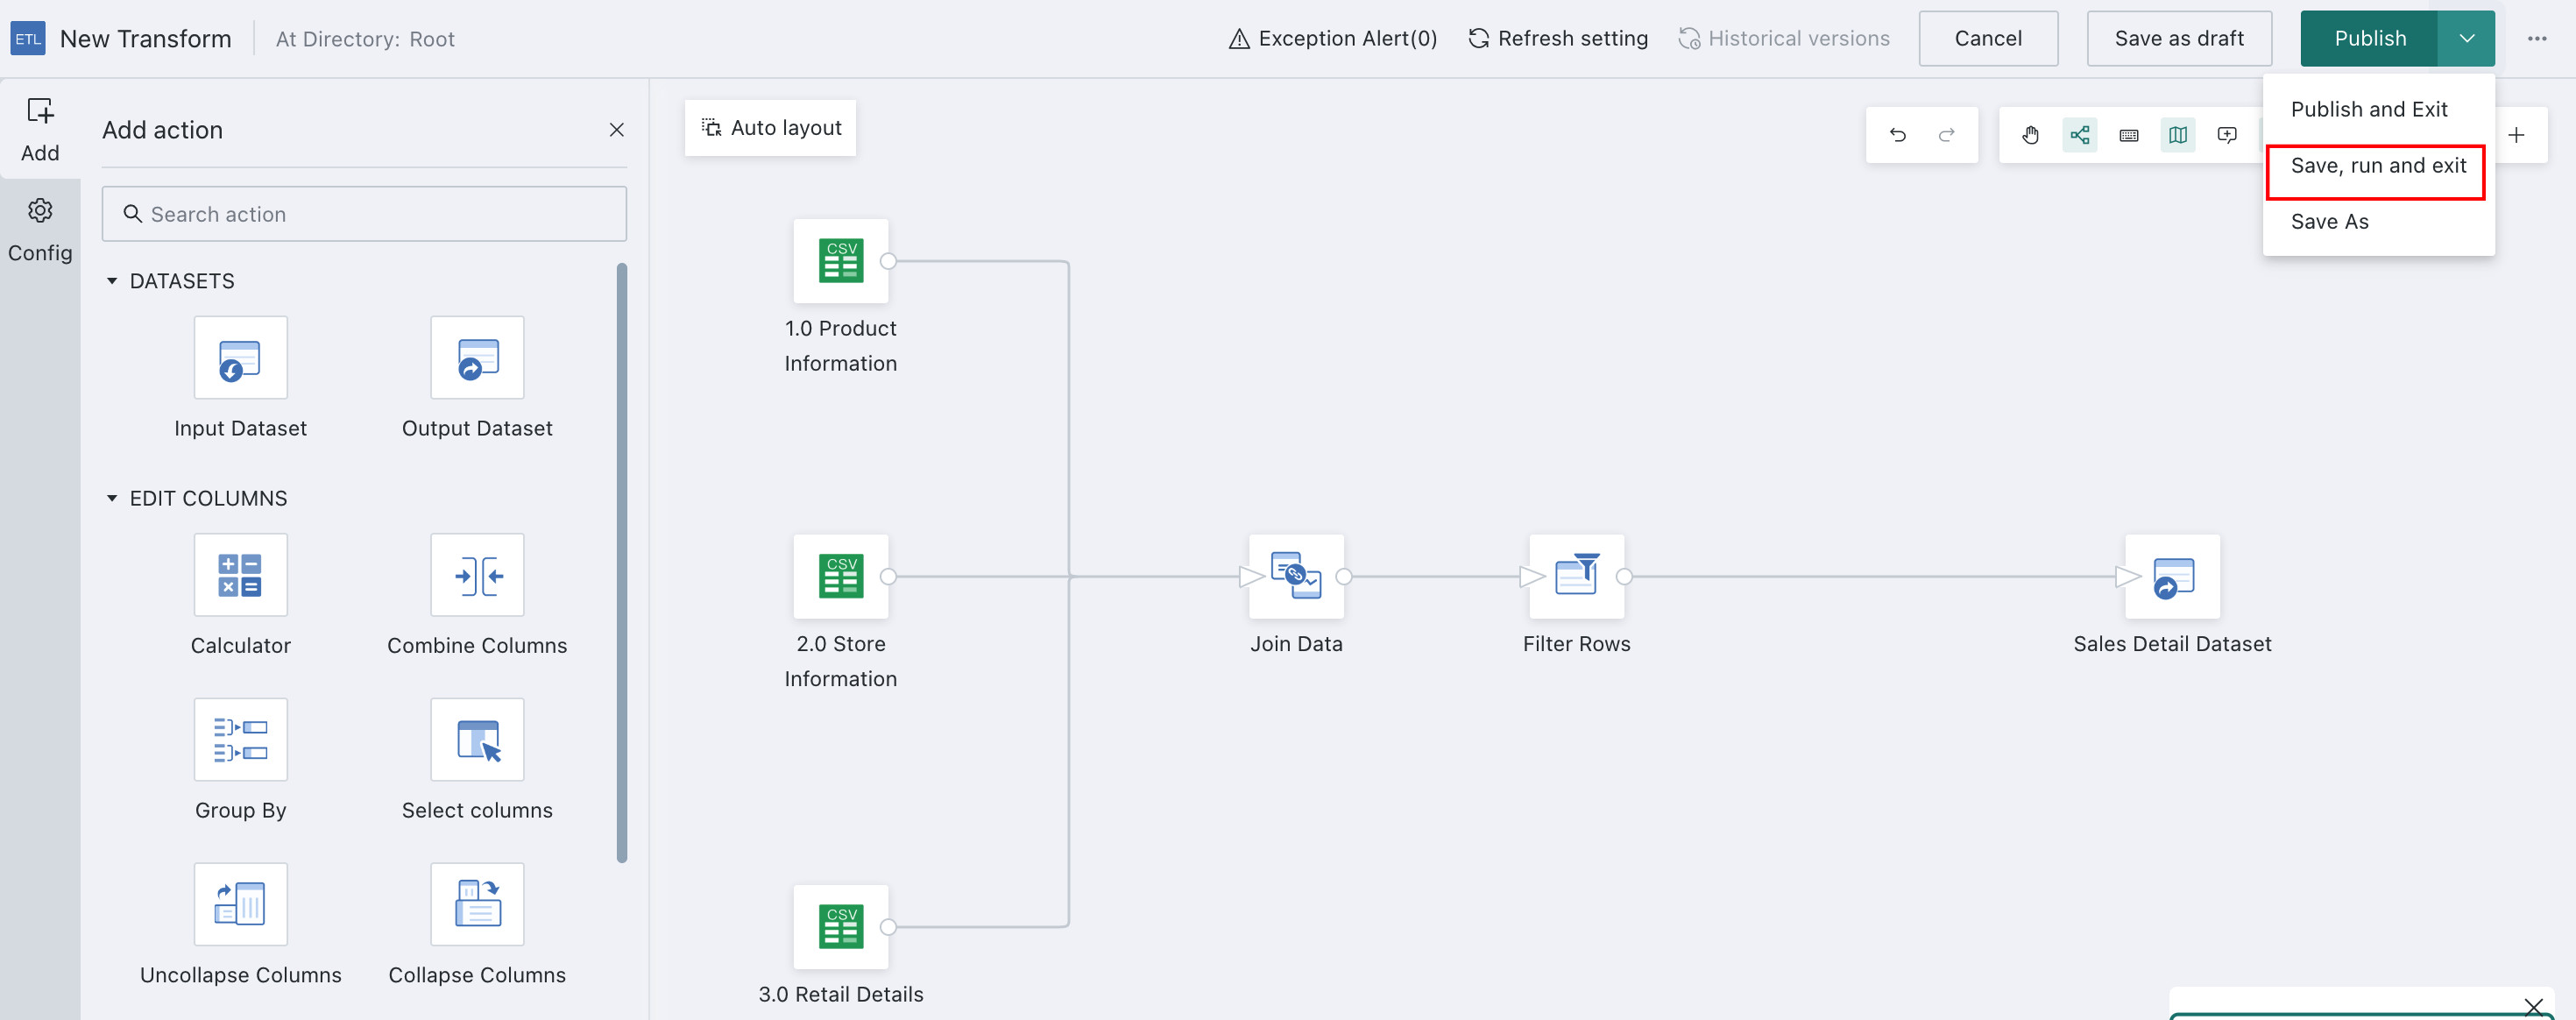
After the run completes, you can open the ETL details page to review the Output Dataset.
Manage the ETL Task
ETL Scheduling
If you process real-time or frequently refreshed data, you can configure the ETL task to run on a schedule or after specified datasets are updated.
In this example:
-
Open the ETL details page and go to
ETL Update. -
Enable
SchedulingStatus.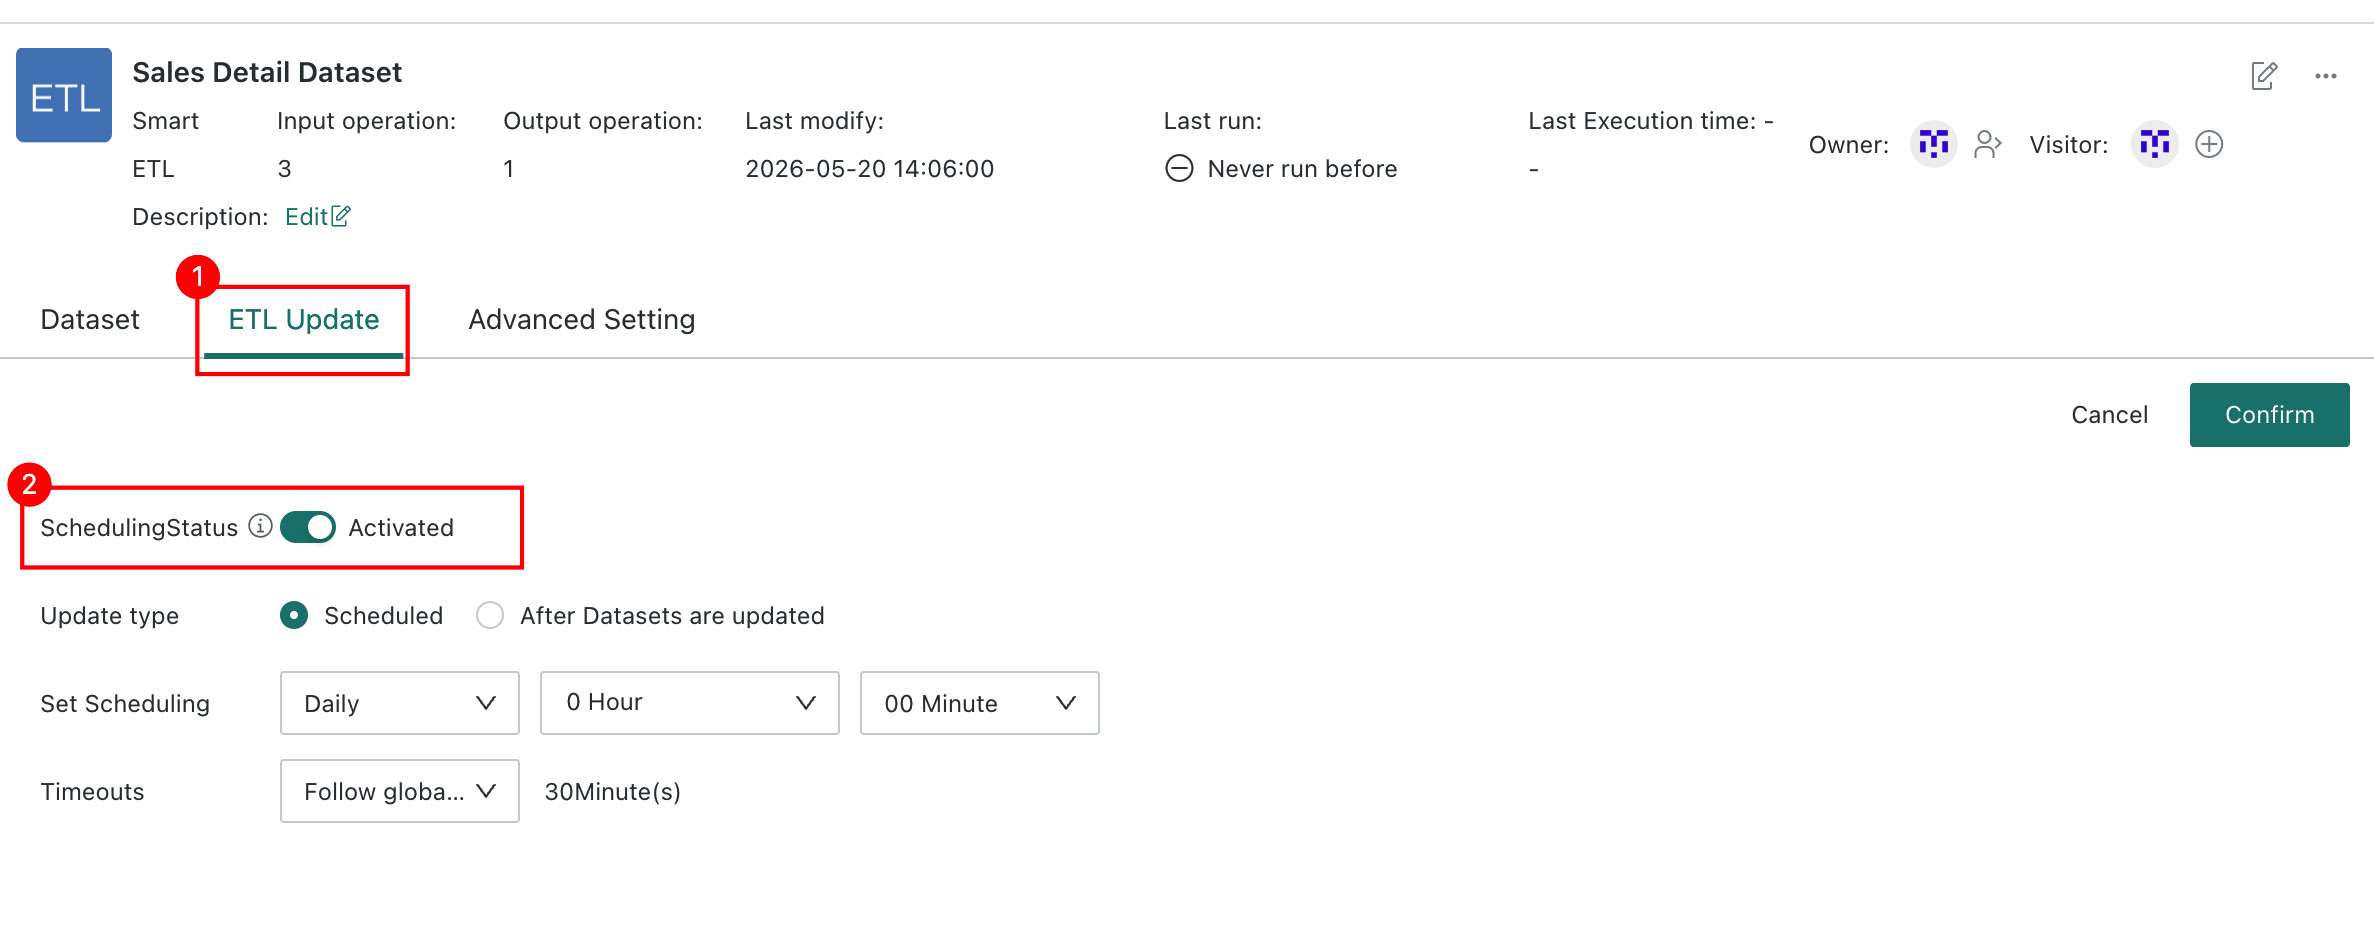
-
Configure
Trigger After Selected Datasets Are Updated. -
Set the trigger condition to
Trigger Only After All Selected Datasets Are Updated. -
Choose a medium task priority and
Follow Global Settingfor timeout.
For more details, see ETL Refresh Policy.