Build a Simple Regional Sales Table
Overview
A single-view report means that data preparation is done from only one dataset, or a single data source, to generate one view and build a report. This article walks you through how to create a regional sales table from scratch using a single view.
The sample dataset used in this tutorial is available here: Build a Simple Regional Sales Table.xlsx
Example
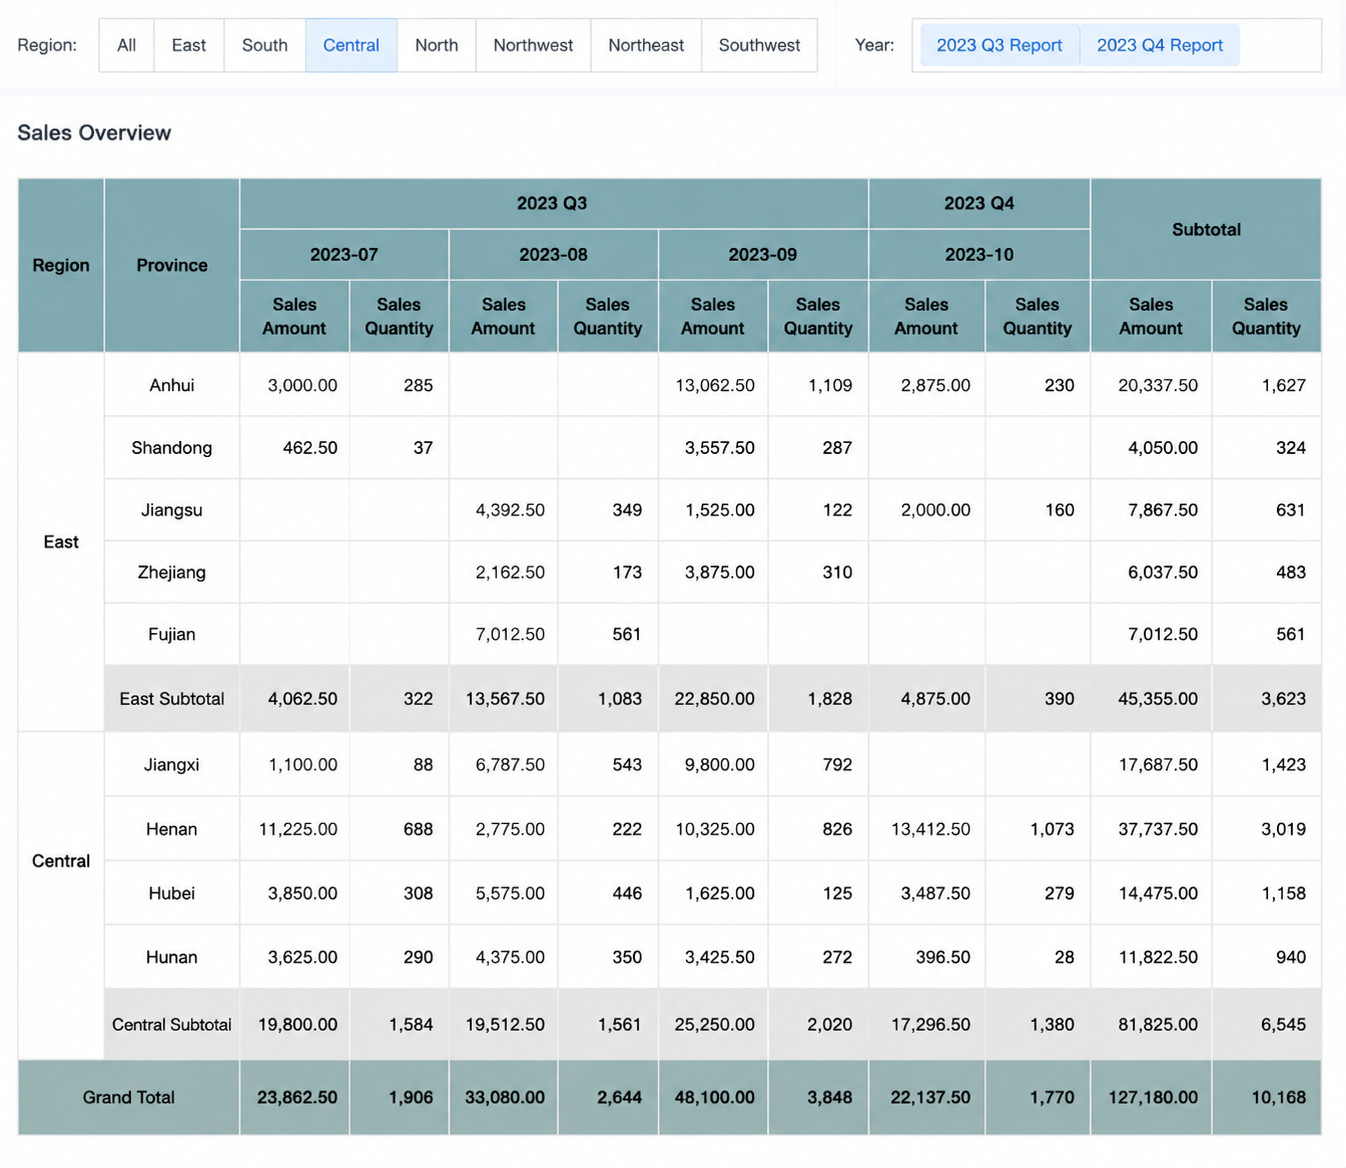
The report requires only lightweight formula-based configuration. Under a multidimensional table structure, row and column data expand automatically by category and display subtotals and grand totals.
As shown below, the two dimensions Region and Province expand vertically by hierarchy, while Quarter and Month expand horizontally. The report also shows subtotals, row totals, and column totals, and the expanded content is controlled through filters.
Implementation Idea
-
Build the table framework in the worksheet using a static header made up of multiple static text cells.
-
Based on the static header, drag dimension fields into the table and expand them horizontally or vertically as needed, turning the header into a dynamic header with expansion properties and preparing it for the later data fill.
After a field from the view is dragged into a cell, it is automatically converted into a template cell and expands vertically by default.
NotesFor details about template header configuration, see the Static Header section in this article.
-
Drag the measure fields to be displayed into cells, then configure parent cells so that measure aggregation and dynamic expansion work correctly.
-
By default, the parent cell of a template cell is the nearest template cell to the left plus the nearest template cell above. Configure the parent cell according to the report's business logic.
- Valid parent cells can only be dynamic expansion cells based on dimension fields.
- Invalid parent cells include static text cells, template cells converted from static text cells, and cells containing formulas starting with
=.
-
Excel formulas must be manually converted into template cells before they can participate in calculations during dynamic expansion.
-
Step-by-Step Example
Data Preparation
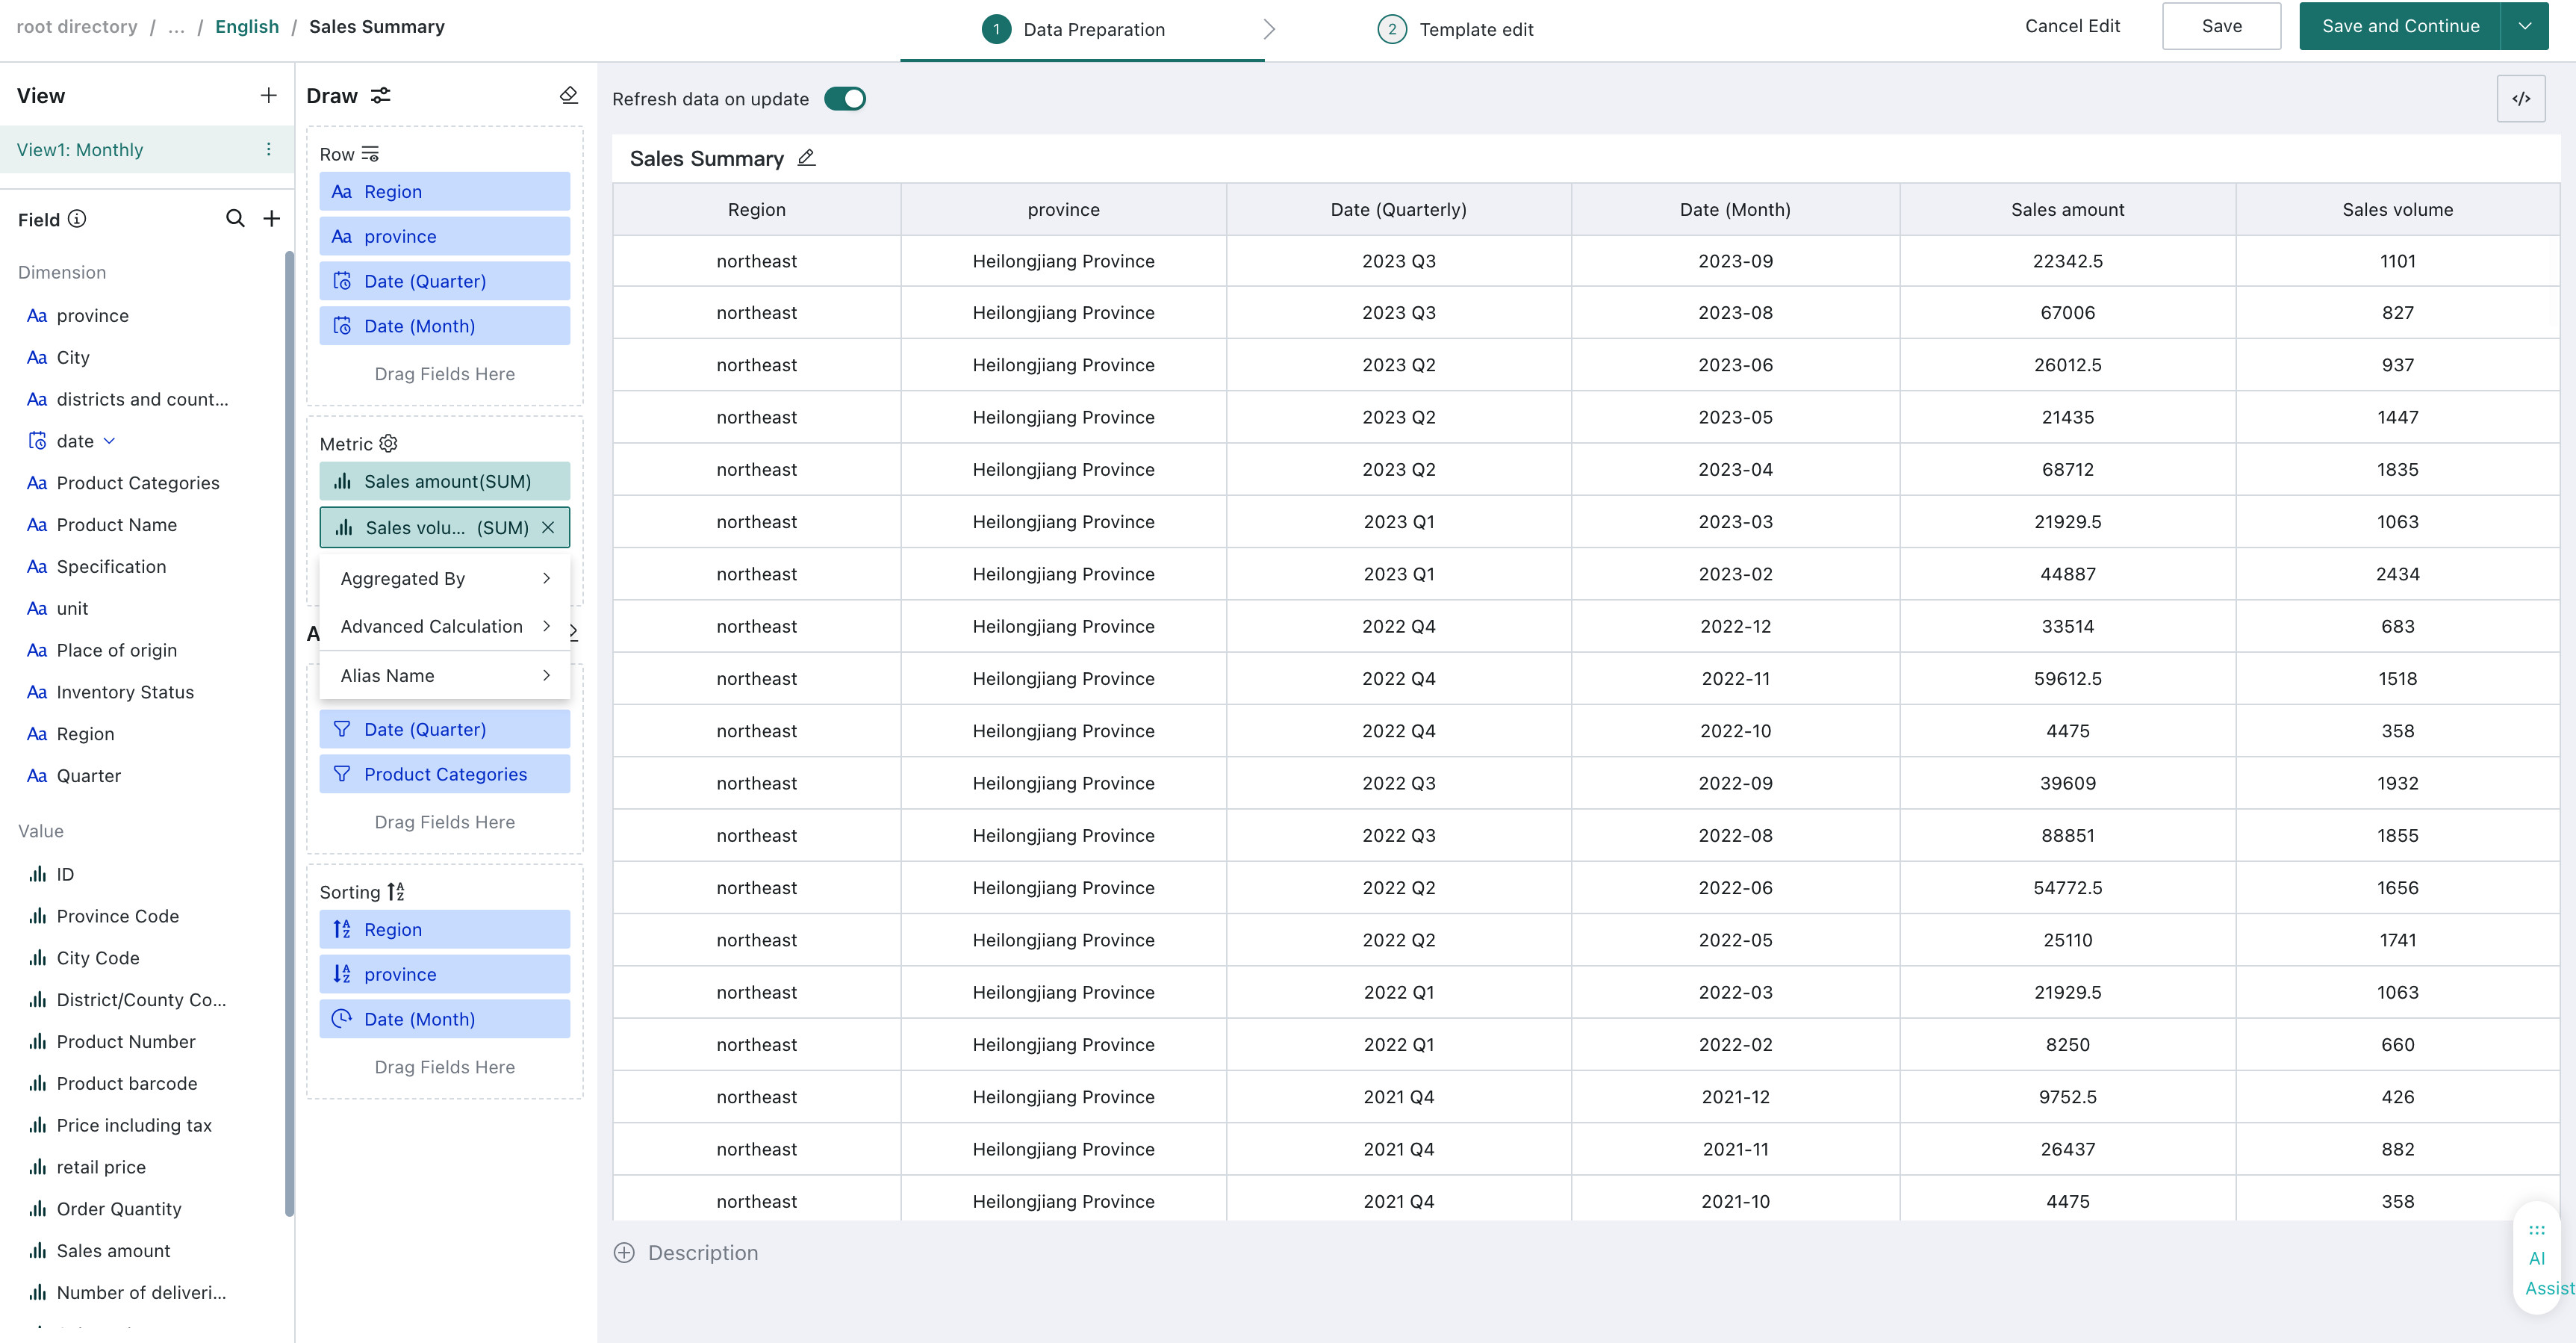
Create a new Chinese-style Reporting Pro card and select the dataset.
- Dimensions:
Region,Province,Quarter,Month - Measures:
Sales Amount,Sales Quantity - Filters: select as needed
- Sort within groups:
Region,Province,Quarter,Monthin sequence, adjusted as needed
If a field name contains punctuation, set an alias for it in the charting area.
Template Editing
Static Header
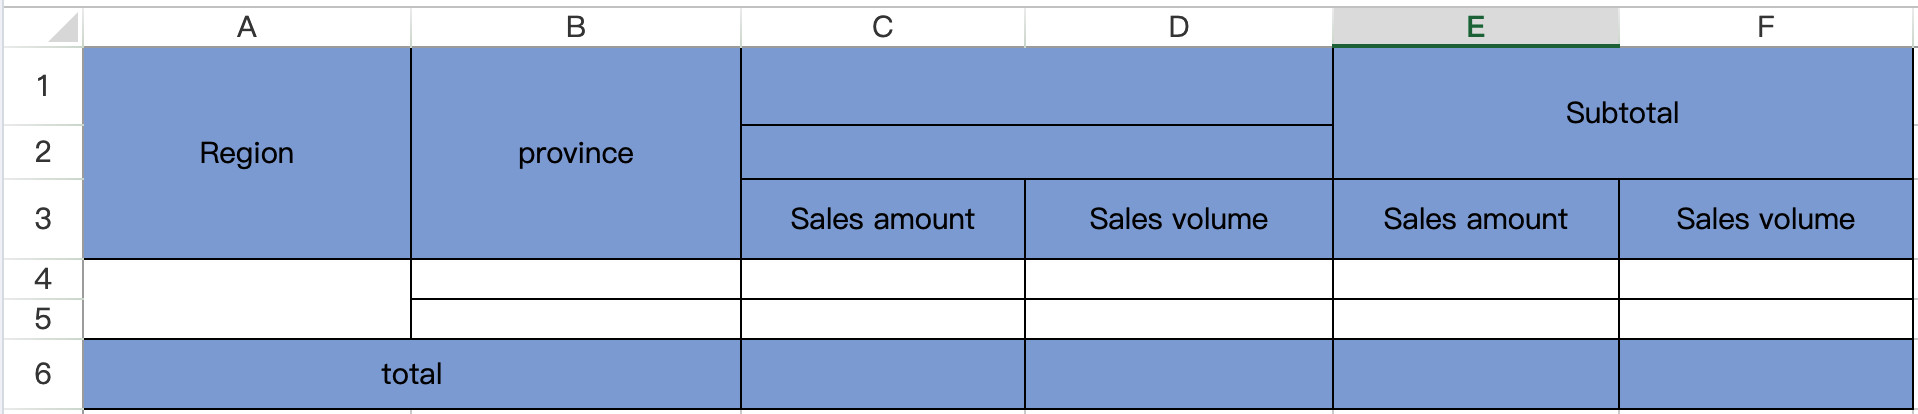
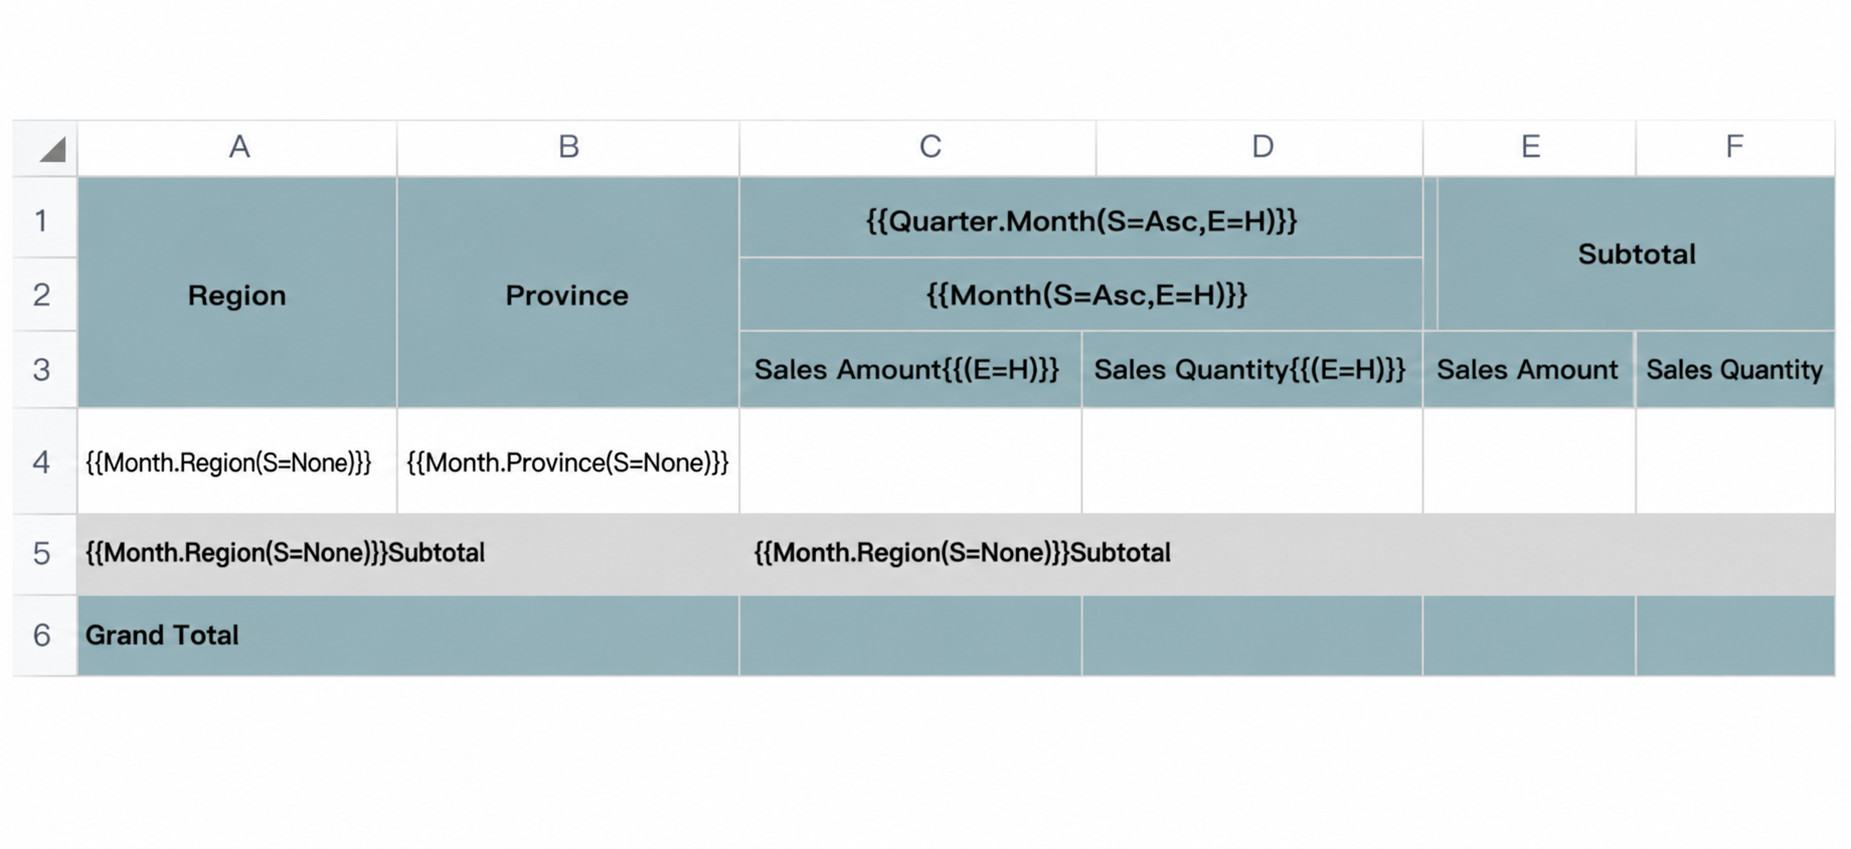
First build the rough table structure. Enter text in the appropriate positions to create the static header, and merge cells horizontally or vertically as needed.
Dynamic Header
-
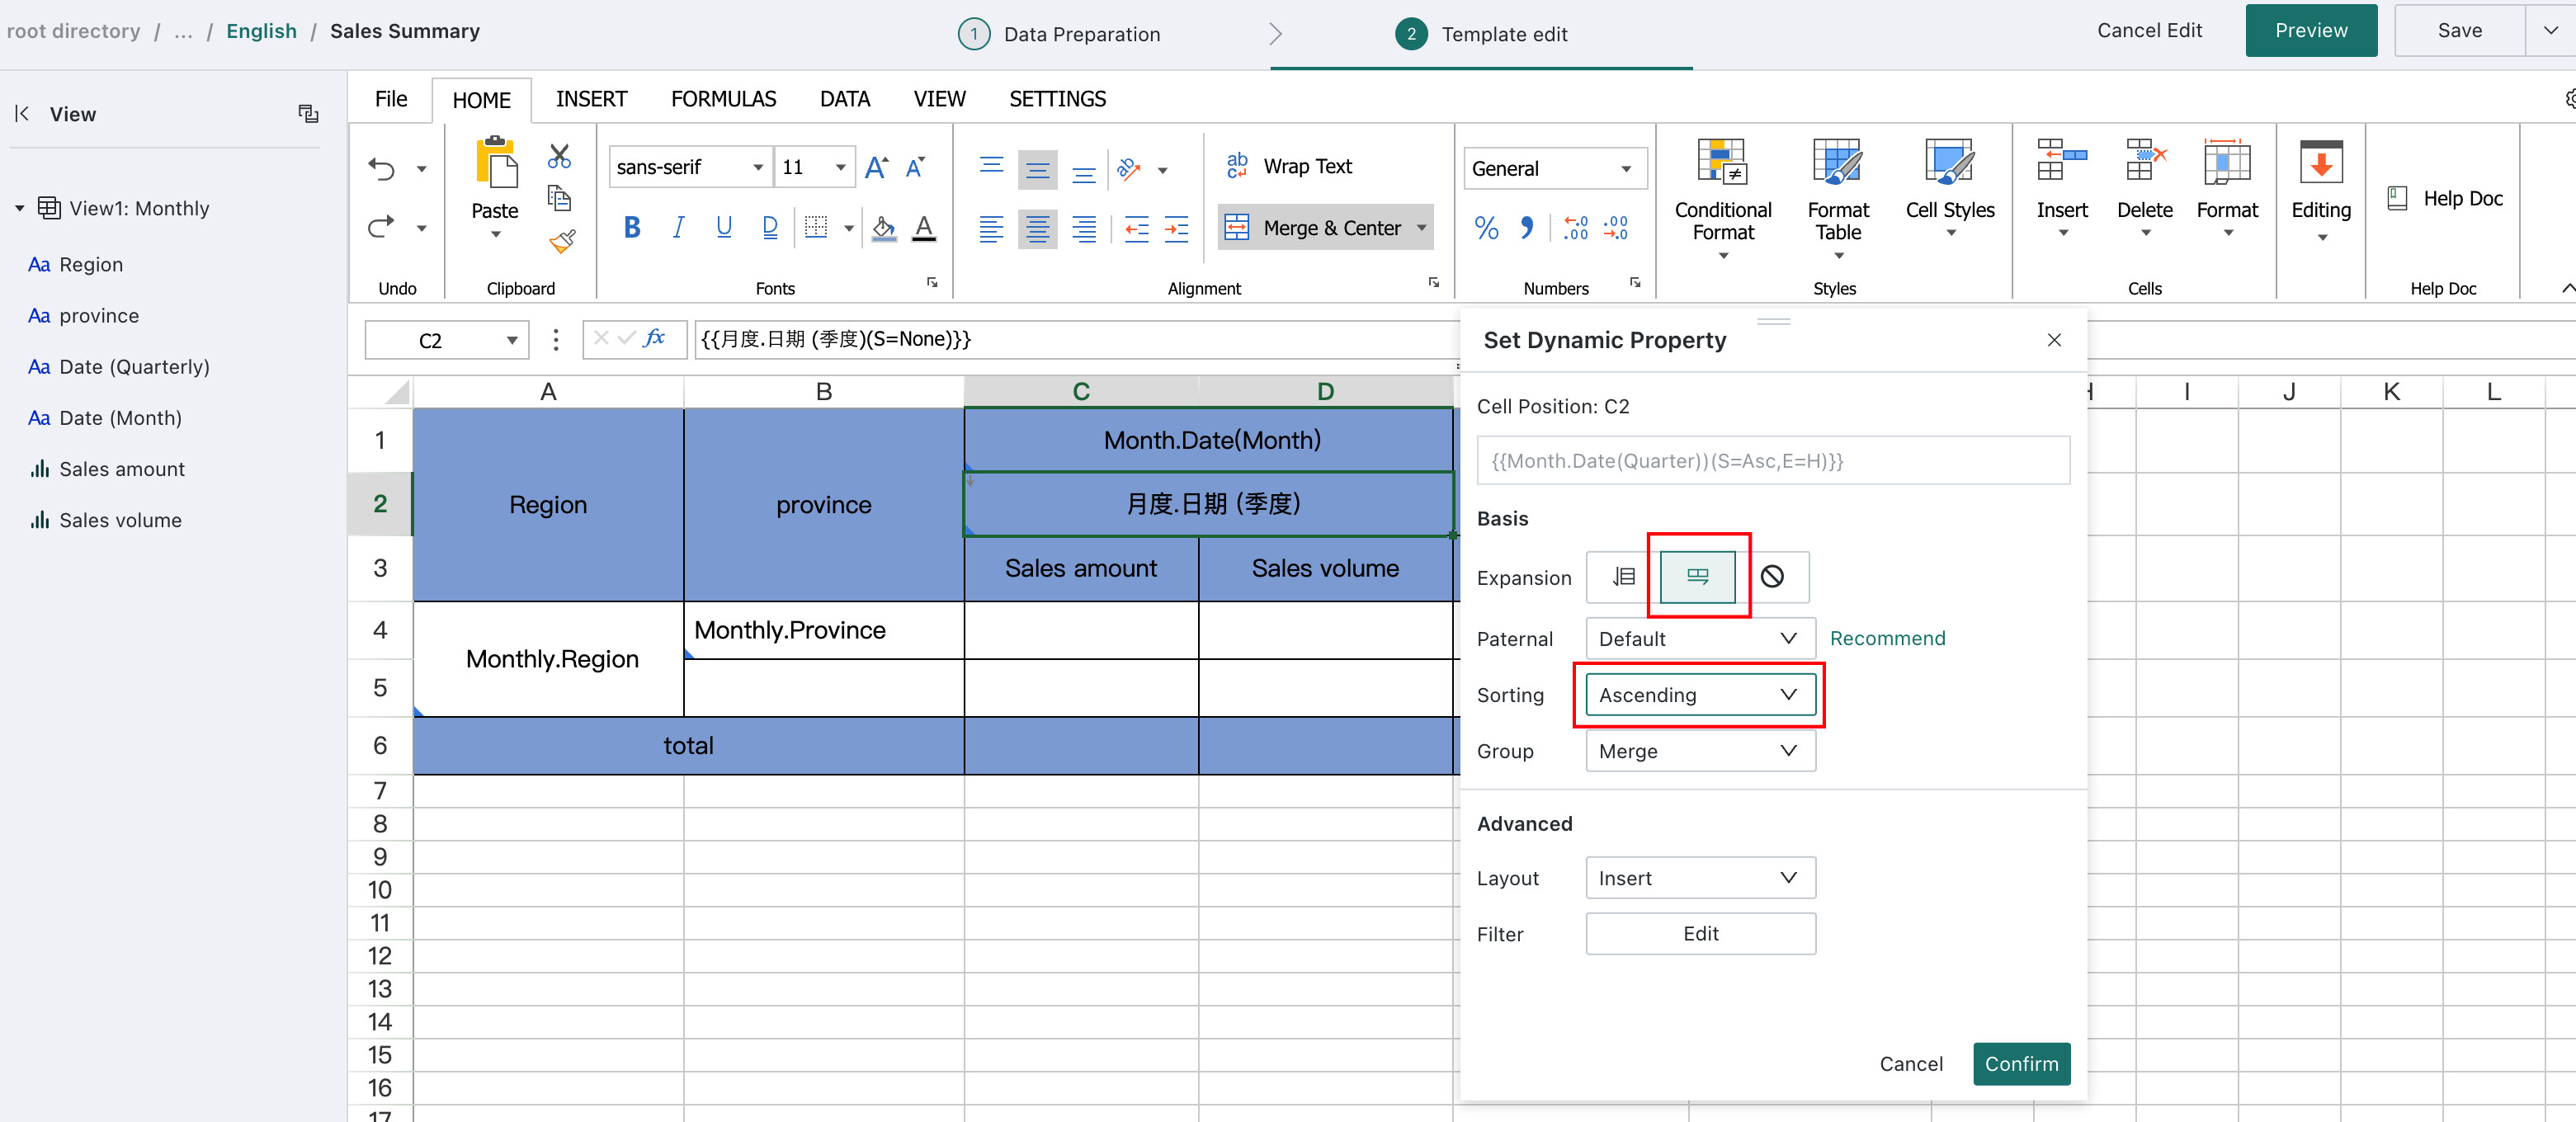
Drag the dimension fields that need to expand into cells in the worksheet template. Double-click them to configure dynamic attributes, then set the expansion direction and sorting as needed.
NotesAfter a field from the view is dragged into a cell, it is automatically converted into a template cell and set to vertical expansion by default.
RegionandProvince: expand vertically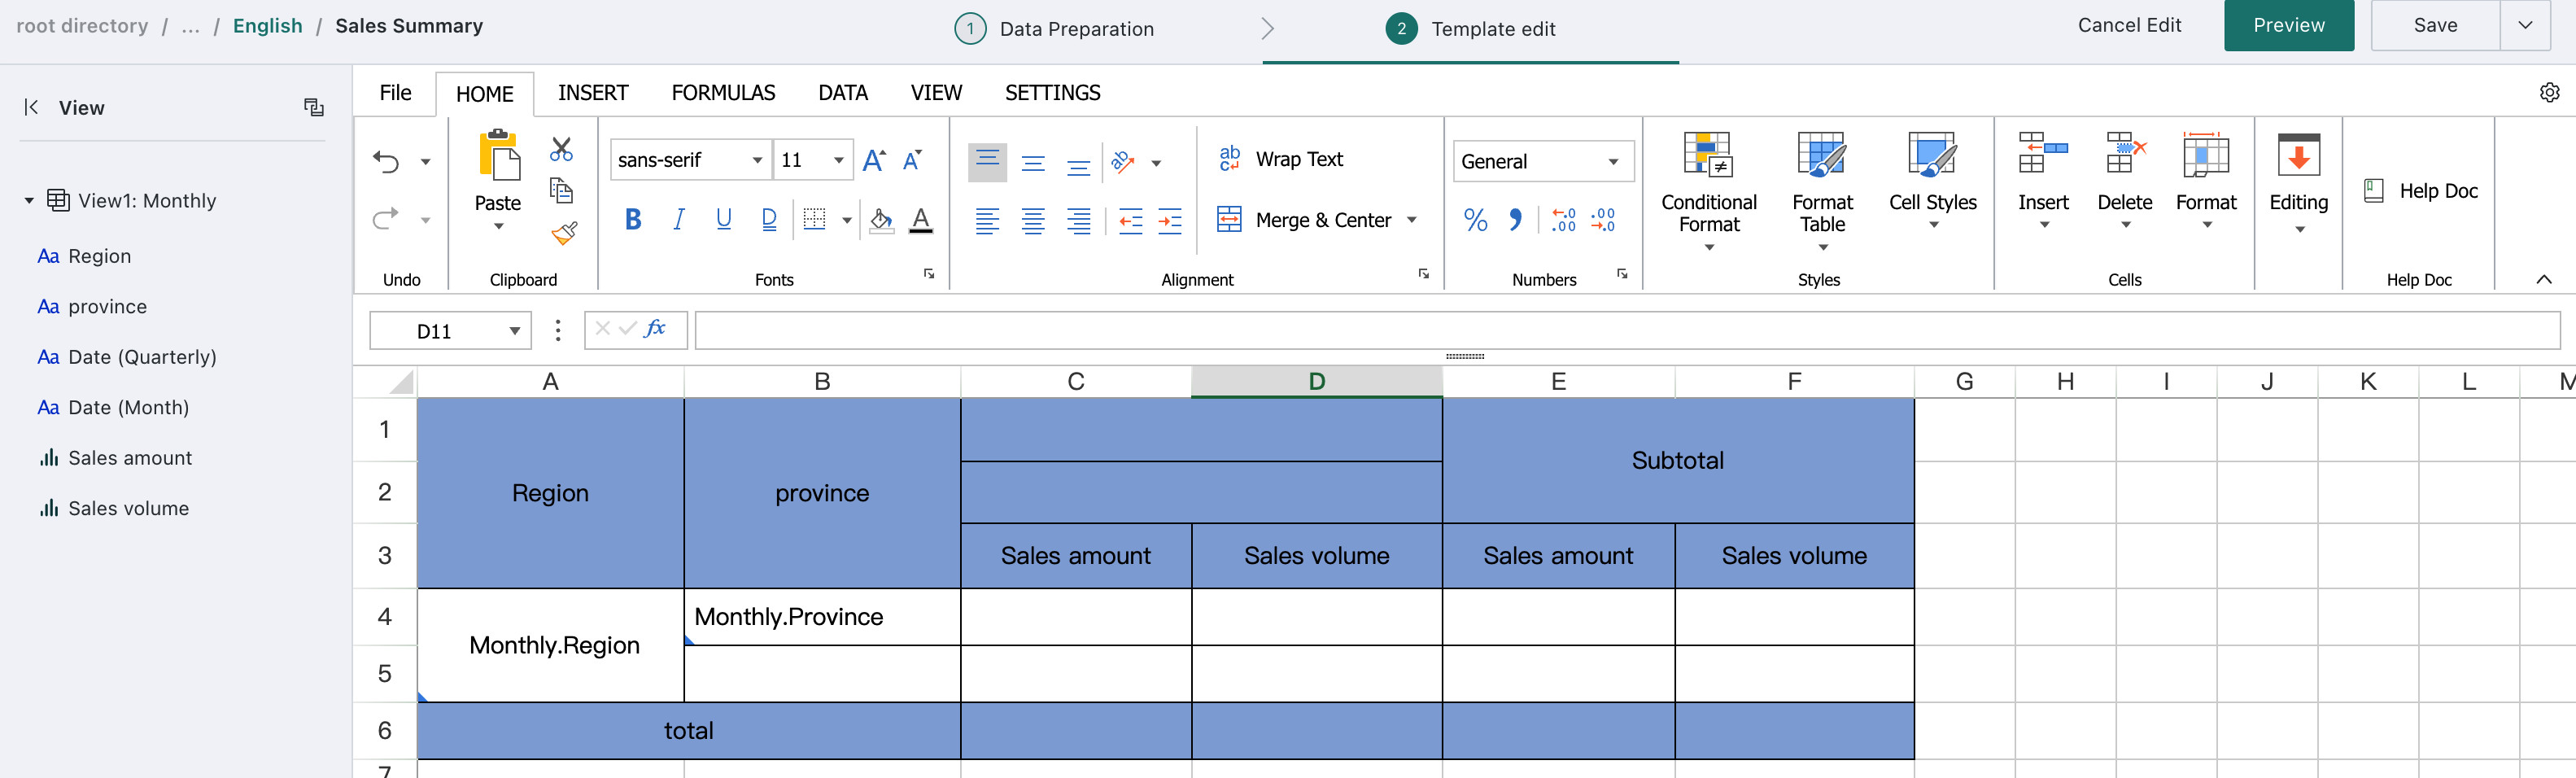
QuarterandMonth: expand horizontally and sort in ascending order
-
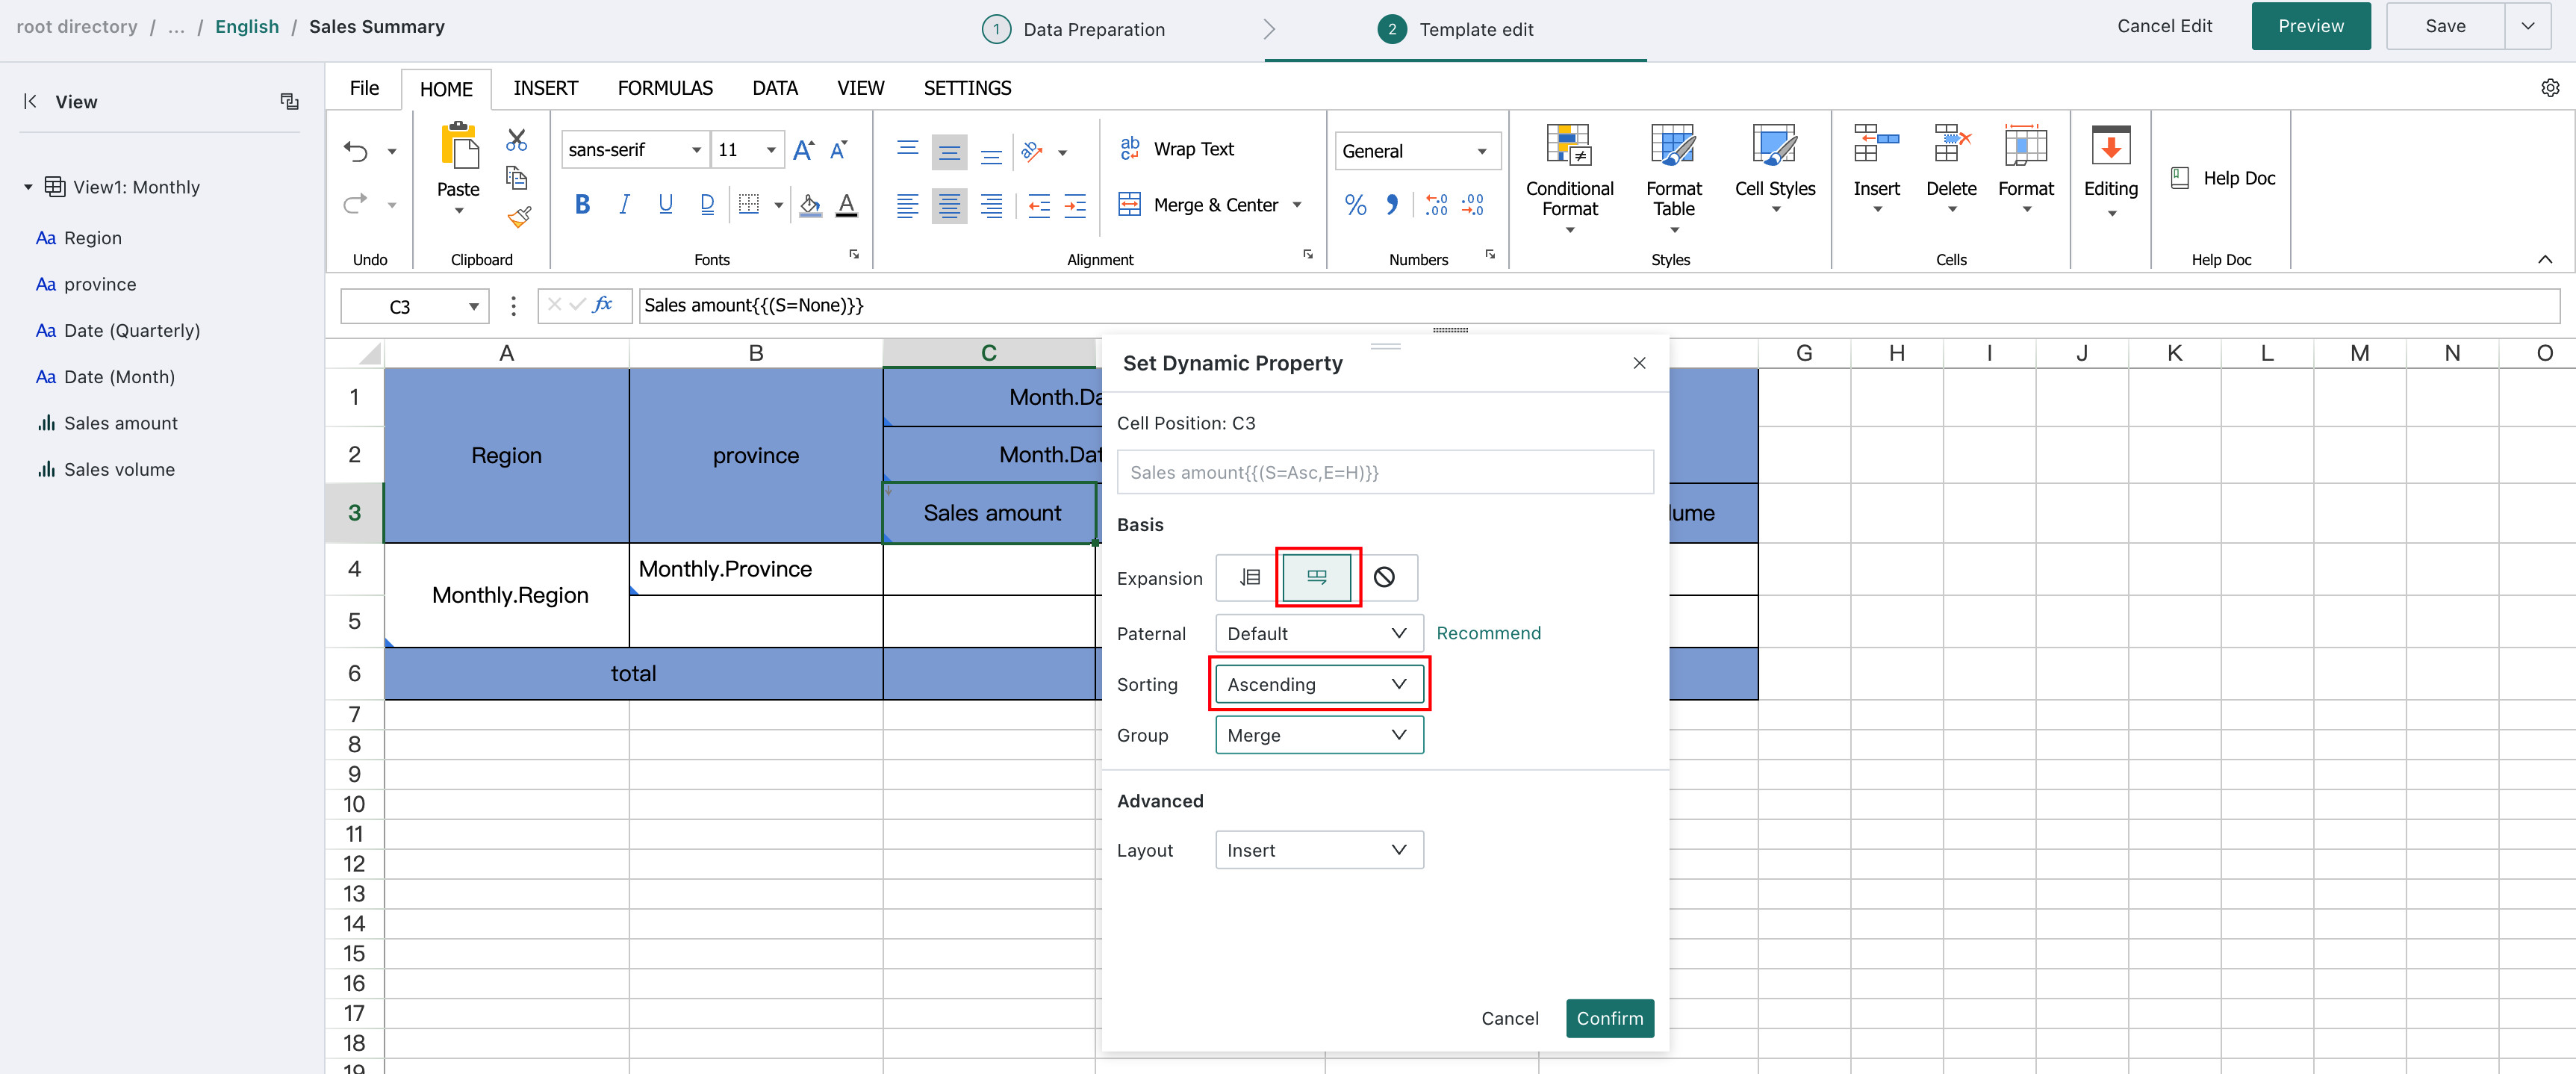
To make the static text cells Sales Amount and Sales Quantity expand along with each quarter and month, manually convert these fixed cells into template cells and set their expansion directions as needed.
Sales Amount/Sales Quantity: expand horizontally
NotesThe default parent cell of a template cell is the nearest cell to the left plus the nearest cell above. For example, the default parent cell of cell
C3, where Sales Amount is placed, isC2.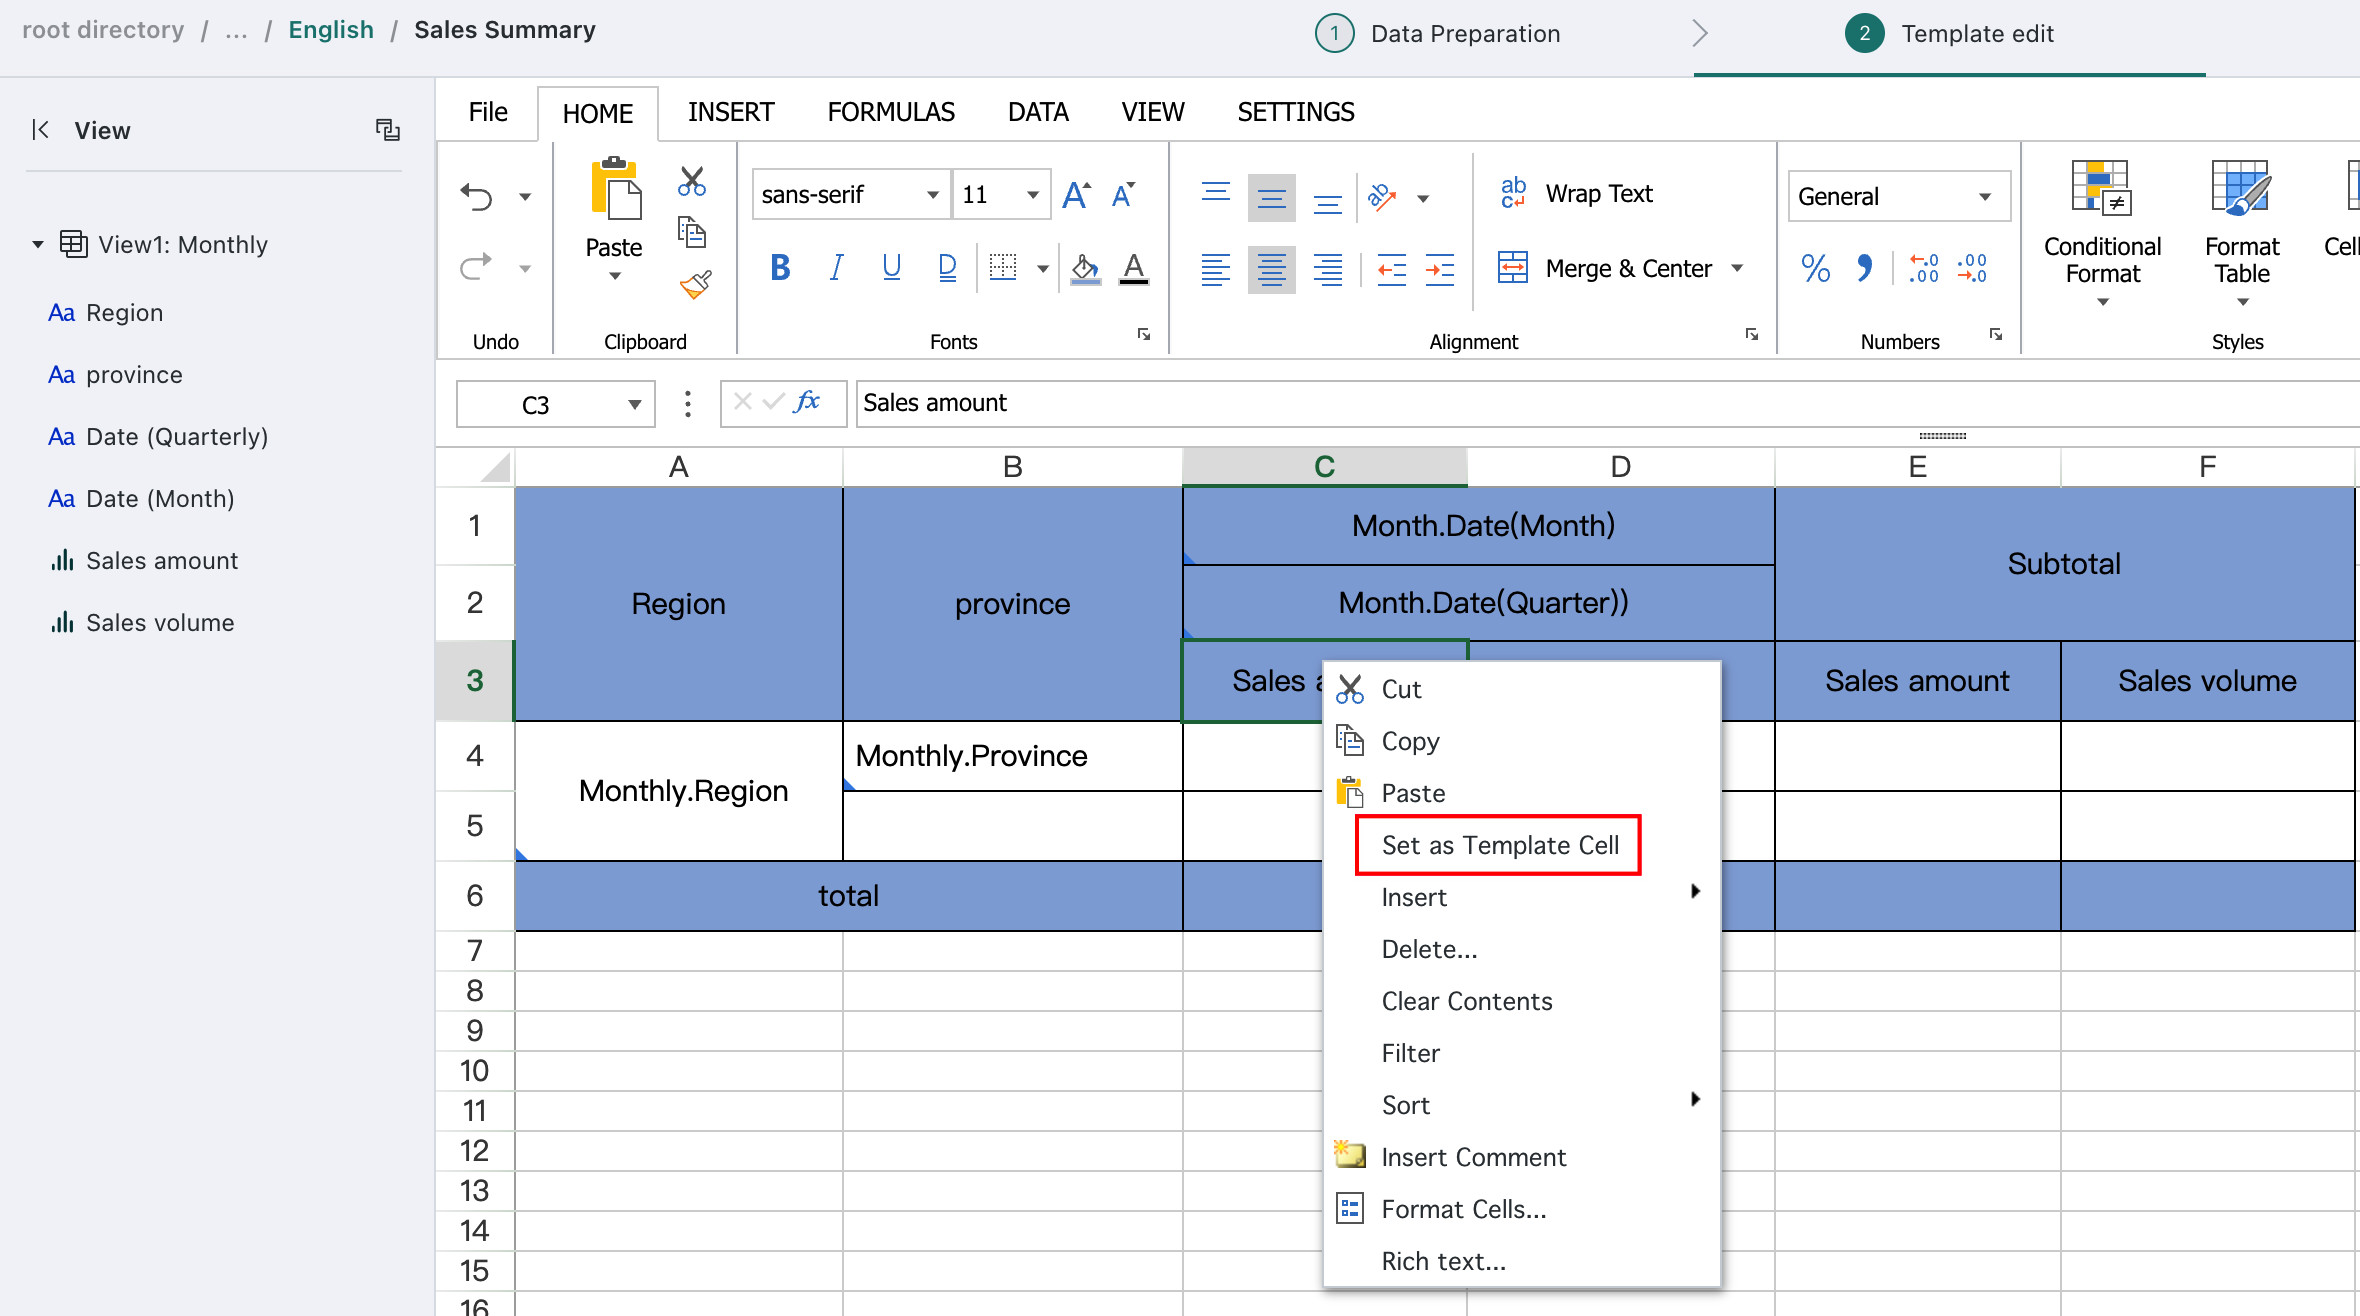
-
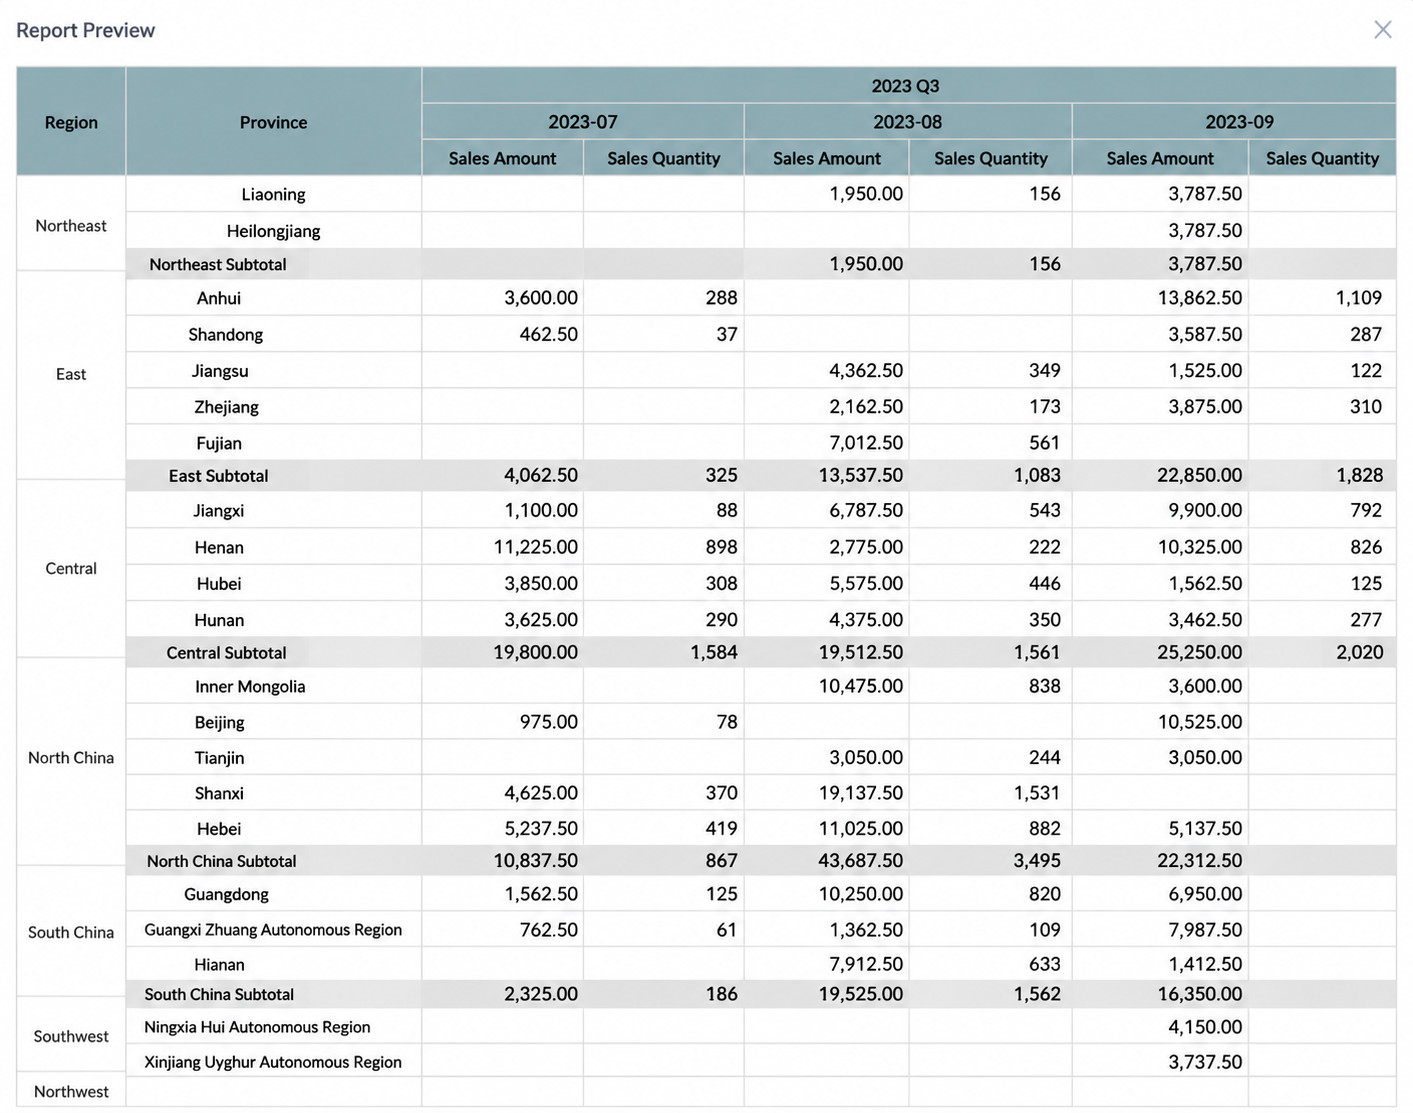
Click Preview for the report and confirm that the header expansion meets expectations.
NotesStyles are not expanded for empty cells. For example, in subtotal and total rows, the background color of empty cells is not carried over through expansion.
-
Final header setup and preview result:
(1) Header settings:
(2) Preview result:
Measure Fields
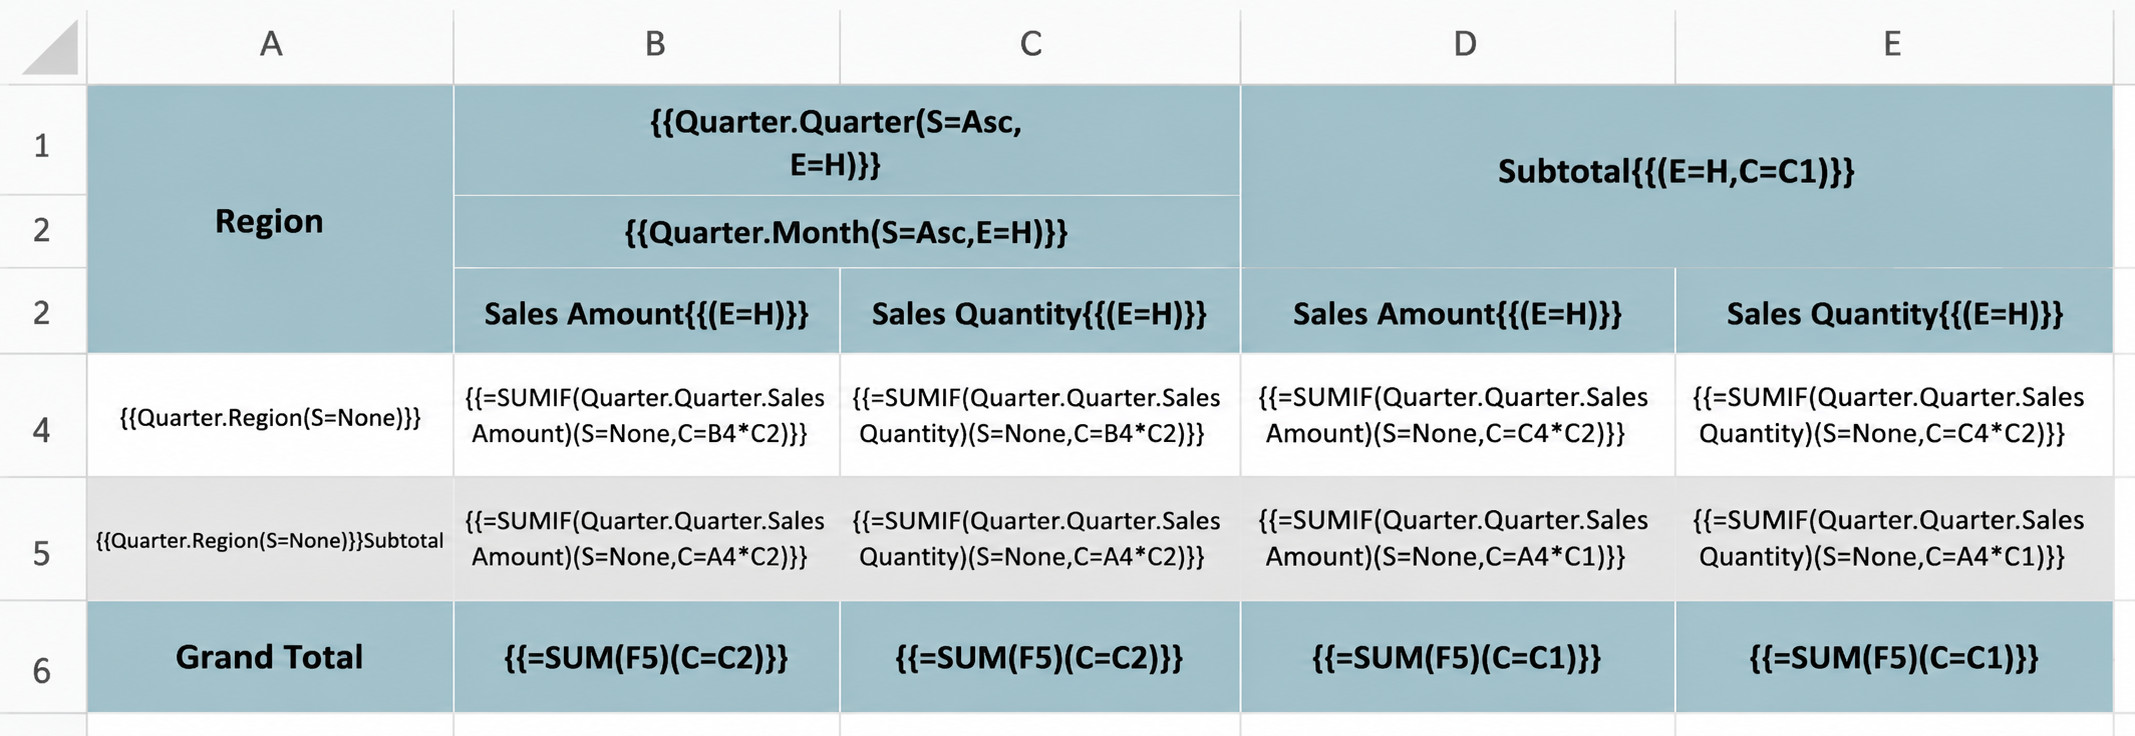
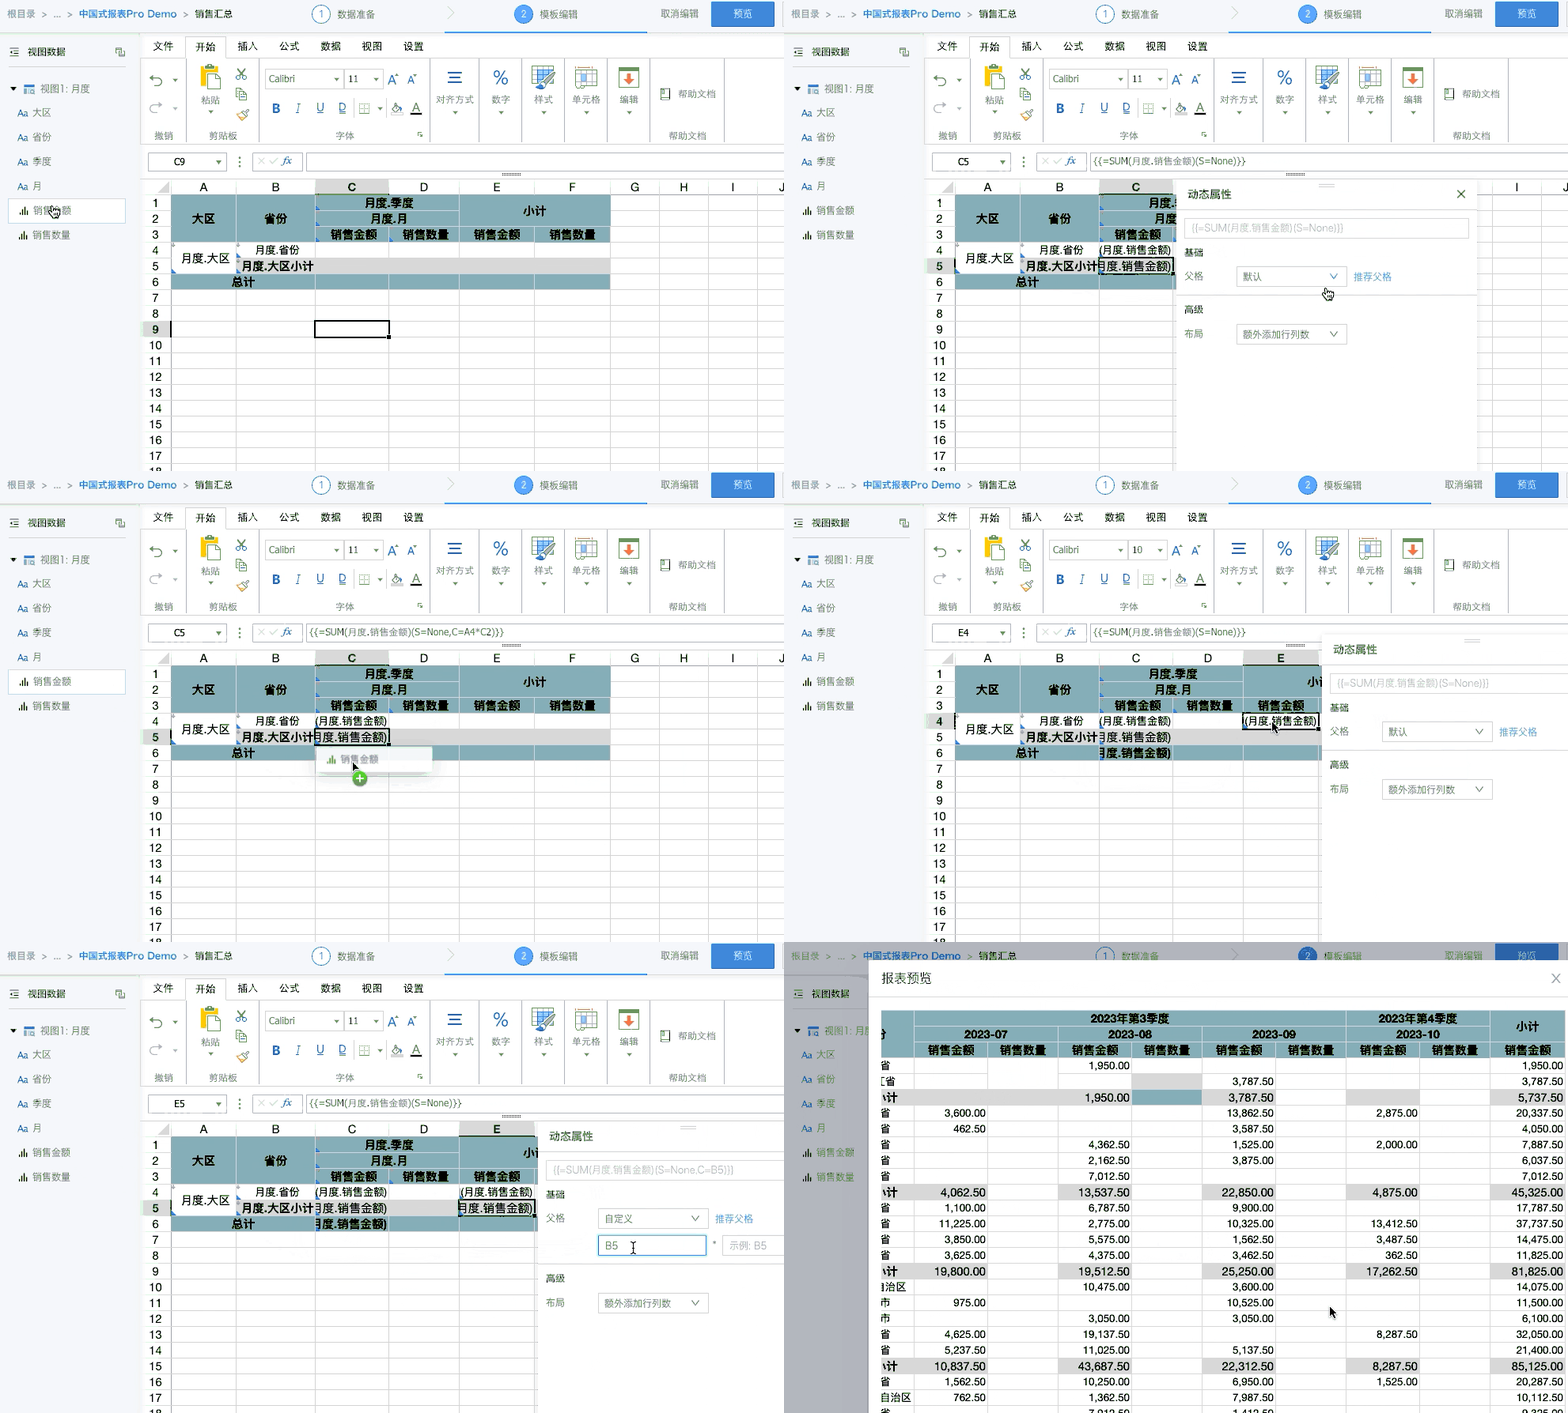
Drag the measure fields to be displayed into the worksheet template and configure a valid parent cell for each field according to the actual business calculation logic. The following illustration and explanation show how parent cell configuration works.
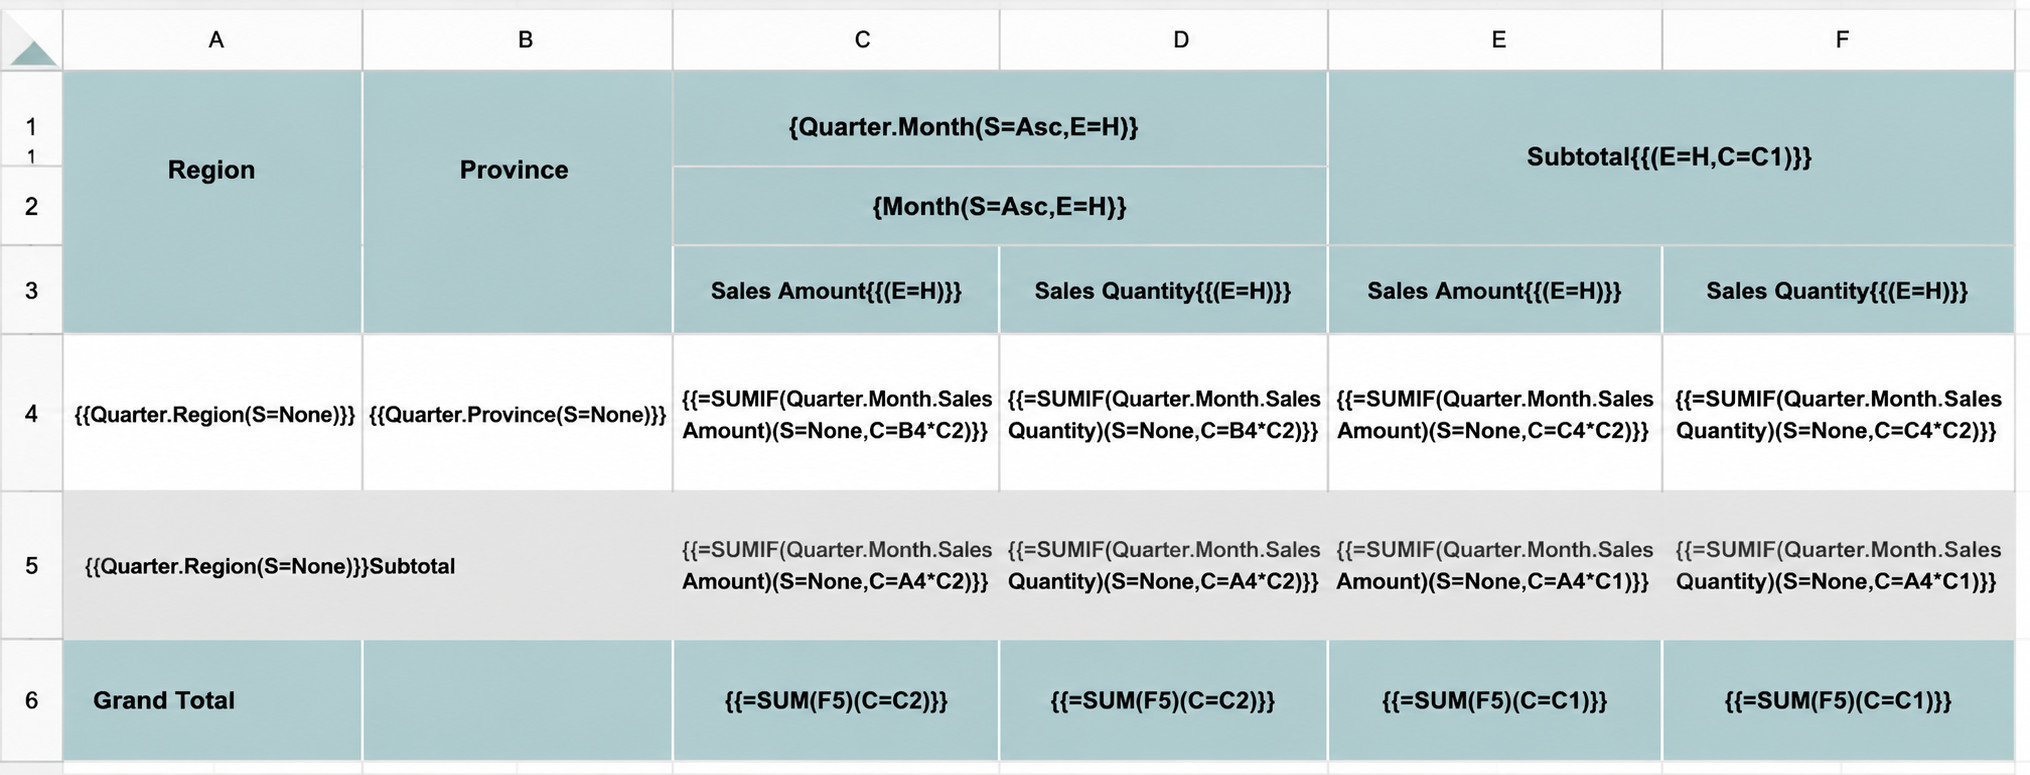
Business requirement: Sales Amount and Sales Quantity need to expand by region (Province, Region) and time (Quarter, Month) while also calculating subtotals, row totals, and column totals. Using the measure Sales Amount as an example:
Column C:
- Detail values: Monthly sales amount for each province (
C5) is calculated by the dimensions[Province]and[Month], so the parent cell isB4*C2. - Subtotals: Monthly sales amount for each region (
C5) is calculated by the dimensions[Region]and[Month], so the parent cell can beB5*C2orA4*C2.
When the cell to the left of C5, namely B5, is a static text cell, the parent cell must be set to A4*C2. Otherwise, the calculation result is incorrect.
Column E:
-
Row totals: Total monthly sales amount for each province (
E4) must be aggregated by the dimension[Province]and dynamically expand with[Province], so the parent cell isB4. -
Subtotal / Row total: Total monthly sales amount for each region (
E5) must be aggregated by the dimension[Region]and dynamically expand with region subtotals, so the parent cell can beB5orA4. -
Row / Column grand total: Overall monthly sales amount (
E6) does not need to expand with any dimension field, so no parent cell is required. -
Configure the parent cells for Sales Quantity in the same way, as shown below.
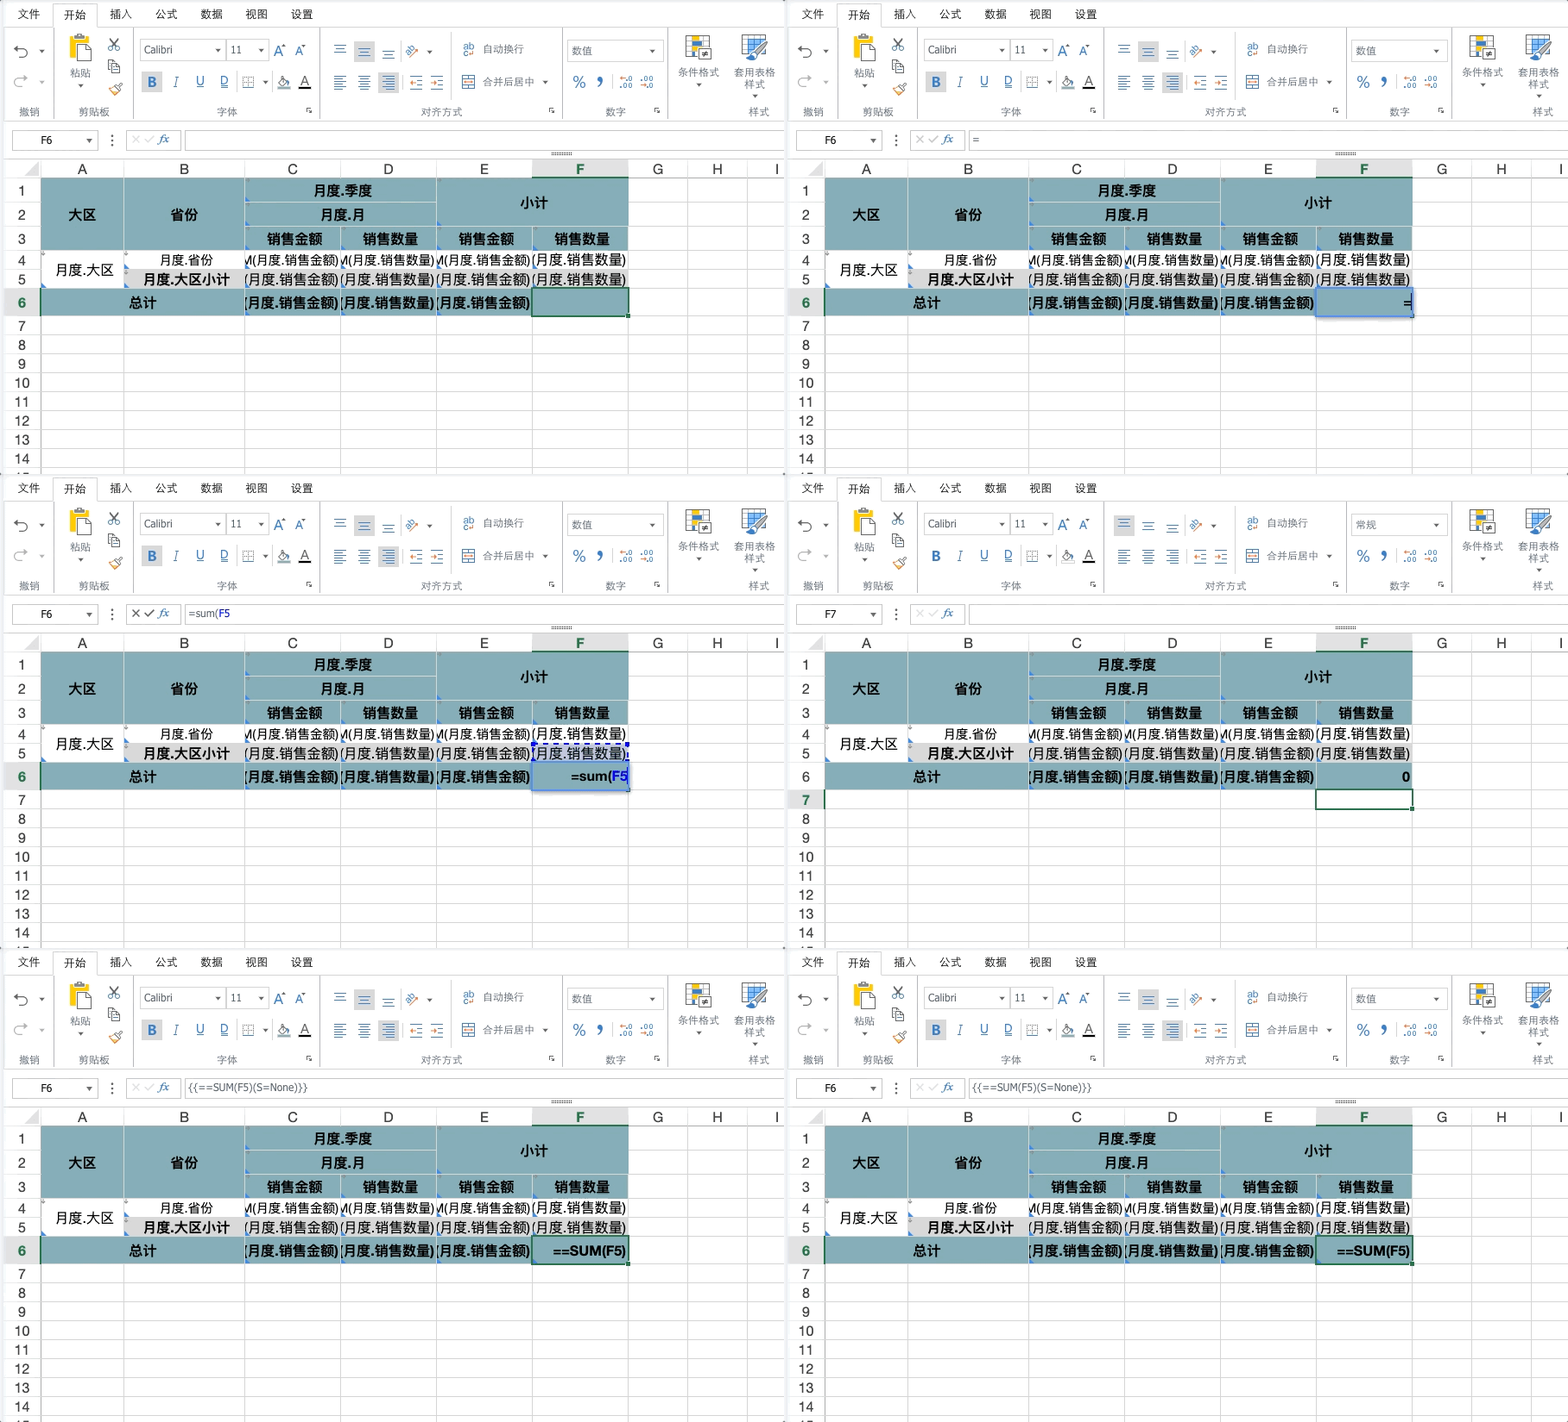
Subtotals and totals can also be calculated by native Excel functions. For example, to calculate Sales Quantity Total with the SUM function:
- Enter the formula expression
=SUM(F5)in cellF6.F5can also be replaced withF4orD6. - Right-click and convert it to a template cell so that
F6is displayed as{{==SUM(F5)}}. Then the required data is calculated and displayed correctly.
Additional reminders:
- Parent cells filter and calculate data, while also controlling the direction and number of expansions. If no expansion or filtering condition is needed, the parent cell can be left unset.
- When multiple dimensions are adjacent, parent cells are inherited layer by layer from left to right and from top to bottom. In the example above, when
C4usesB4andC2as parent cells, it is actually constrained byA4,B4,C1, andC2. - When a measure field is dragged into the template, the default aggregation method is
sum. In most cases you do not need to change it, but it can be manually adjusted to a basic aggregation such asmaxoraveragewhen needed.
Configure Filter Association
Adjust the styles, preview the data, and verify the result. After confirming everything is correct, save the card. Then go back to the page and create a filter associated with the card.
Extended Examples
Calculate Quarterly Sales Subtotals
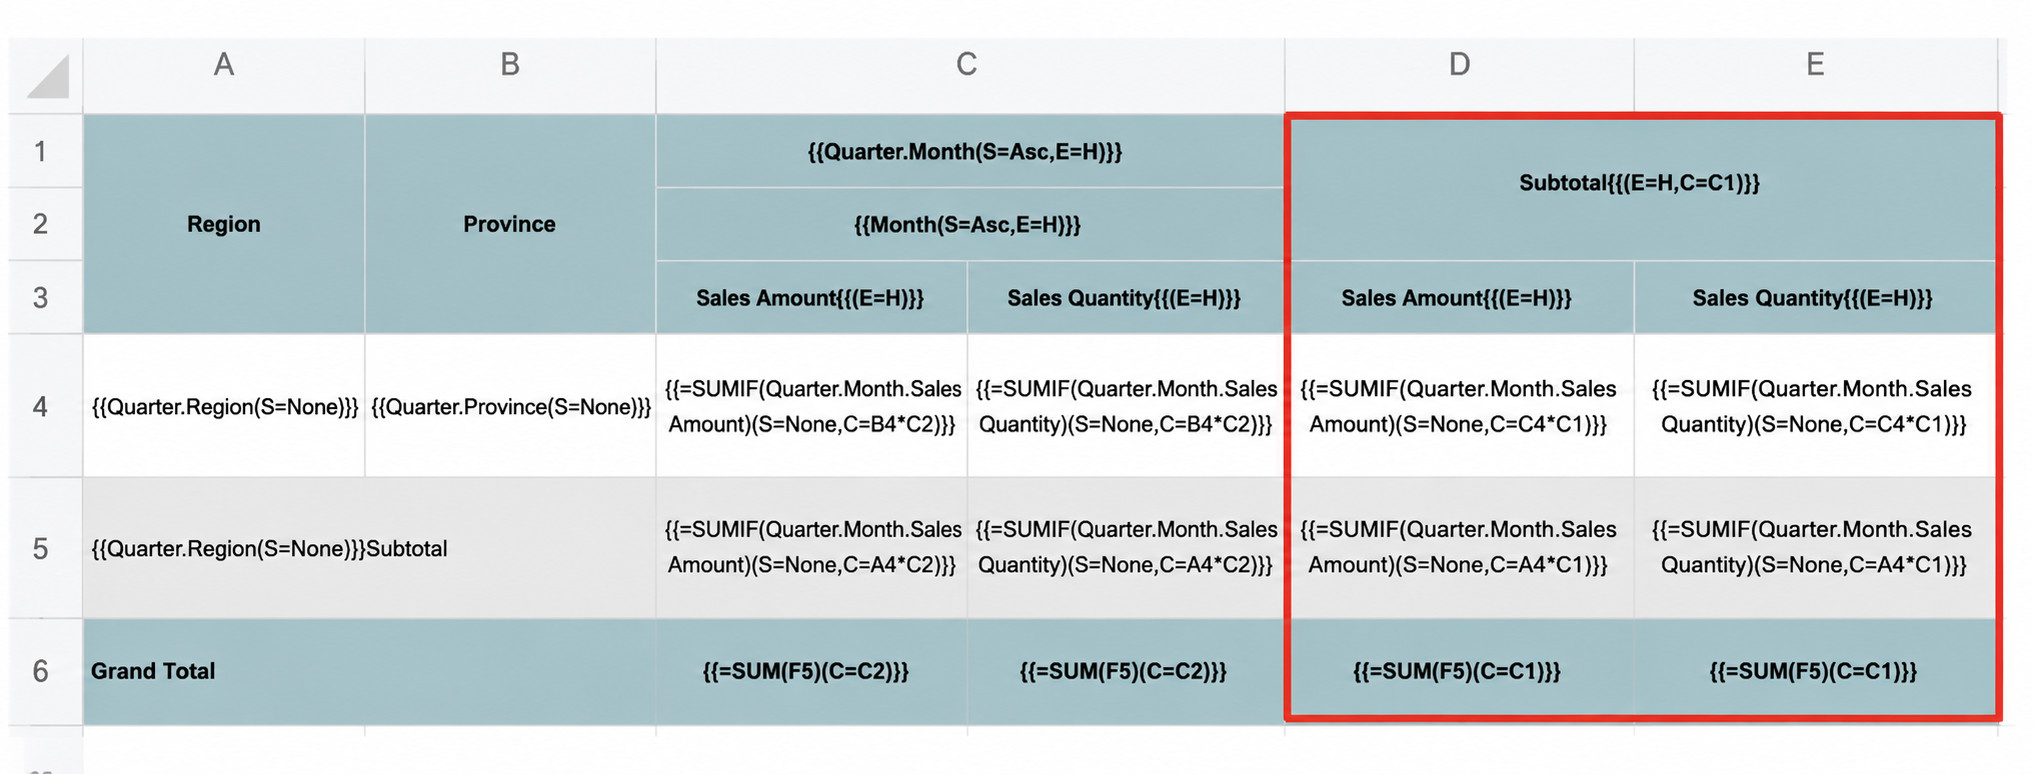
Implementation: The subtotal column expands horizontally with quarters. Add quarter cell C1 as the parent cell of the subtotal column.
Merge Region and Province into One Column
Implementation: Place the fields in the same column and configure the parent cell of Province.