Quickly Rank Numeric Top N% by Proportion
Requirement Background
You may want to view the Top N% of a numeric value after aggregation under a specified dimension. For example, obtain a list of stores whose monthly total sales rank in the top 15% overall. This article introduces the implementation based on this scenario.
Key Function
cume_dist()over(partition by [Grouping Dimension] order by [Sorting Dimension])
-
cume_distcalculation logic: number of rows less than or equal to the current sorting dimension value divided by the total number of rows in the corresponding group. -
Ascending order is used by default. Use
order by [Sorting Dimension] descto sort in descending order. -
Advantages:
a. You can intuitively see the exact ranking percentage of each row within the group.
b. If the target percentage changes, you only need to modify the filter condition, not the data.
-
Note: Because the calculation is affected by the number of data rows, aggregate the data to a suitable granularity in ETL before using this window function.
Procedure
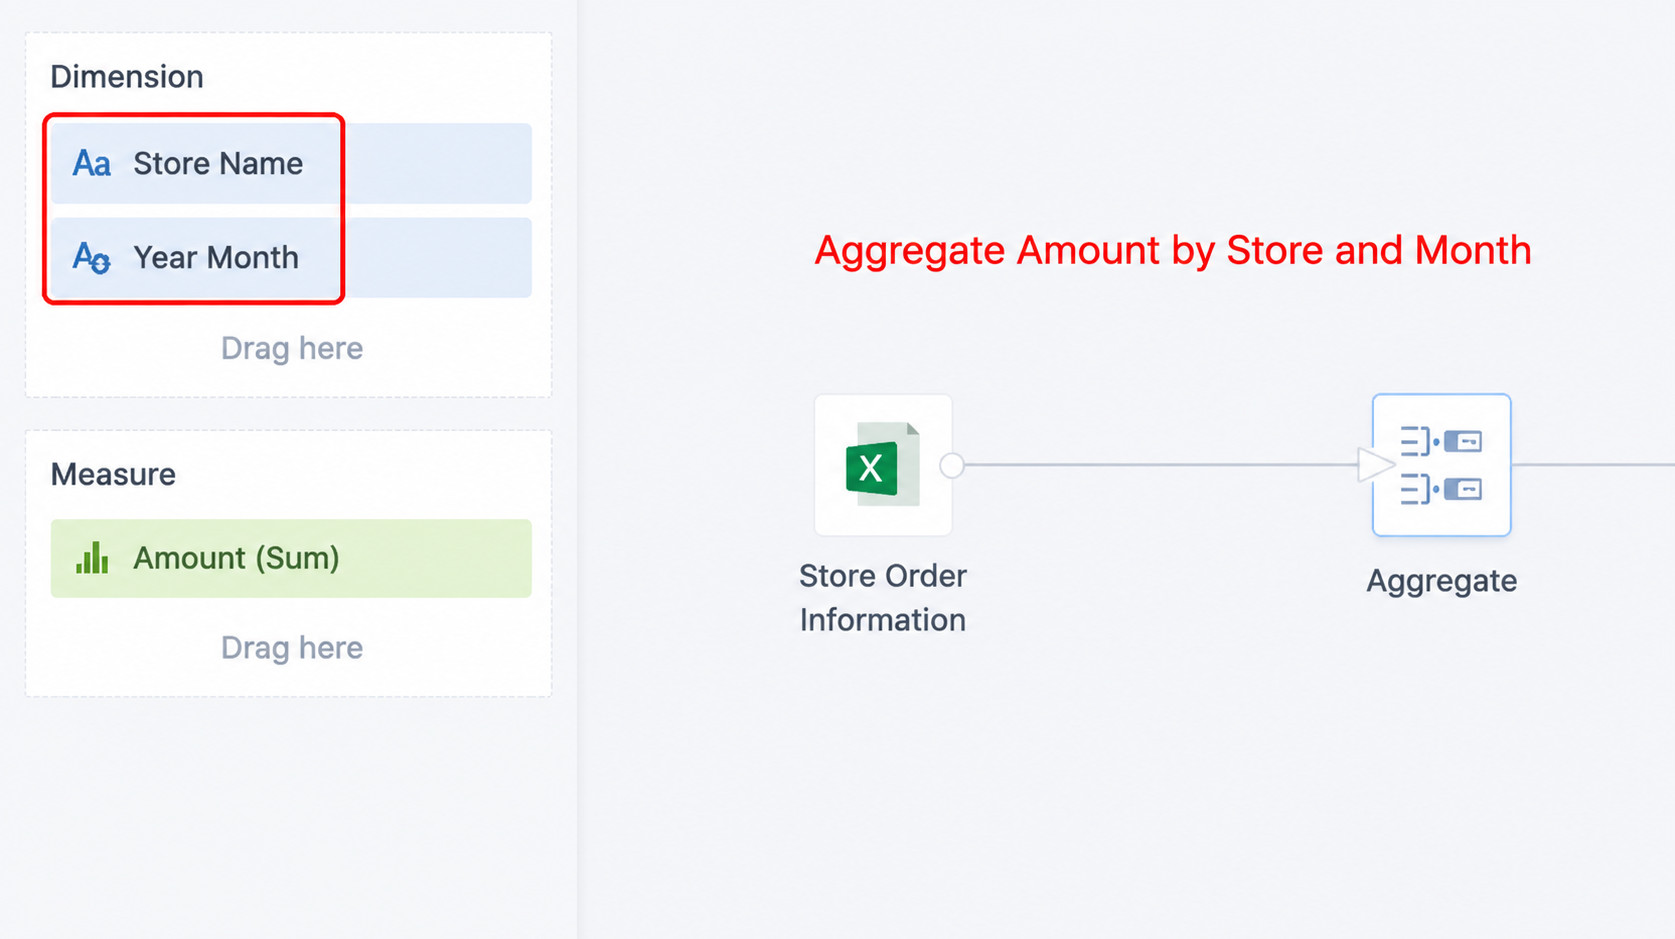
- Use Group Aggregation in ETL to aggregate data to the required granularity. In this case, group by Store Name and Month, and sum the sales amount to ensure each store has only one row of data for each month.
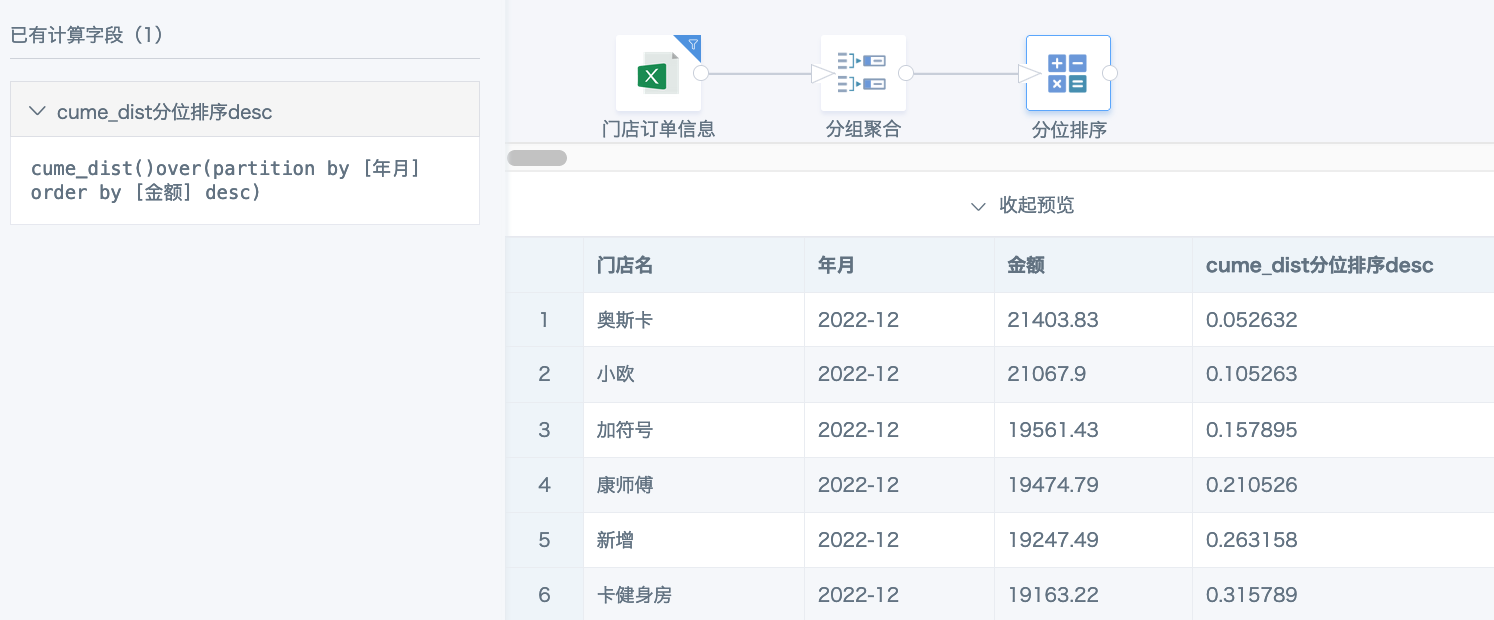
- Create a calculated field. The grouping field corresponds to the dimensions used in group aggregation. Sort the monthly summarized amount for each store in descending order and calculate the percentile.
cume_dist()over(partition by [Year-Month] order by [Amount] desc)
- Create a card. When using the Percentile Ranking field in the value field well, set the aggregation method to No Processing. Then filter values less than or equal to 0.15 as needed.
When 15% of a group is not an integer, such as 19 stores in December 2022, 19 x 15% = 2.85. If you round down, meaning you want to keep 2 of the 19 stores, set the filter condition to less than or equal to 0.15. If you need to round up, meaning keep 3 of the 19 stores, change the Top 15% filter condition to less than 0.16 or 0.159999. The same logic applies to the bottom 15%.
Other Implementation Functions
Percentile Function: percentile
percentile([Amount],0.85)over(partition by [Year-Month])
-- Returns the true percentile in this group.
Equi-Frequency Percentile Point: percentile_approx
percentile_approx([Amount],0.85)over(partition by [Year-Month])
-- Returns the field value closest to the true percentile in this group.
ntile Function
ntile(n) over(partition by [Grouping Field] order by [Sorting Field])
--
a. `n` divides the current ordered dataset evenly into n buckets and assigns each row an appropriate bucket number according to the sorting order. This is also called the slice value, slice number, or partition number. It can divide data into equal small slices and assign each row the numeric sequence number of that slice.
b. `n` can be determined based on the Top N% requirement. For example, to view the top 25%, set the number of slices to 4. To view the top 10%, set the number of slices to 10.
c. If the slices are uneven, distribution is added to the first slice by default. When the data cannot be divided evenly, extra rows are added to buckets in order starting from the first bucket. For example, with 10 rows: 1. If divided into 3 groups, the first group has 4 rows and the other two groups have 3 rows each. 2. If divided into 4 groups, the first and second groups have 3 rows each and the other groups have 2 rows each.
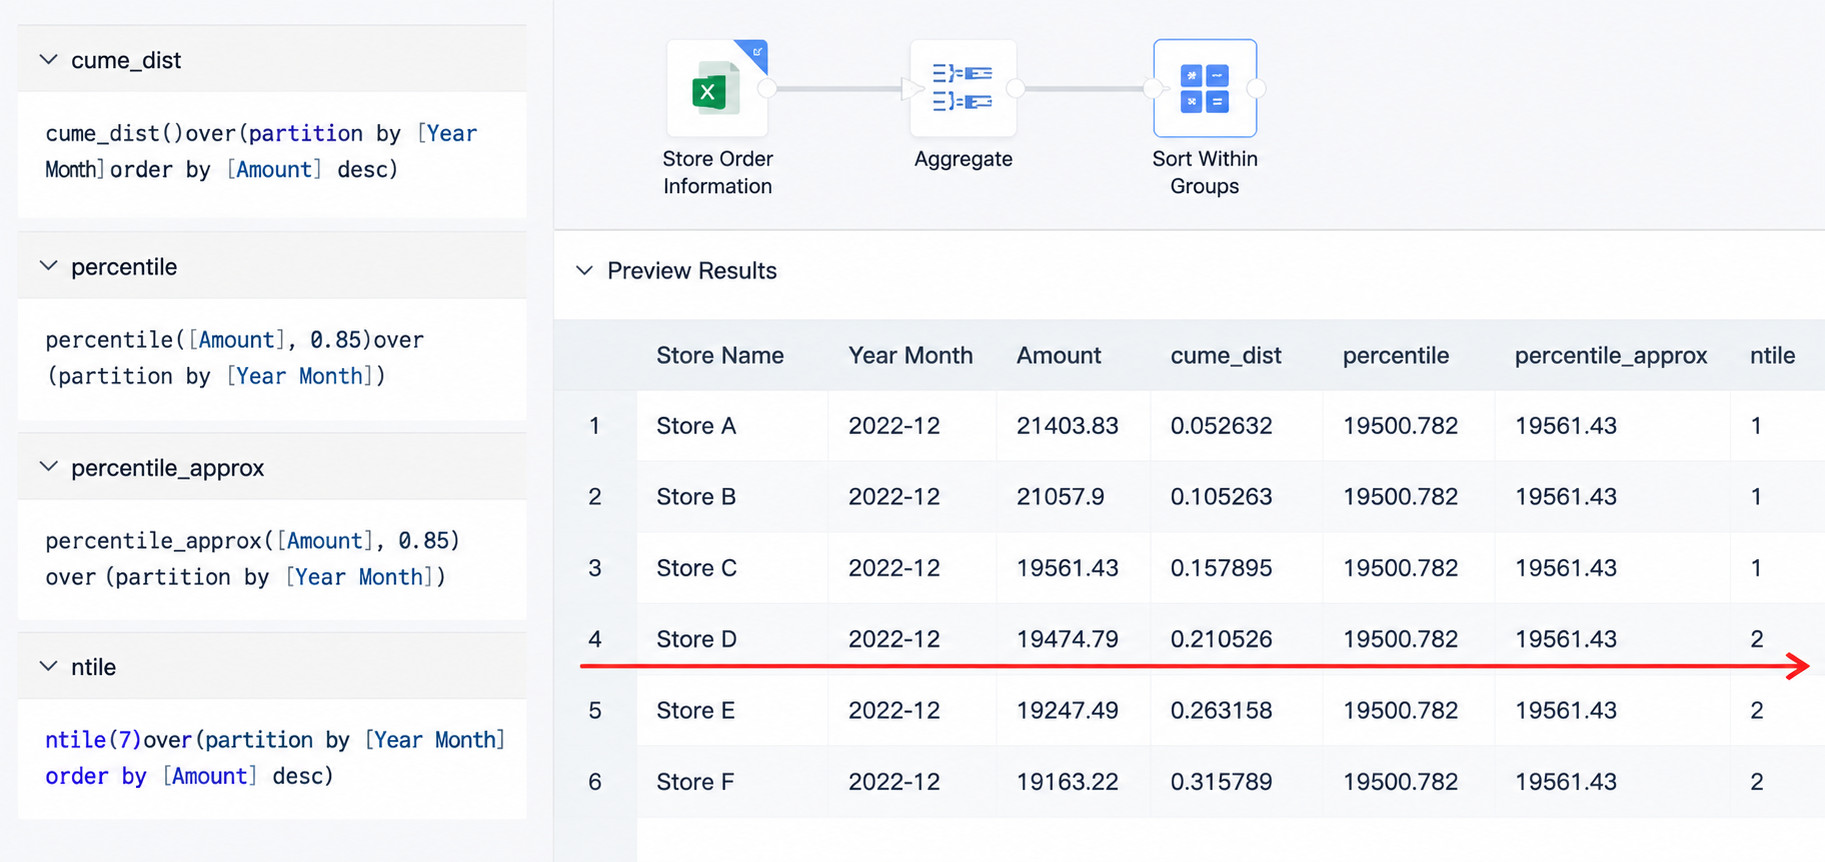
The comparison of the functions above is shown in the figure. In this case, when calculating Top 15%, percentile and ntile can only round up, keeping 3 out of 19. cume_dist and percentile_approx can support both rounding up and rounding down. If you need to change the calculation to Top 10% or another percentage, only cume_dist requires no ETL formula change and only needs the card filter condition to be modified. The other three functions require ETL changes. Choose the appropriate function based on the actual scenario.