Use Alerts to Monitor Changes in Numeric Fields
Requirement Background
You may need to compare the latest value of a field in a dataset with the historical data from the previous update, and send an alert notification each time the change reaches a certain amount, such as an increase greater than 100. In Guandata BI, this requirement can be implemented by combining ETL and alerts.
Example: the current value of the amount field is 600. You want to create an alert that sends a notification when the difference between the current updated amount and the previous updated amount is greater than or equal to 100.
Implementation
Use ETL to Create a Snapshot Table
For creating a snapshot table, see the help document Create Data Snapshots with ETL. In this scenario, note the following:
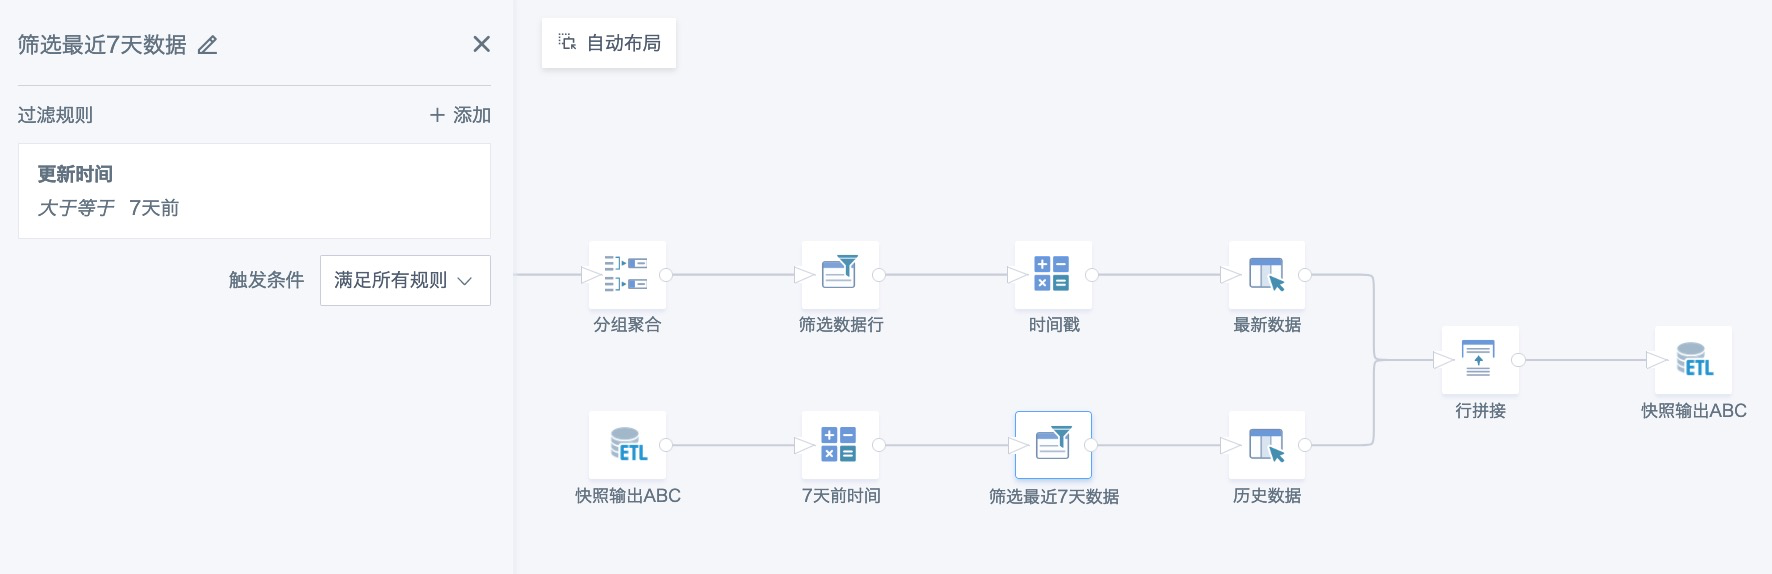
1. New data: If the input dataset changes quickly and updates multiple times within one day, process the data as needed in ETL, then create a calculated field with the now() function to add a timestamp to the data. If data changes slowly and updates infrequently, use current_date() to mark the data update date.
2. Historical data: If the dataset itself is large, or updates multiple times a day, the snapshot table will grow rapidly. Limit the time range of historical data, such as keeping only the last 7 days of data with the function now() - interval 7 days, to reduce the data size.
3. ETL update: It is recommended to trigger updates based on the input dataset.
The ETL structure is shown below:
Create the Dataset Used for Alerts
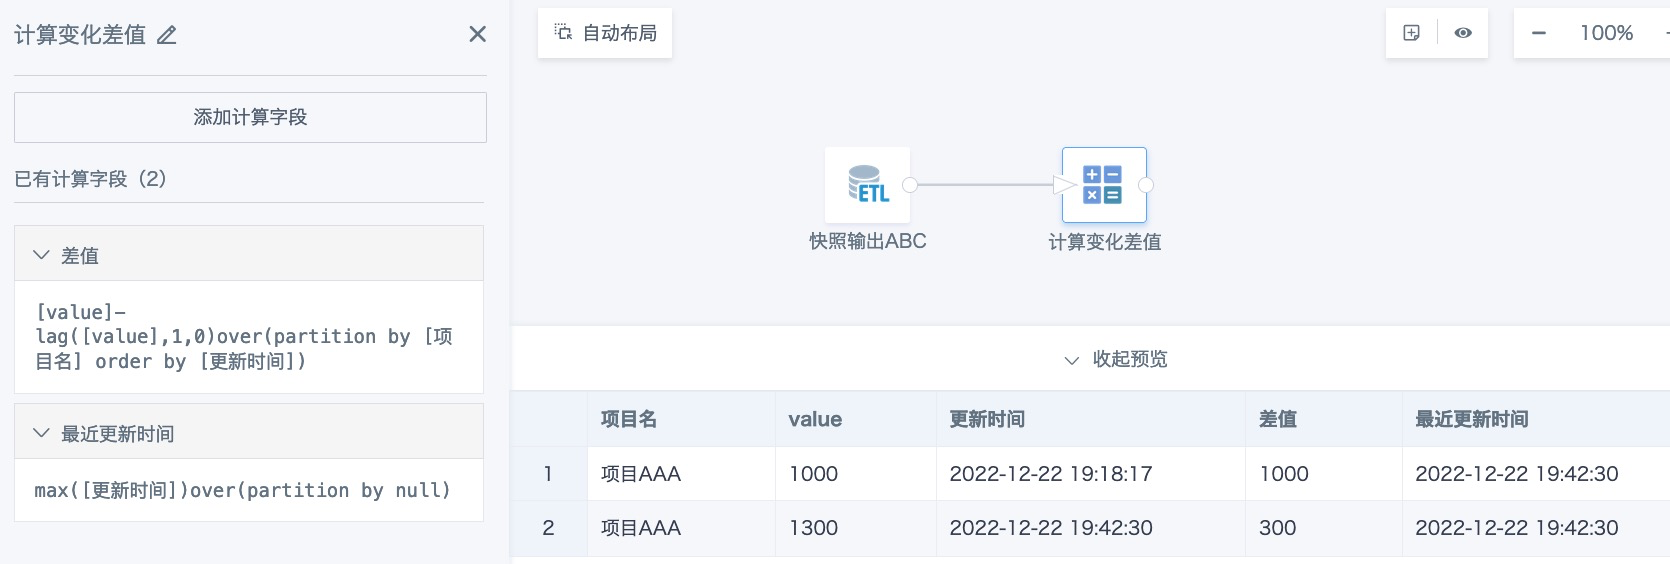
- Create an ETL and use the snapshot table obtained in the previous step as the input dataset. Use a window function to perform offset calculation, obtain the value from the previous update, and subtract it from the latest value to calculate the difference. If the dataset updates only once a day or keeps only one record, you can also calculate period-over-period comparison through a join node in ETL.
Create two calculated fields: numeric field Difference and datetime field Latest Update Time:
差值:[value]-lag([value],1,0)over(partition by [项目名] order by [更新时间])
    --lag([value],1,0) 代表按照更新时间升序排列后取上一行数据,没有上一行时取0;
最近更新时间:max([更新时间])over(partition by null)
    --用来标记最新更新时间,因为预警一般仅需要预警最近一次更新的数据。
The ETL preview is shown below:
Note: Offset functions include lag() and lead(). For details, see Spark Window Functions and Applications.
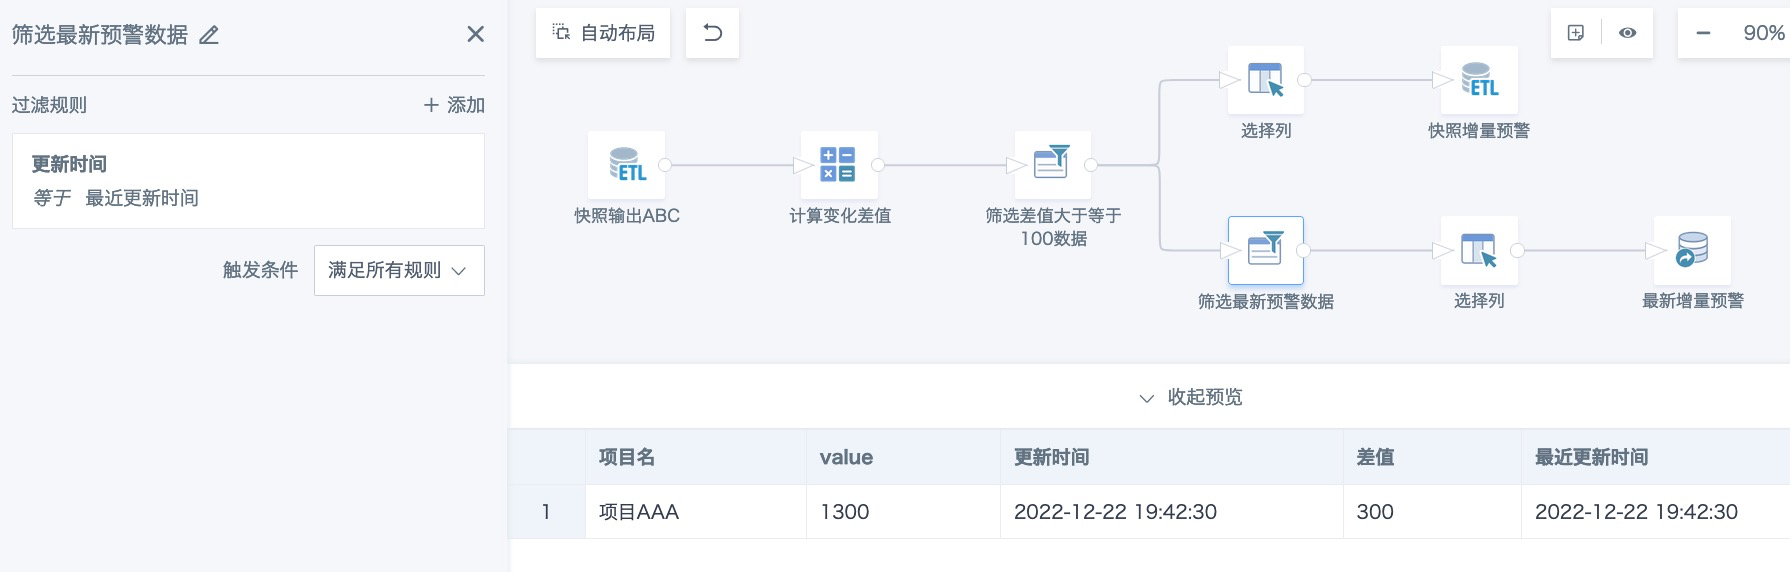
- Filter data where the difference is greater than or equal to 100, and filter records from the latest update. Select the columns to output and generate the dataset for alerts. If you need to keep historical alert records, output a new result set after filtering data where the difference is greater than or equal to 100. This case outputs two result sets. The upper one is used to save alert records and perform other analysis on changed data, and the lower one is used for latest data alerts. The ETL structure is shown below.
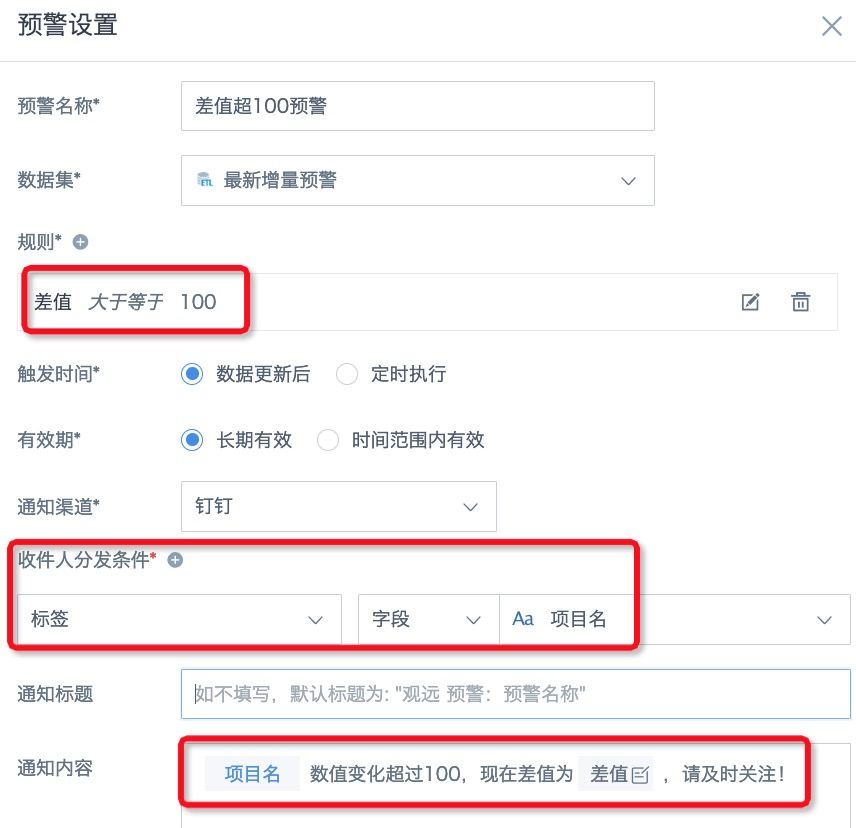
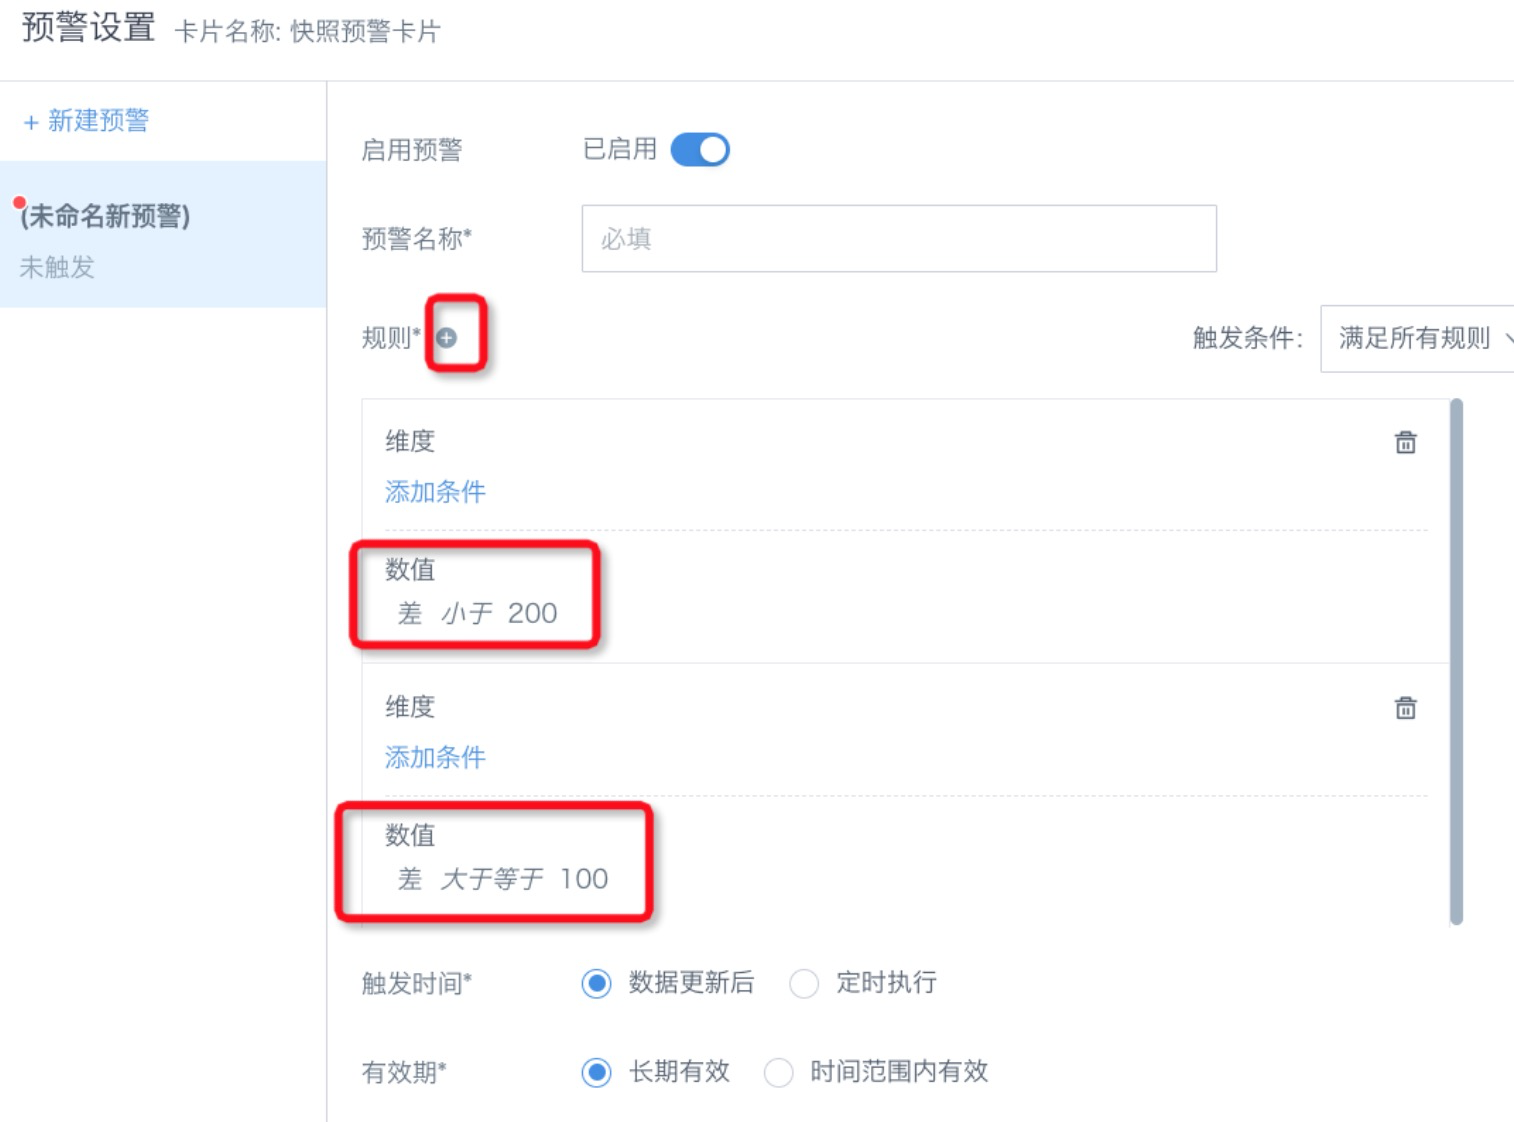
Create an Alert for "Difference"
Scenario 1: If the same content is pushed to specified personnel and you only want to push once after data updates, create a card and use a card alert.
Scenario 2: If recipients must be distributed and data details should be pushed to corresponding owners, use a dataset alert.