Use View Datasets to Count Foot Traffic
Requirement Scenario
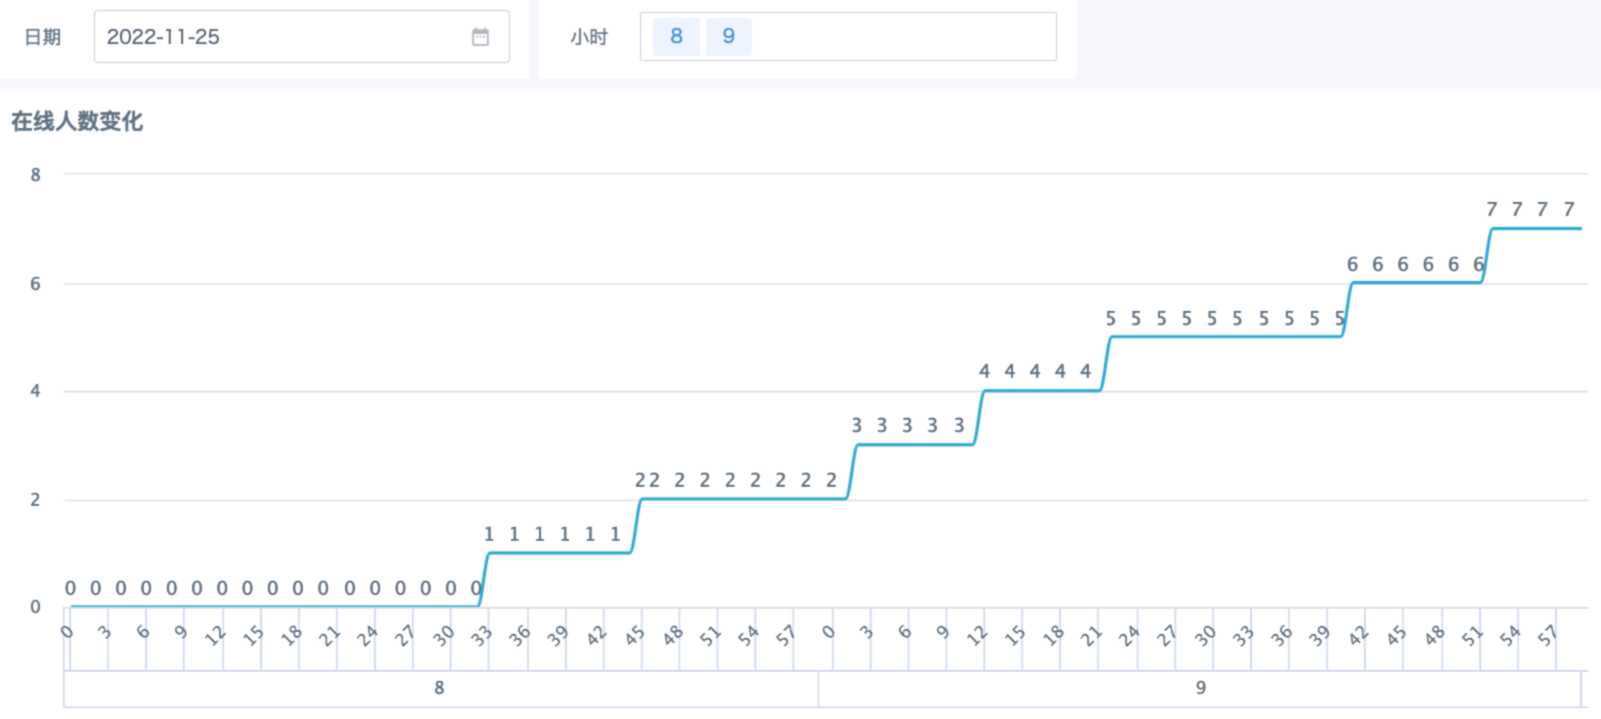
The data source is a zipper table that records user check-in time information at the daily granularity, including two time points: entry time and exit time. You need to filter a date range and count per-minute foot traffic changes during that period. Similar scenarios include foot traffic changes in shopping malls, tourist attractions, laboratories, viewer count monitoring in live streaming rooms, and audience rating statistics. The effect is shown below.
Implementation Challenges
1. The dashboard needs to display data at minute granularity, but the two time points in the dataset form a time range. If ETL is used to expand the date range to minute granularity, the data volume increases dramatically, which is not friendly to the system or report loading. ETL also does not support dynamic calculation linked with global parameters, so ETL is not recommended.
2. In a card, the minute values used as dimensions depend on the dataset and are affected by filters, so they cannot always stay fixed at 0-59. To make the dimension independent of the dataset and filters, use global parameters and a view dataset.
3. Due to BI feature limitations, a date filter with hours, minutes, and seconds cannot link with global parameters. Therefore, split date and hour into two filters, without considering minutes and seconds for now. For example, selecting hour 8 means filtering the period from 8:00 to 8:59 in the morning.
Implementation Method
1. Create a View Dataset
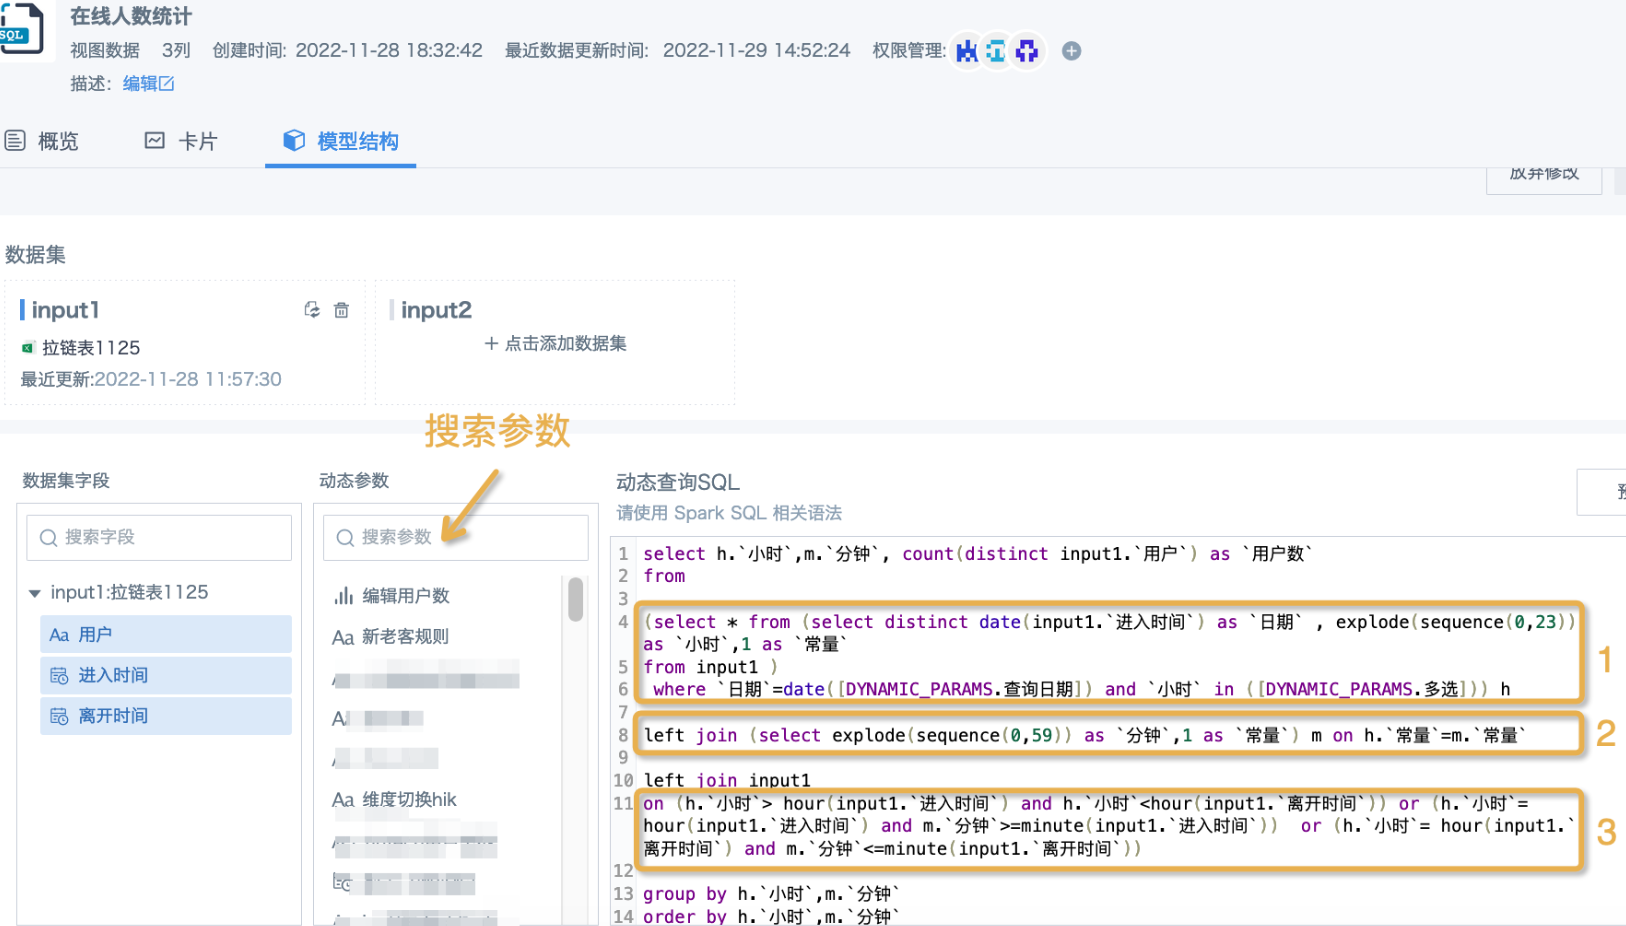
Select the zipper table dataset to use and write the SQL statement based on the following example. From the parameter area in the middle, choose a date-type global parameter for date filtering, such as [DYNAMIC_PARAMS.查询日期]. Prepare a text-type multi-select parameter for hours, such as [DYNAMIC_PARAMS.多选], so the filter can support multiple selections. If only single selection is needed, you can use a single-select text parameter or numeric parameter.
select h.`小时`,m.`分钟`, count(distinct input1.`用户`) as `用户数`
from
(select * from
  (select distinct date(input1.`进入时间`) as `日期` , explode(sequence(0,23)) as `小时`,1 as `常量`
  from input1 )
where `日期`=date([DYNAMIC_PARAMS.查询日期]) and `小时` in ([DYNAMIC_PARAMS.多选])) h
left join (select explode(sequence(0,59)) as `分钟`,1 as `常量`) m on h.`常量`=m.`常量`
left join input1
on (h.`小时`> hour(input1.`进入时间`) and h.`小时`=minute(input1.`进入时间`))  or (h.`小时`= hour(input1.`离开时间`) and m.`分钟`<=minute(input1.`离开时间`))
group by h.`小时`,m.`分钟`
order by h.`小时`,m.`分钟`
Notes
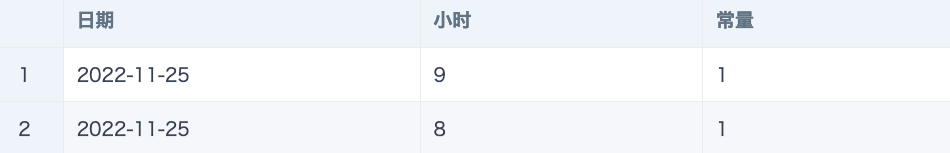
Part 1: Get the date and hour values filtered on the page, and perform a cross join to obtain temporary table h. When filtering 2022-11-25 and hours 8 and 9, the actual temporary table data is as follows.
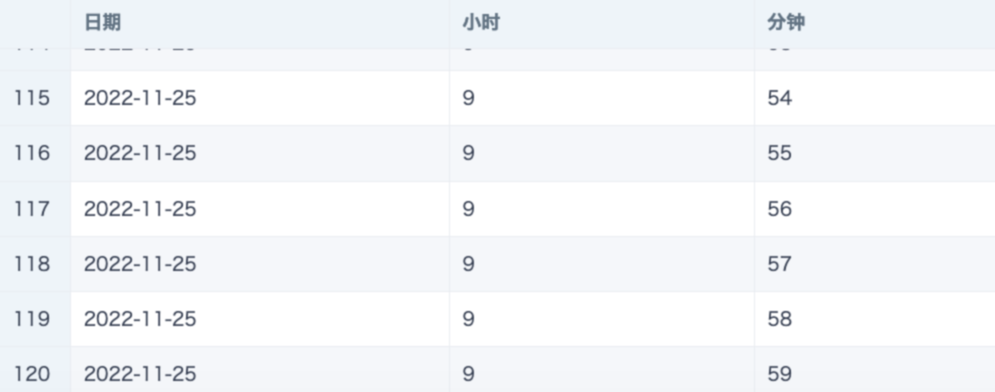
Part 2: Create temporary table m and expand it from 0 to 59. Use a constant field to join it with temporary table h, which is equivalent to a cross join here. This produces a time dimension table containing the query date, query hour, and complete minute values, with 120 rows in total.
Part 3: Use the time dimension table obtained above to continue left-joining the zipper table dataset, and count distinct user IDs. Pay attention to the join logic: for the hour containing Entry Time, match minute values greater than or equal to Entry Time; for the hour containing Exit Time, match minute values less than or equal to Exit Time; all intermediate hours must also be matched.
2. Build the Dashboard
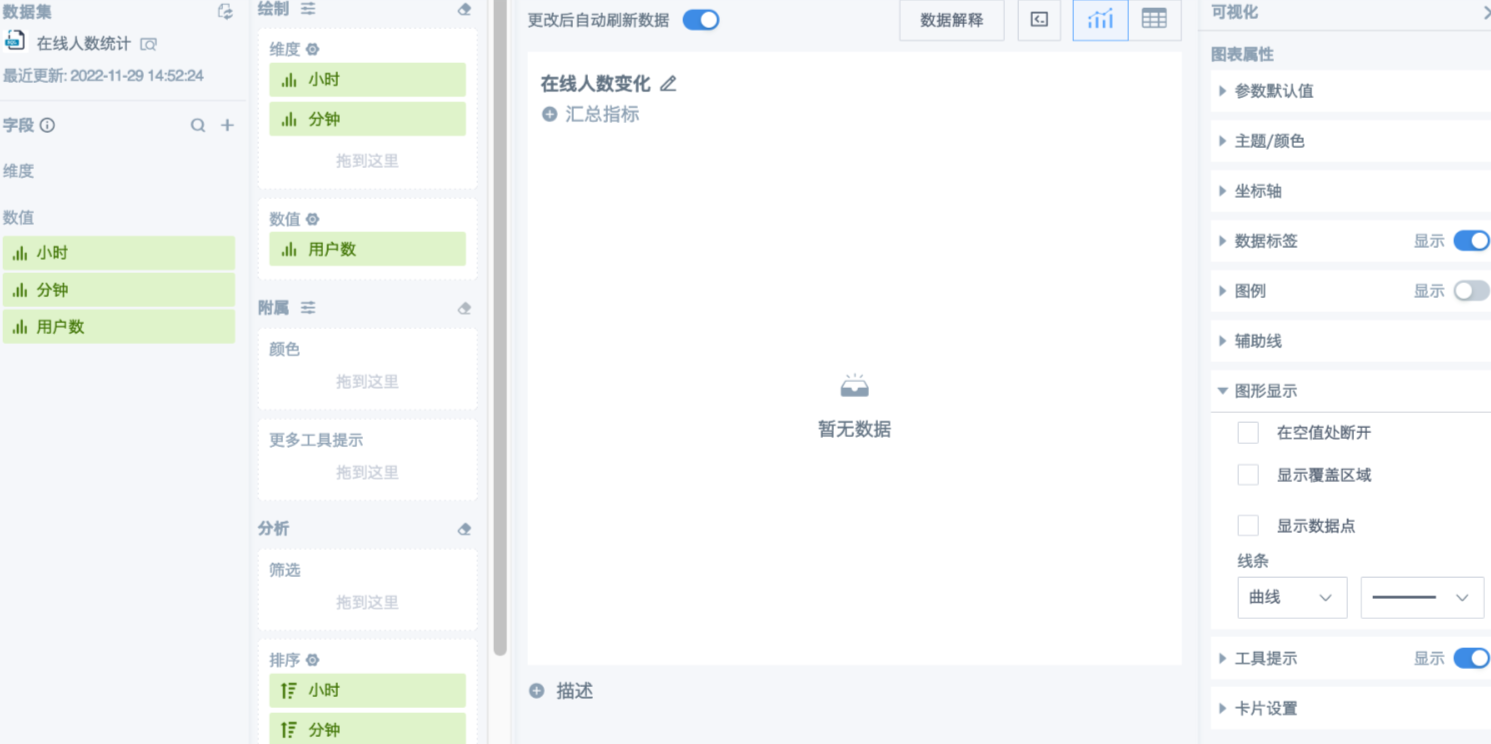
1. Use the created view dataset to create a Line Chart card. Drag the fields to display into the dimension area and measure area, set sorting and chart style, and save to return to the page. Due to parameter default values, preview may not work. You can ignore it for now, or modify default values on the right to preview the effect.
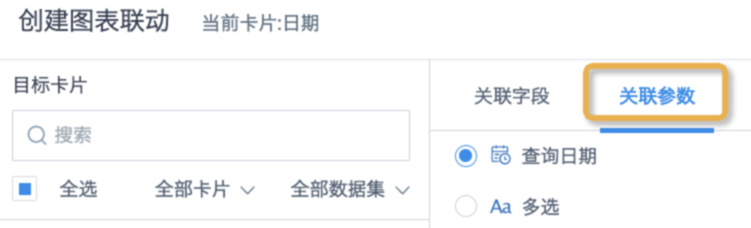
2. Create a date filter, set the comparison operator to Equals, set a default value, and then associate it with the date parameter in the card.
Do not select Provide hour, minute, and second selection, because after hours, minutes, and seconds are added, no parameter can be linked. Do not set Range either. Multiple dates severely affect the visual effect of a line chart that uses minutes as the dimension. A default value must be set. When there is no filter option, the parameter's own default value takes effect, and the chart may show no data.
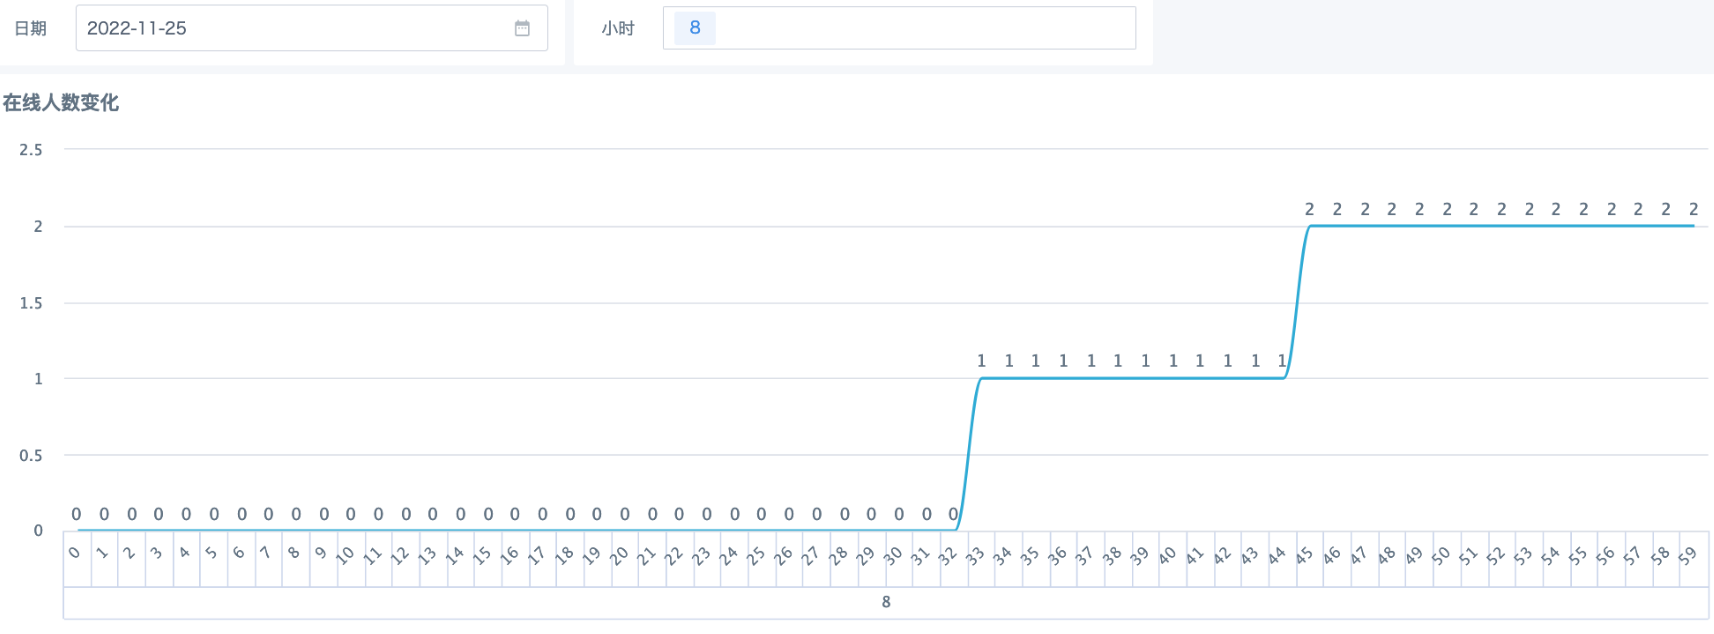
3. Use Excel locally to create a manual dimension table containing hour values from 0 to 23, and upload it to Guandata BI. Use this dataset to create a Select type filter. Set it to single-select or multi-select as needed, and set a default value, which is required. Then link it with the text parameter in the card. The effect with multi-select hour values is shown below.