Global Parameter Best Practices
Use Cases
When performing data fusion and data analysis, parameters are often required to complete complex dynamic chart analysis. This best practice helps you use global parameters in scenarios such as creating calculated fields in cards based on Guan-Index datasets, writing SQL for direct database datasets, and writing SQL for view datasets, so you can complete data analysis more effectively.
Overview
Global parameters are parameters that Guandata Data can use flexibly across multiple stages of data fusion and data analysis, such as cards, dataset calculated fields, view datasets, and SQL for direct datasets. By using parameters, you can implement complex dynamic chart analysis, such as switching analysis dimensions, switching analysis metrics, dynamically classifying data, and performing cross-table dynamic queries.
Cases
Global Parameters Support Different Dataset Types
3.1.1 Use a Date Parameter to Filter a Direct Database Dataset
When adding date-parameter-based filter conditions to SQL in a direct database dataset, such as filtering data for a selected day, MTD data, or YTD data, write SQL that matches the syntax of the connected database type. The following examples use MySQL.
-
The SQL below filters data for the selected day. If the default value of the date parameter filter is set to the dynamic time macro
{{{yesterday}}}, yesterday's data is filtered by default.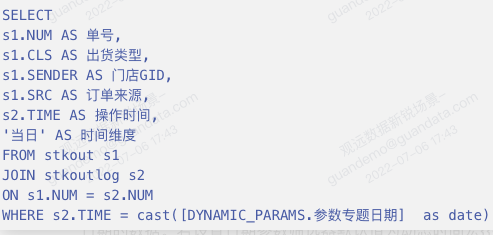
-
Modify the WHERE condition in the SQL statement to filter MTD data, meaning data from the 1st day of the month containing the selected date to the selected date. If the default value of the date parameter filter is set to the dynamic time macro
{{{yesterday}}}, MTD data for the month containing yesterday is filtered by default.

-
Modify the WHERE condition in the SQL statement to filter YTD data, meaning data from January 1 of the year containing the selected date to the selected date. If the default value of the date parameter filter is set to the dynamic time macro
{{{yesterday}}}, YTD data for the year containing yesterday is filtered by default.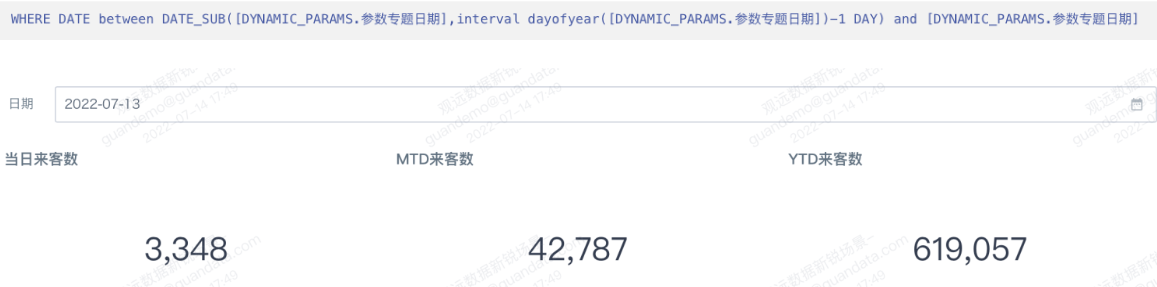
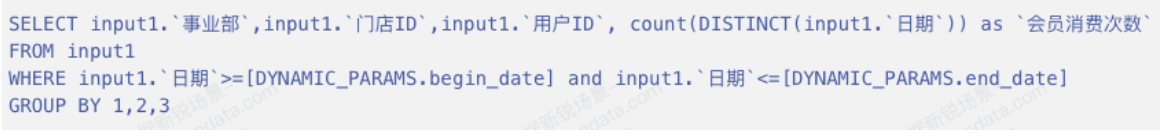
3.1.2 Use a Date Parameter to Filter a View Dataset
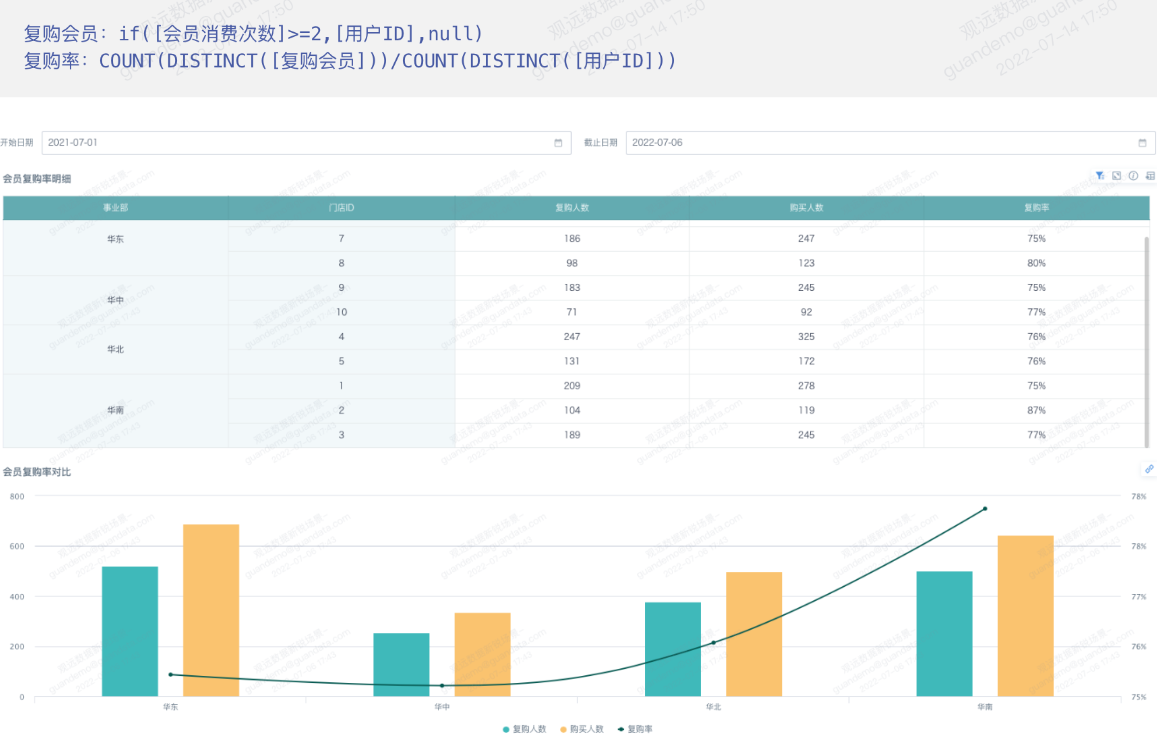
Adding date-parameter-based filter conditions to SQL in a view dataset can implement member repurchase rate calculation based on dynamic date selection. Member repurchase rate = number of members with purchase count (days) ≥ 2 / number of all members with purchases.
- Create a view dataset in Data Center and add the following date-parameter-based filter condition to the SQL statement.
- Create a card from the view dataset and create a calculated field.
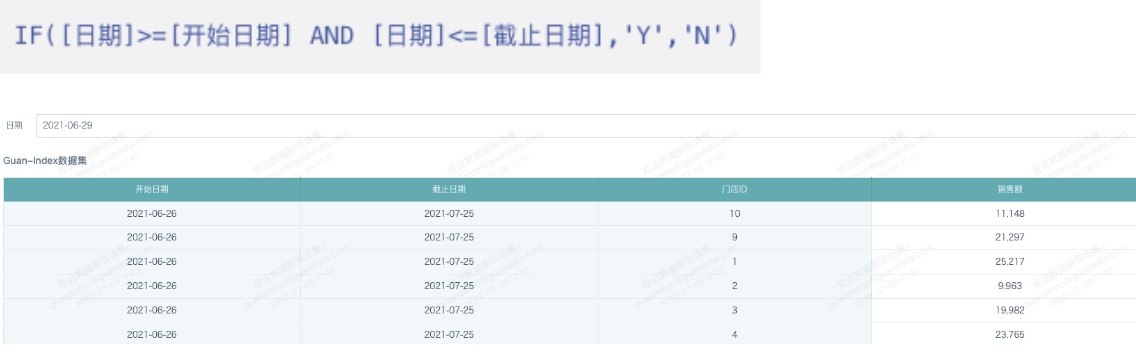
3.1.3 Use a Date Parameter to Filter a Guan-Index Dataset
To filter a Guan-Index dataset with a date parameter, create a card from the Guan-Index dataset and add a field or date filter condition based on the date parameter in the card. For example, show data from the fiscal month containing the selected date. Assume the fiscal month runs from the 26th of the previous month to the 25th of the current month. When the selected date is 2021-06-15, the card displays data from 2021-05-26 to 2021-06-25. When the selected date is 2021-06-29, the card displays data from 2021-06-26 to 2021-07-25.
- Card field: Start Date. Field type: date. When the selected date is before the 26th, display the 26th of the previous month. When the selected date is on or after the 26th, display the 25th of the selected date's month.

-
Card field: Selected Date. Field type: text. Use this field in the card filter to filter the valid time range. Filter condition: Selected Date = 'Y'.
Use Global Parameters as Filter Conditions for New Fields
Calculate a Metric Total
Use the following calculation formulas to calculate the ratio of selected store sales to total national sales:
- Create a card calculated field: Store Check.

- Selected store sales.
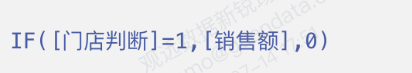
- Create a card calculated field: Sales Ratio.
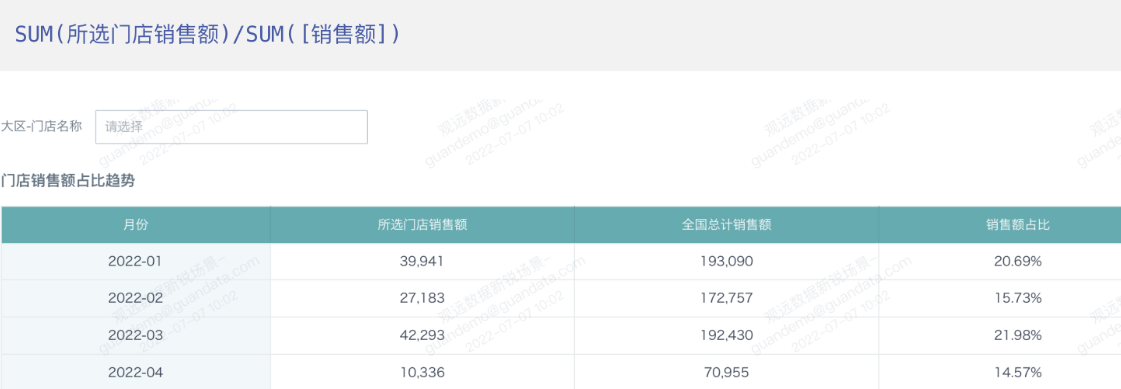
Calculate a Metric Cumulative Value
When comparing and analyzing sales by time dimension, select a date and compare the cumulative sales for the week, month, and year that contain that date.
- Create a card calculated field: WTD Sales.

- Create a card calculated field: MTD Sales.

- Create a card calculated field: YTD Sales.
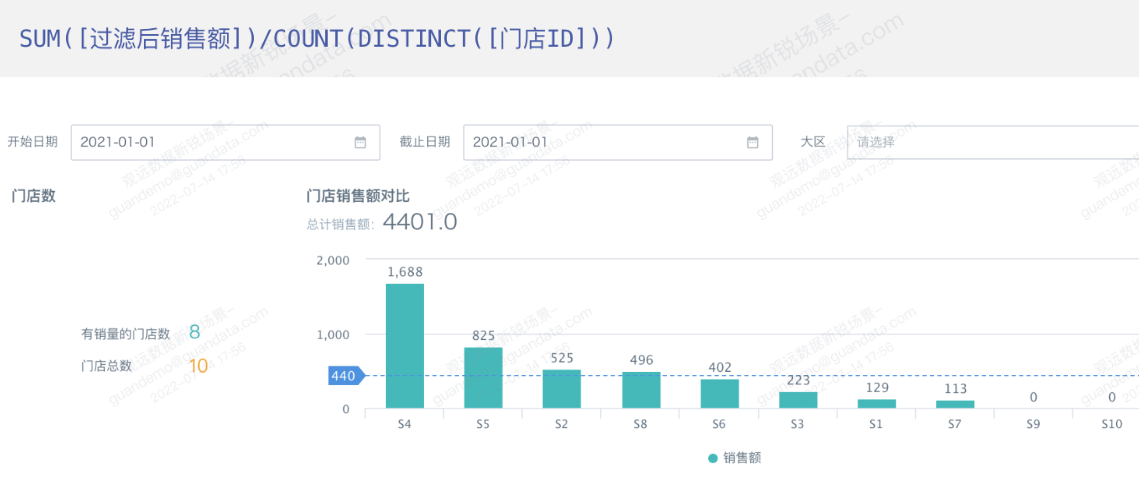
Show Dimensions with No Data in a Time Period on a Card
Some stores may have no data in a certain time period, but you may still want to show them in the chart and include them when calculating the average.
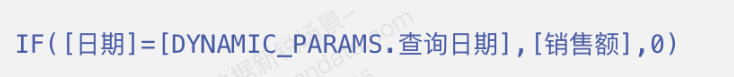
In general, you can use ETL to complete the data, so every store has one row of data every day and sales are filled with 0 when there are no actual sales. However, if the dataset already contains data for all stores and only has no data under a specific filter condition, consider using global parameters to write filter conditions for calculating sales. This allows stores with no sales in the selected time period to be displayed.
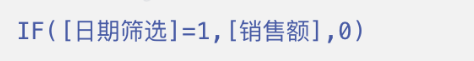
- Create a card calculated field: Date Filter.

- Create a card field: Filtered Sales. Add it to the value field well and set the aggregation method to sum.
- Create a calculated field: Average Sales per Store. Use this field to set the card's reference line.
Flexible Time Filtering and Comparison
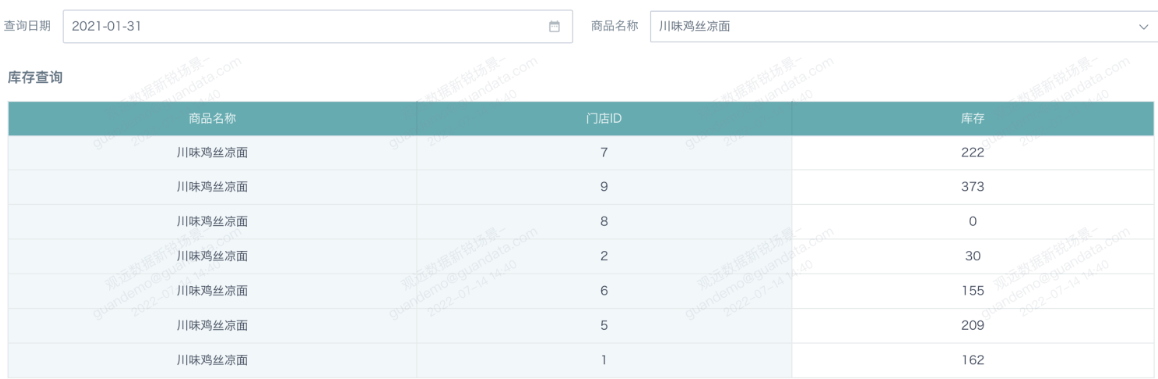
Query Inventory for Any Date
To query inventory for any date with a date parameter, use a UDF developed by Guandata to build a key-value query field, and use the date parameter in the corresponding UDF to query the inventory of each product in each store for any date.
- In ETL, use the Guandata-developed UDF
date_range_buildto build a key-value inventory query field. In SQL, first sort the data by date, then use the UDF to build the inventory query field.
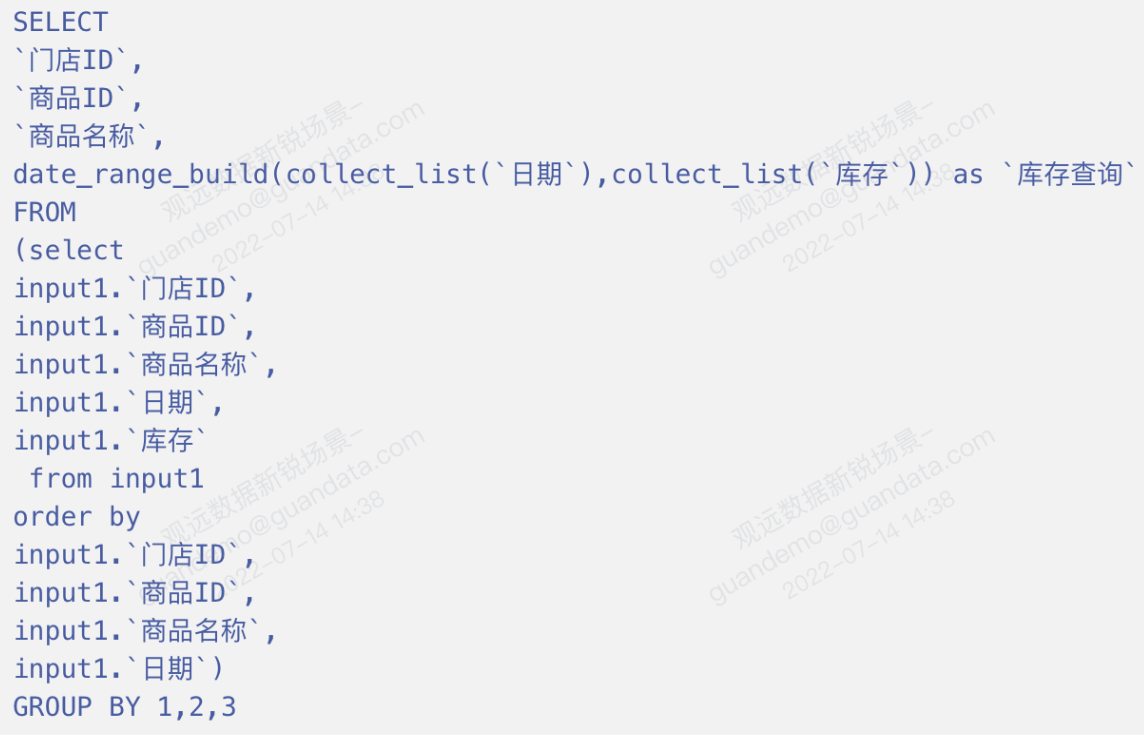
- In the card, create a query field based on the date parameter and add this field to the card value field well.

- Note:
Use date_range_lookup to look up inventory upward on a rolling basis. Use date_range_get to exactly find the inventory for the selected date.
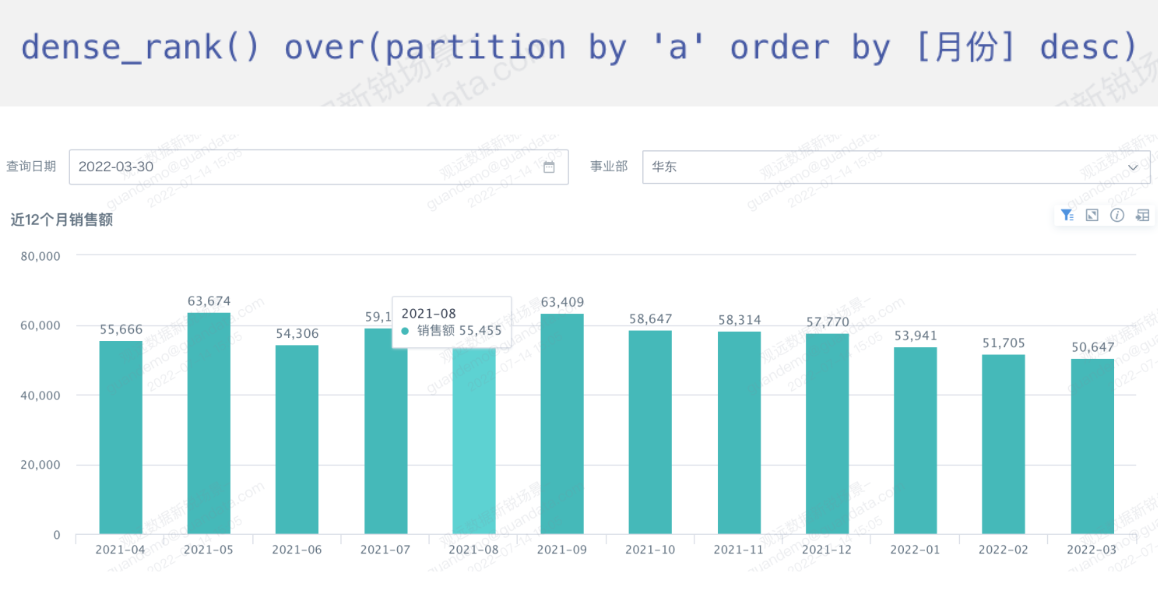
Dynamically Filter Data from the Last 12 Months
Use one date parameter filter to control the card so it displays data from the last 12 months relative to the selected date. For example, if the selected date is 2021-06-06, the bar chart displays 12 months of data from 2020-07-01 to 2021-06-30, sorted by month in ascending order.
- Card field: Selected Date. Field type: text. Use this field in the card filter. Filter condition: Selected Date = 'Y'. This is equivalent to filtering data less than or equal to the month of the selected date.

- Card field: Month Descending Order. Field type: numeric. Use this field in the card filter to filter data from the last 12 months. Filter condition: Month Descending Order ≤ 12.
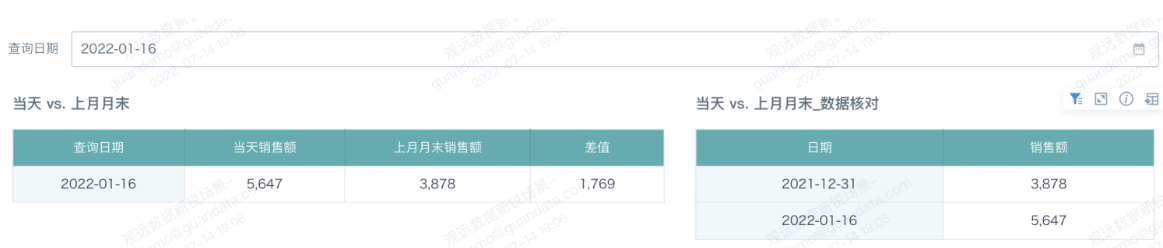
Flexibly Compare Metric Values from Different Dates
In some business scenarios, such as bank deposit balance metrics, you need to compare the value on the query date with the value at the end of the previous month and calculate the difference. For example, if the selected query date is 2021-01-16, the corresponding end date of the previous month is 2020-12-31, and you need to calculate the difference between these two dates.
- Card field: Query Date. Field type: date.
- Card field: Current-Day Sales. Field type: numeric.
- Card field: Previous Month-End Sales. Field type: numeric.

- Card field: Difference. Field type: numeric.

- Card field: Date Filter. Field type: numeric. Add this field to the card filter field well. Filter condition: Date Filter = 1. This is equivalent to filtering out the current day and the corresponding previous month-end date.
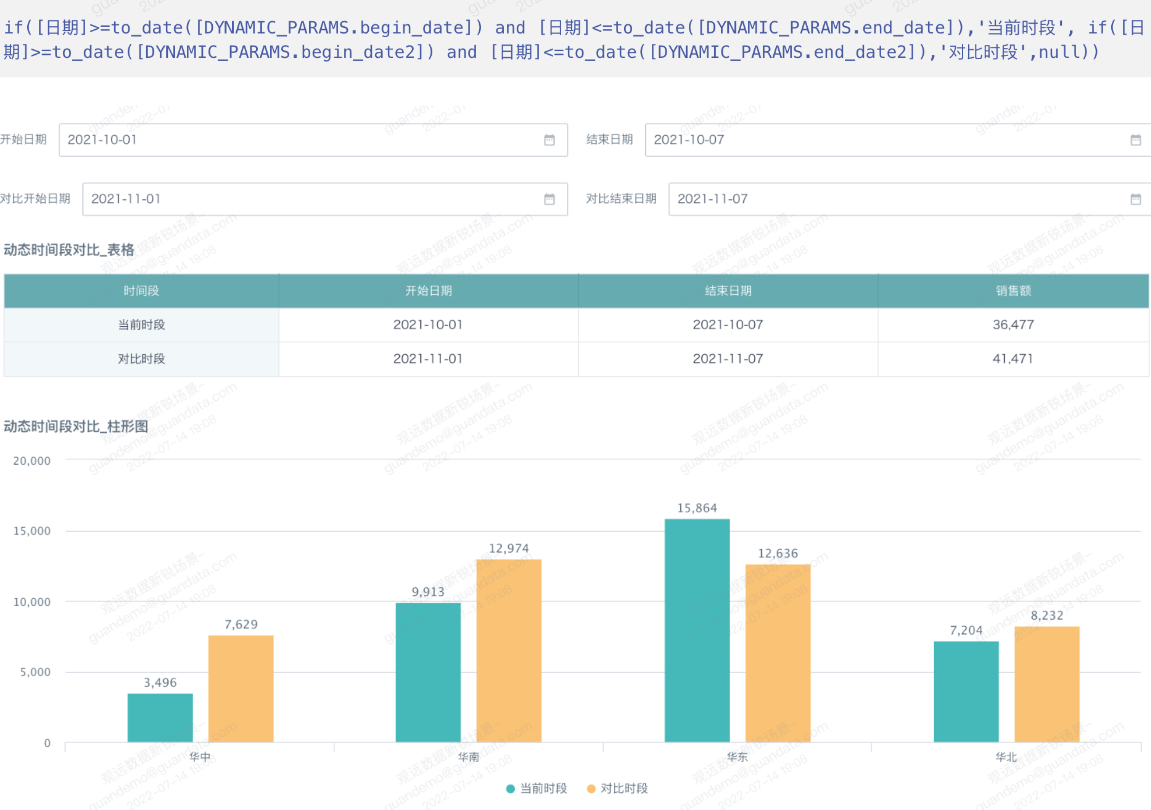
Flexibly Compare Metric Values from Two Time Periods
With global parameters, you can freely filter data from two time periods for comparison analysis. For example, filter data in one custom time period and summarize its sales, then compare it with summarized sales from another custom time period.
- Card field: Time Period. Field type: text. It displays 'Current Period' or 'Comparison Period'. Use this field in the card filter to filter valid time periods. Filter condition: Time Period is not null.
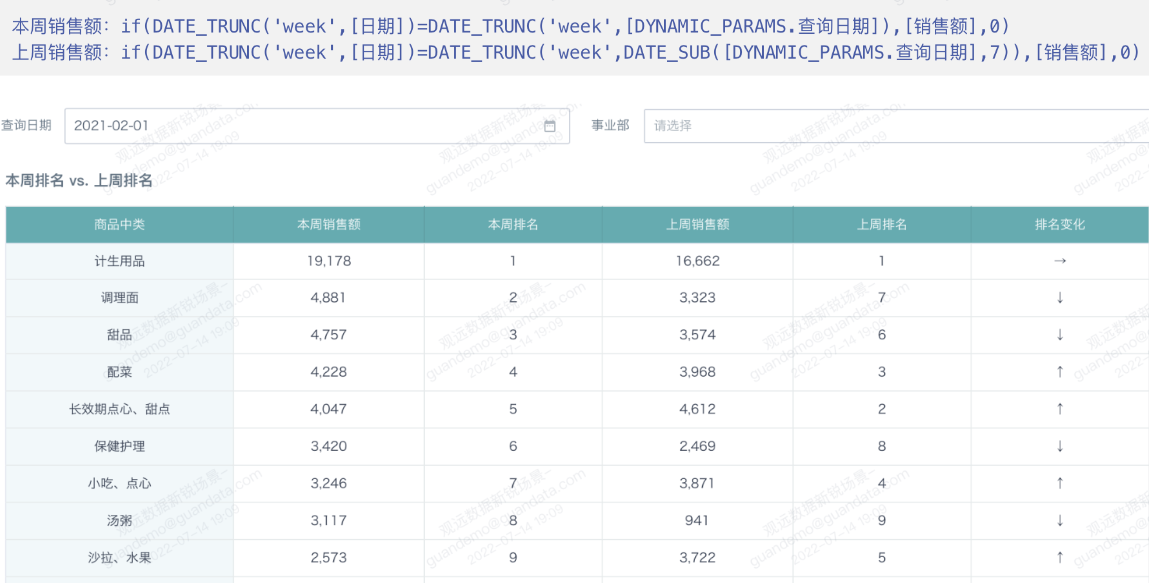
Flexibly Compare Sales Rankings for This Week and Last Week
When comparing and tracking sales and sales rankings for products, regions, stores, brands, and similar entities, you can flexibly compare this week's and last week's sales rankings.
- Card field: Query Date. Field type: date.
- Card field: This Week's Sales. Field type: numeric. Use this field for ranking advanced calculation to obtain this week's ranking.

- Card field: Last Week's Sales. Field type: numeric. Use this field for ranking advanced calculation to obtain last week's ranking.

- Card field: Ranking Change. Add the This Week's Sales field to the value field well and set conditional formatting based on comparing this week's ranking with last week's ranking.
This week is defined as the period from 7 days before the query date to the query date. Last week is defined as the period from 14 days before the query date to 8 days before the query date. If your definitions of this week and last week are different, adjust the calculation formula.
For example, if this week is defined as the week containing the query date, and last week is defined as the previous week before the week containing the query date, use the following formula:
Flexible Metric Switching
Flexibly Switch Card Metrics
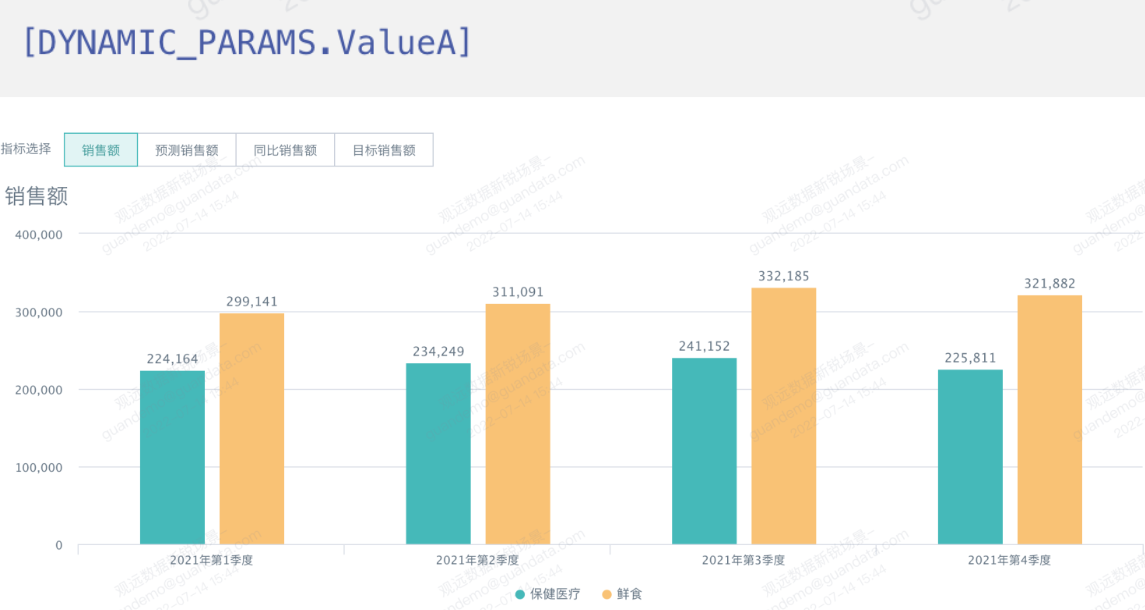
With a text parameter filter, you can freely select value fields, or metrics, and dynamically display the selected metric in the card.
- Card field: Metric. Field type: numeric. Add this field to the card value field well.
- Card field: Metric Name. Field type: text. Add this field to the summary metric area above the card and set the summary method to maximum.
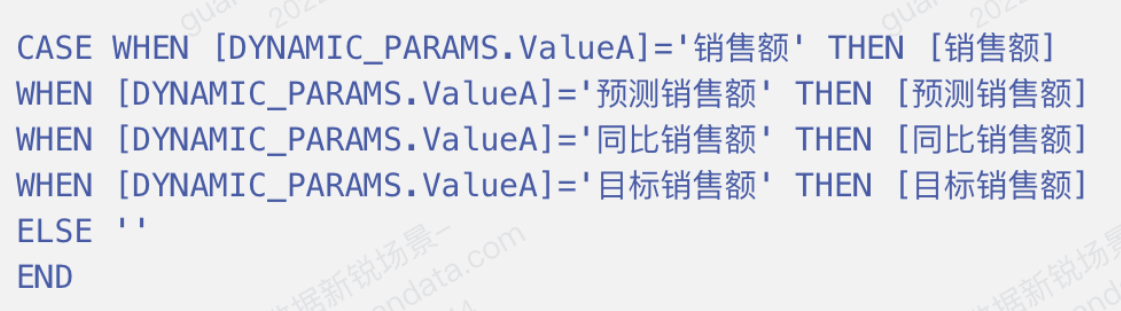
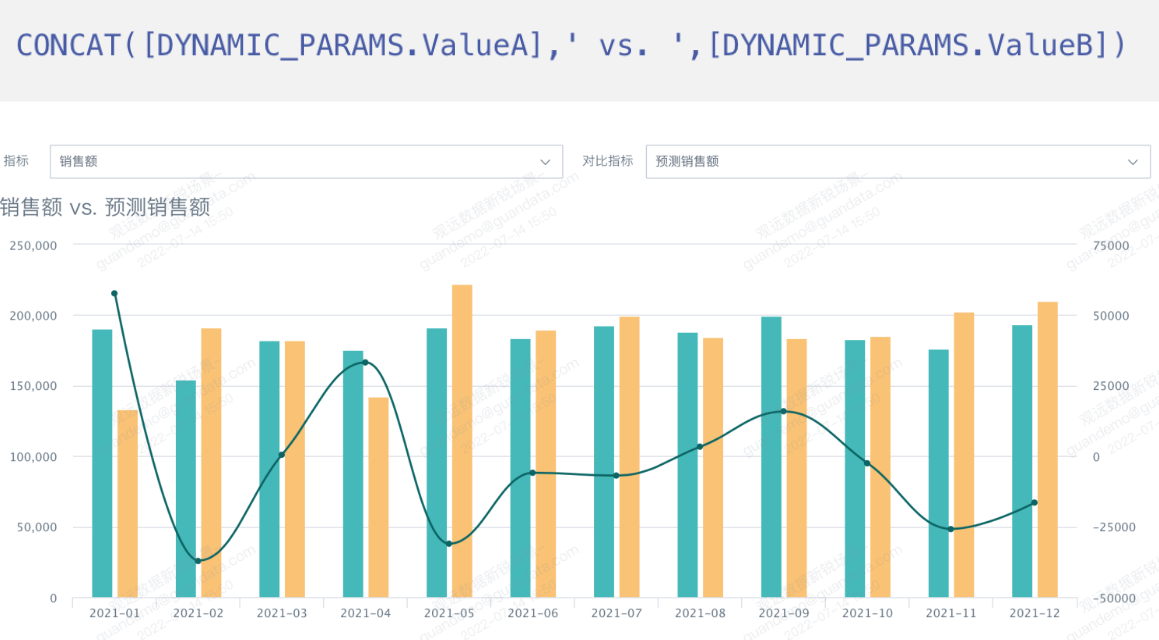
Flexibly Compare Metrics One-to-One
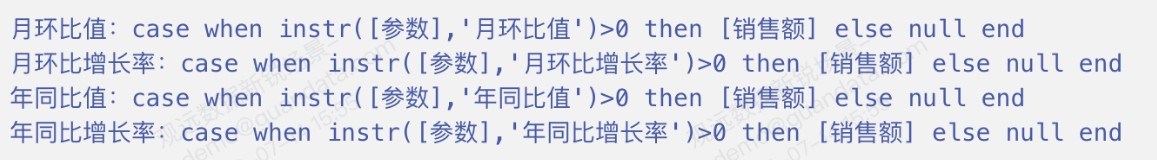
With a text parameter filter, you can freely compare multiple metrics. It can also be used to calculate the difference between any two metrics. For example, compare sales with predicted sales, or compare sales with year-over-year sales.
- Card field: Metric. Field type: numeric. Add this field to the card value field well.
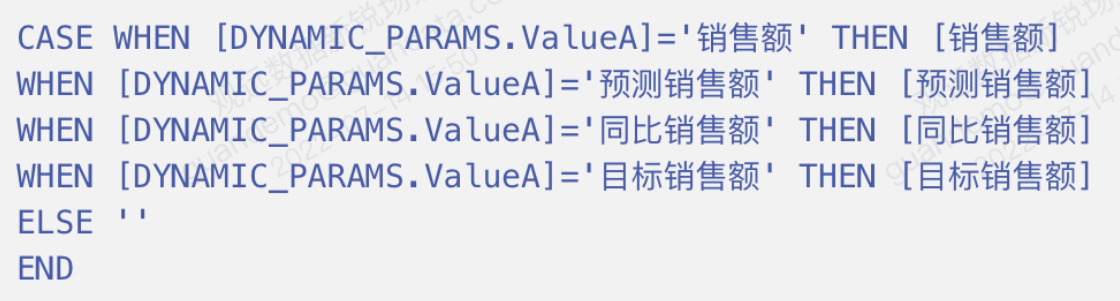
- Card field: Comparison Metric. Field type: numeric. Add this field to the card value field well.
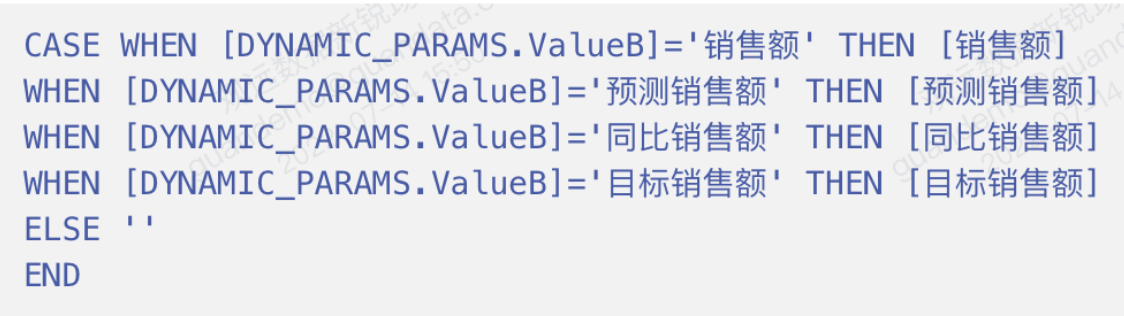
- Card field: Difference. Field type: numeric. Add this field to the card value field well.

- Card field: Comparison Metric Name. Field type: text. Add this field to the summary metric area above the card and set the summary method to maximum.
Compare One Metric with Multiple Metrics
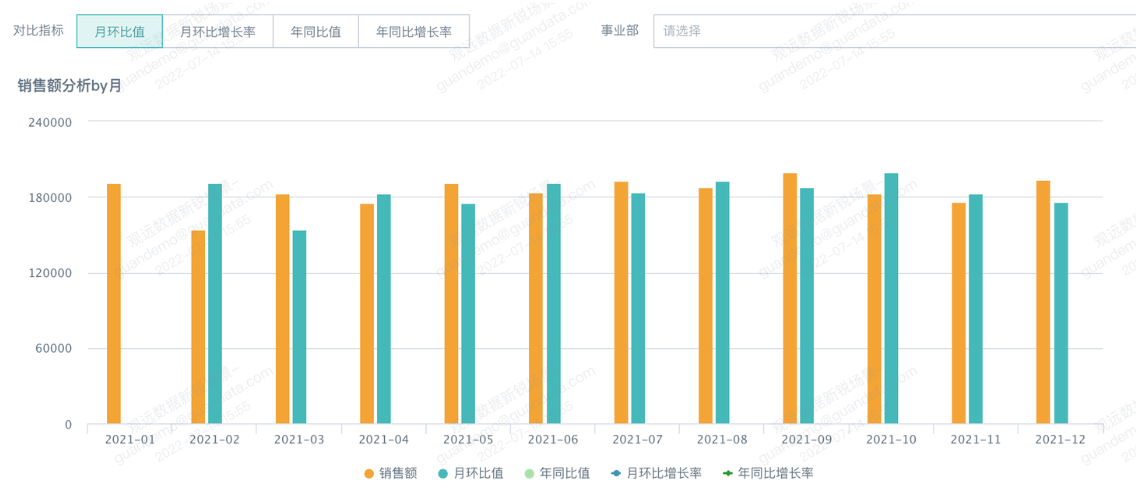
With a text parameter filter, you can compare one metric with multiple metrics. For example, the chart displays only sales by default, while allowing users to select one or more metrics for comparison.
- Create multiple card fields as comparison metrics and set all field types to numeric.
- Add the fields separately to the value field well or the stacked chart value field well, and set the corresponding advanced calculations.
- Because all metrics are already added to the value field well, the legend in this case cannot be hidden. The system itself supports clicking legends to choose whether metrics are displayed. Unlike that feature, this method displays only one metric by default instead of all metrics.
Flexible Analysis Dimension Switching
Flexibly Switch Card Display Dimensions
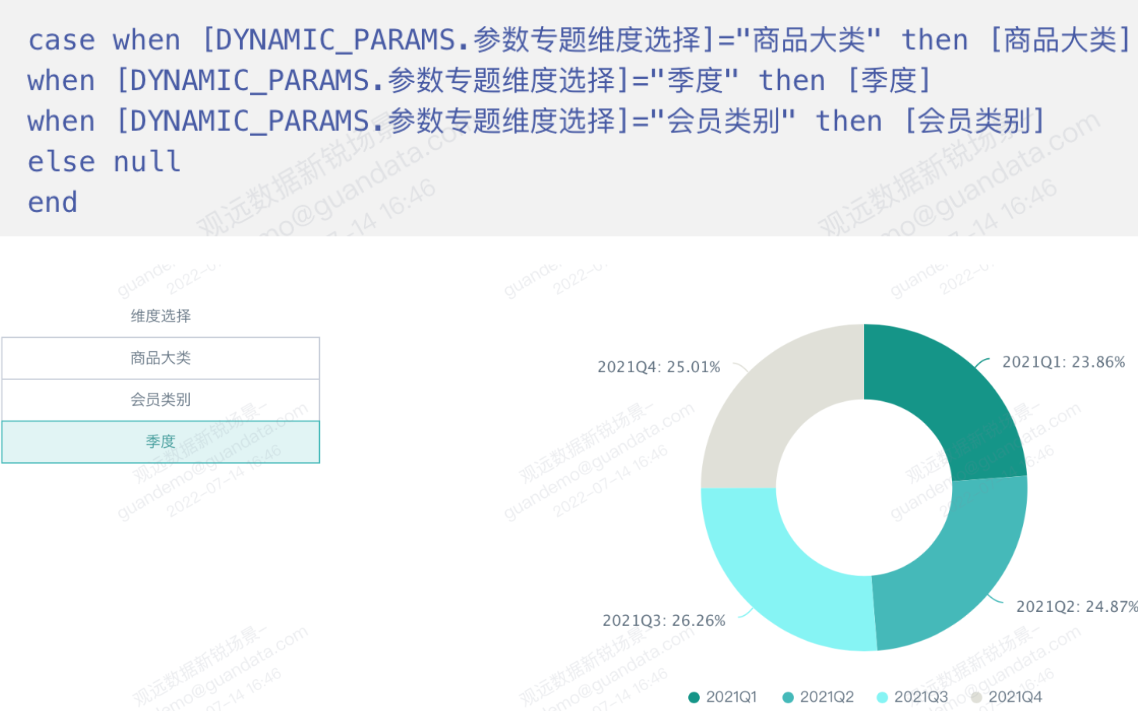
Use a text parameter filter to freely select the card analysis dimension. For example, choose whether the same card is aggregated by category dimension or member type dimension.
Card field: Metric. Field type: text. Add this field to the card dimension field well.
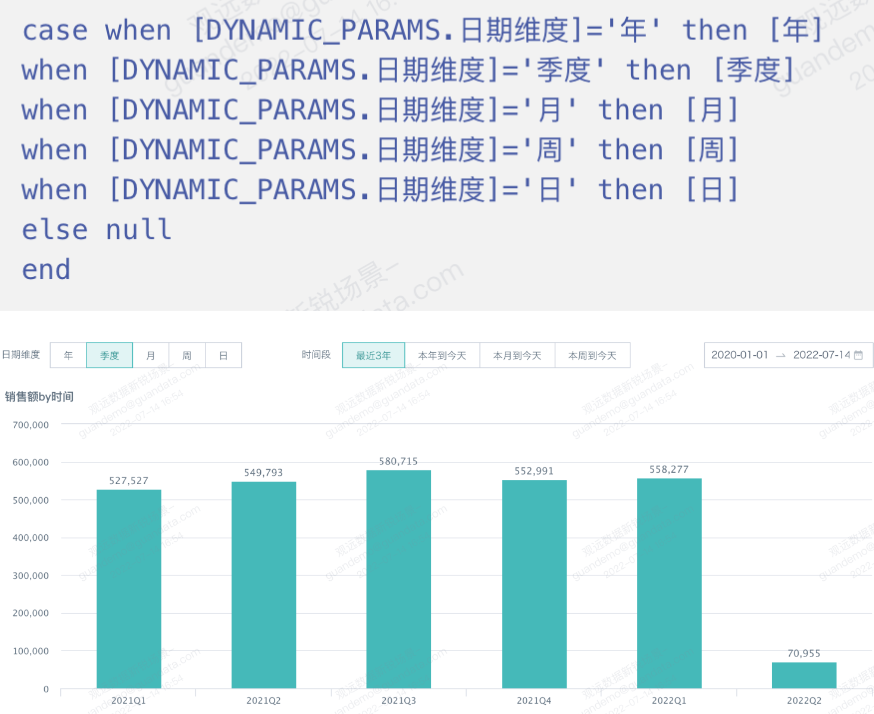
Flexibly Switch the Time Dimension of a Card
With a text parameter filter, a card can dynamically display data across different time dimensions. It can also be used with a quick date range filter to select different time periods.
For example, choose whether the same card aggregates by year, month, week, day, or other time dimensions. When Date Dimension = 'Year', select the time range 'Last 3 Years'. When Date Dimension = 'Month', select the time range 'Year to Today'.
- Create separate date dimension fields such as year, month, week, and day. Set all fields to text type.
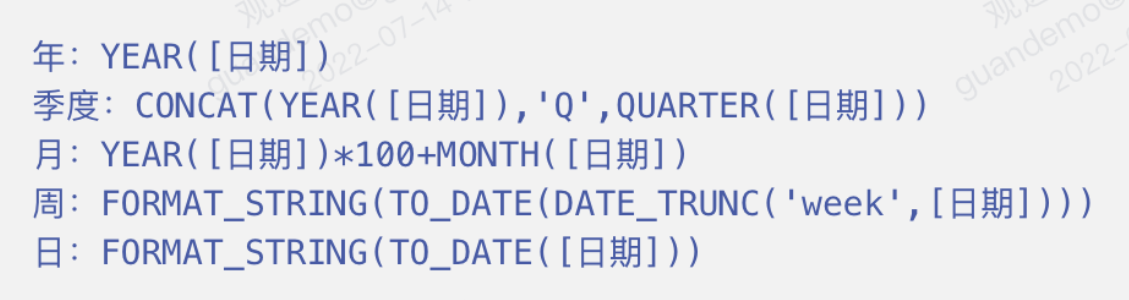
- Create a date dimension field based on text functions, set the field type to text, and add it to the card dimension field well.
Implement Special Filter Effects
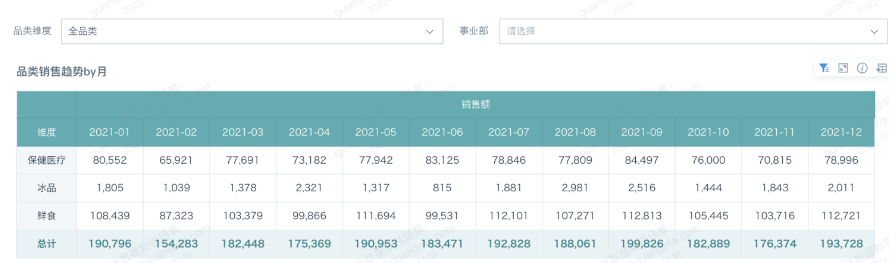
Implement a Tree-Structured Dimension Filter
Use a text parameter to create a tree-structured parameter filter and dynamically switch dimensions. For example, when users select All Categories in the tree parameter filter, the table displays the product major category dimension. When users select a major category, the table displays the product middle category dimension. When users select a middle category, the table displays the product minor category dimension.
- Card field: Middle Category Parameter Check. Field type: Boolean. Use this field to create the "Dimension" card field.

- Card field: Minor Category Parameter Check. Field type: Boolean. Use this field to create the "Dimension" card field.

- Card field: Dimension. Field type: text. Add this field to the card dimension field well and use this field in the card filter. Filter condition: Dimension does not equal "Invalid".
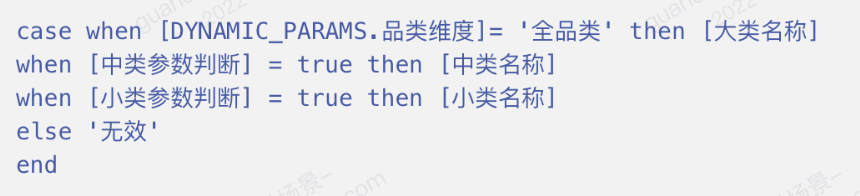
- Page filter: Category Dimension. Use the text parameter "Category Dimension" to create a parameter filter, manually add options, and set it to a tree structure.
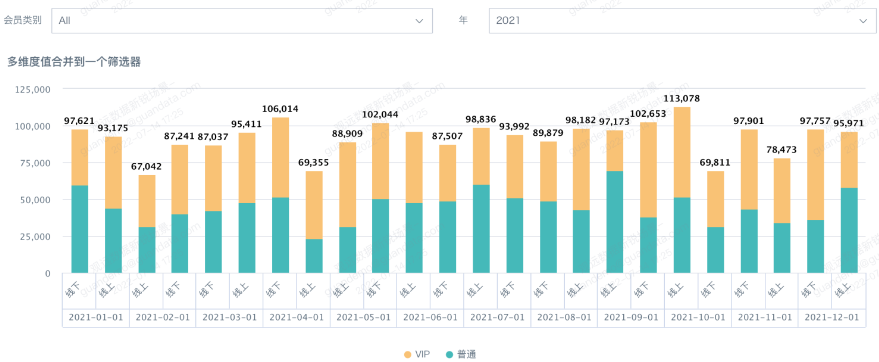
Link a Single Filter to Multiple Dimensions
Adding a global parameter allows a single filter to display options from Dimension 1 and Dimension 2 at the same time. For example, Dimension 1, or member type, contains Regular and VIP, while Dimension 2, or member type 2, contains Online and Offline. The relationship between the two dimensions is many-to-many. The "Member Type" filter can display four options from both member classifications.
- Card field: Integrated Member Type. Integrates data from Dimension 1 and Dimension 2. Field type: text.

- Card field: Member Type Filter. Field type: numeric. Add this field to the card filter. Filter condition: Member Type Filter greater than 0.

- Parameter filter: Use the text parameter "CustomerType" to create a filter on the page and manually set options.
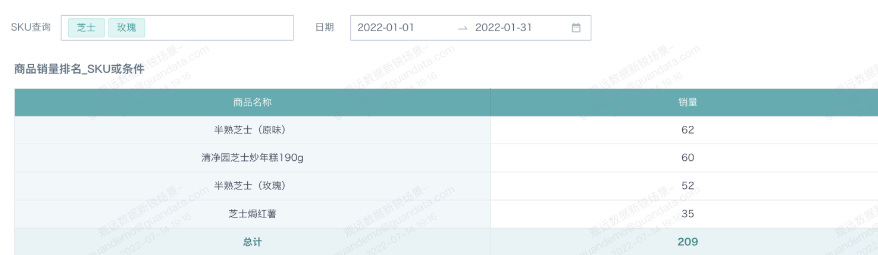
Implement Fuzzy SKU Search
In e-commerce scenarios, product titles often include various high-frequency search terms for search optimization, which makes product title changes unpredictable. This case filters products by specific flavor keywords in product names, meeting the fuzzy matching requirement, and supports filtering multiple flavors at the same time, meaning an OR relationship between flavors.
- Card field: SKU. Field type: text. Use this field to create the "SKU Filter" card field.

- Card field: SKU Filter. Field type: Boolean. Add this field to the card filter. Filter condition: True.

- When creating the card field "SKU Filter", because the parameter filter input is multi-value, Spark functions for processing arrays are used. Visit the Spark official website to learn how to use these functions.
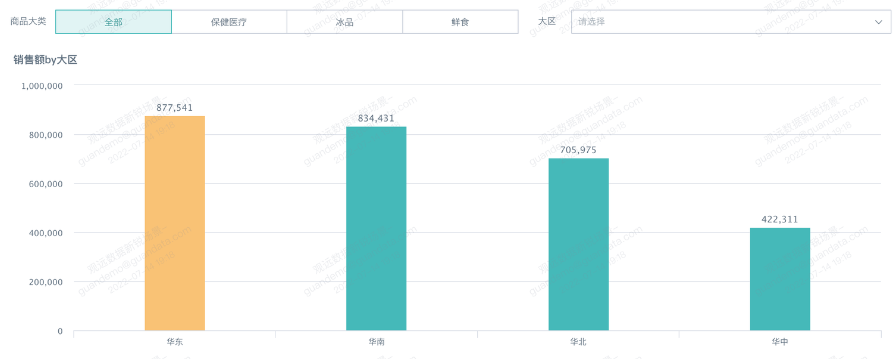
Flexibly Highlight the Selected Item Color
With a text parameter, you can dynamically display the graphic color of filtered items. The graphic corresponding to the selected item is displayed in a color different from other items. For example, when East China is selected, East China is displayed in orange and other regions are displayed in blue.
- Create a card field "Region". Field type: Boolean.

- Add the "Region" field to the card color field well and set colors.
- Create a selection filter > set the linked field to "Business Unit" > Default Value: Follow User Attribute > Set Linkage: associate the parameter "Region". In some scenarios, regional owners need to compare data from their own region with other regions. By setting the filter default value to follow user attributes, data from the user's region can be highlighted by default.
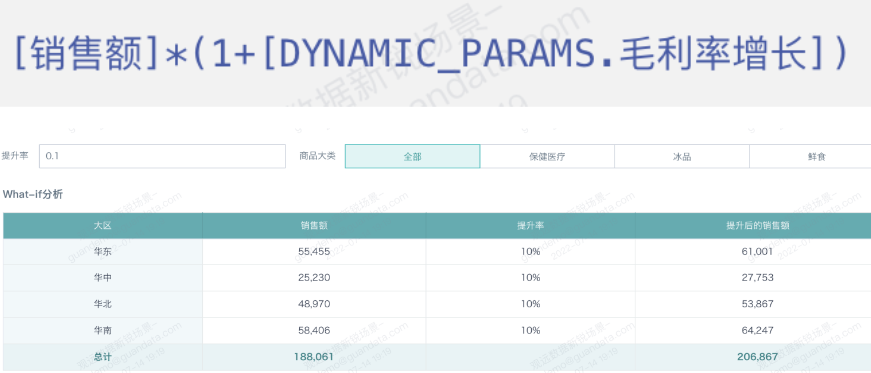
What-if Analysis
Sales What-if Analysis
Perform What-if analysis for a metric. You can enter any increase rate, and the table automatically calculates the post-increase value. For example, calculate increased sales based on the entered sales increase rate.
- Card field: Increase Rate. Field type: numeric.

- Card field: Sales After Increase. Field type: numeric.
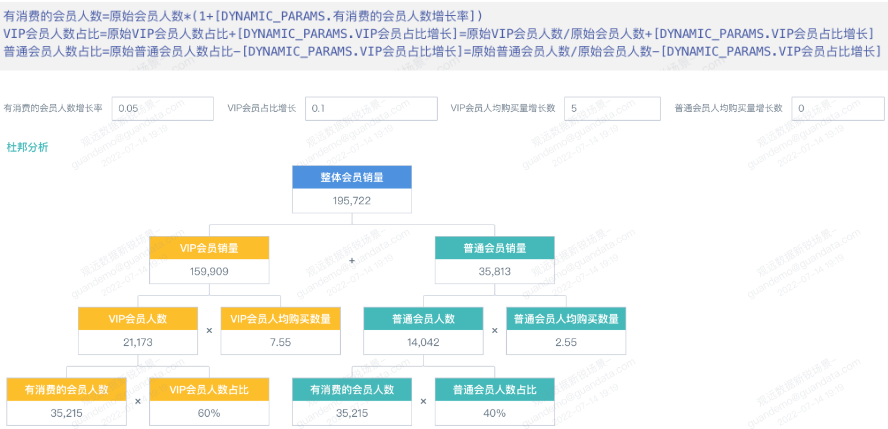
Implement Predictive DuPont Analysis
Combine What-if analysis with a DuPont analysis chart to break down metrics and predict metric changes by entering multiple variable values.
- First-level card metric: Overall Member Sales.

- Second-level card metrics: VIP Member Sales and Regular Member Sales.

- Third-level card metrics: VIP Member Count, Average Purchase Quantity per VIP Member, Regular Member Count, and Average Purchase Quantity per Regular Member.

Fourth-level card metrics: Number of Members with Purchases, VIP Member Count Ratio, and Regular Member Count Ratio.
Dynamic Reference Line Changes
Global parameters can implement dynamic reference line changes. A card displays data for a date range, and the reference line changes based on the card's date difference range. For example, if the selected time range is 10 days, the reference line value is 10. Approach: first obtain the filter range, then calculate the reference line value based on the range.
Calculate Dynamic Date Difference
The administrator creates two date global parameters: start time {{{today - 5 days}}} and end time {{{today}}}. The card references these two global parameters and creates a date difference field: datediff([DYNAMIC_PARAMS.结束日期],[DYNAMIC_PARAMS.开始日期]). The reference line also uses the date difference field.
For the reference line, use another field instead of a fixed value. Select the date difference field you just created and set the aggregation method to maximum.
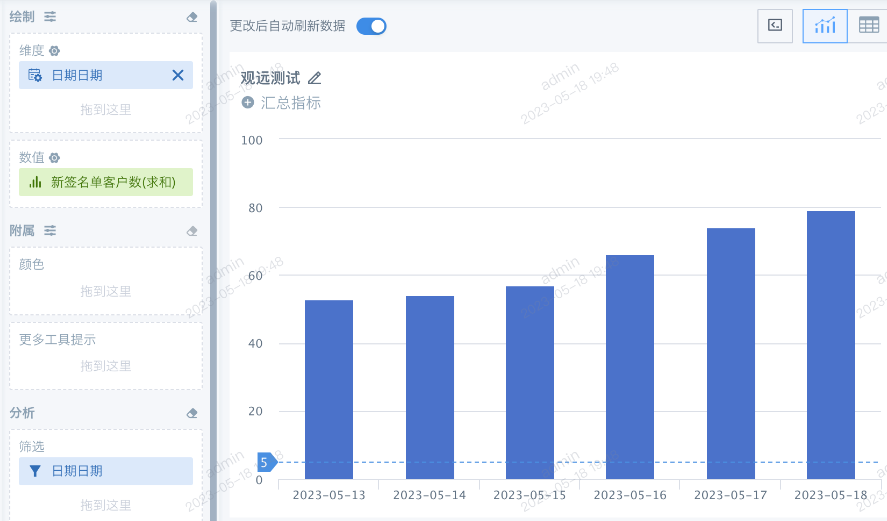
Dynamically Display Dates in the Card
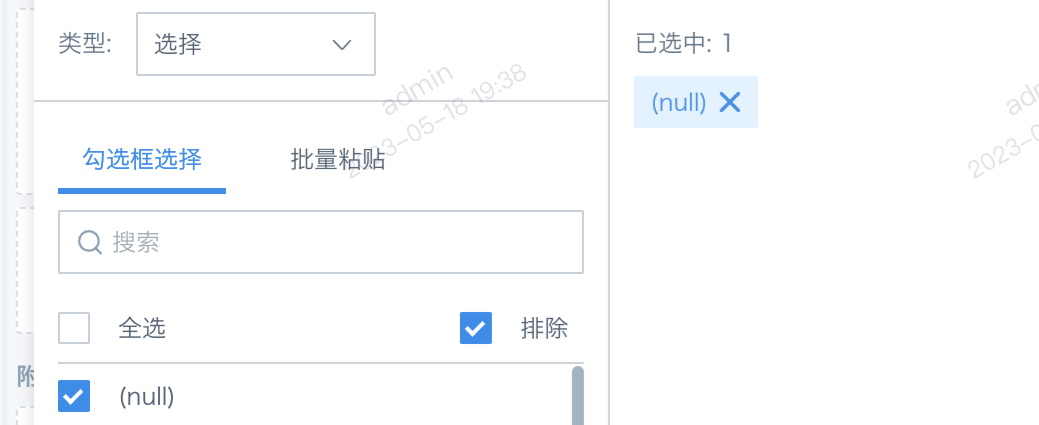
Create a date field: if([新日期]>=[DYNAMIC_PARAMS.开始日期] and [新日期]<=[DYNAMIC_PARAMS.结束日期],[新日期],null). Only display data that belongs to the interval between the two date parameters. Place the new date field in the dimension field well, and display only values with dates in the filter field well to exclude null. At this point, the card's internal configuration is complete.
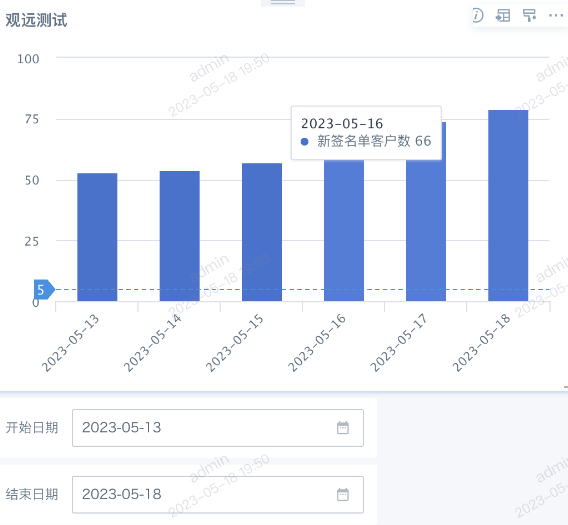
Link Filters with Cards to Implement Dynamic Changes
Global parameters used in cards use default values. Filters and cards must be linked to pass dynamic parameters. Create two parameter filters: Start Date and End Date. Do not use a date range filter or selection filter. The result is shown below. The card displays values between the start date and end date, and the reference line displays the difference between the two dates.
Operation Guide
- In Admin Settings > Resource Settings > Global Parameters, set the global parameters required by the current enterprise domain. This operation requires system administrator permissions.
- Use parameters to create calculated fields in cards based on Guan-Index datasets, or use parameters in SQL for direct database datasets or view datasets and then create cards.
- Create parameter filters on the page. Parameter filters automatically link to the cards created in step 2.
- Click Guandata Help Center to view the steps for using global parameters.
- Visit Atlas Cloud App Marketplace to try view dataset cases and other product feature cases immediately.