Ranking Functions and Applications
Feature Introduction
Advanced calculation in Guandata BI visualization charts integrates the Rank feature. You can specify the calculation dimension, ranking method, and display top N to easily create the ranking reports you need. For details, see Rank.
The differences between the three ranking types are as follows:
Row/column ranking: no grouping. Performs global ranking by row or by column.
Ranking within dimension groups: available only when multiple dimension fields exist. Performs ranking within groups after grouping by specified dimension fields.
Dimension item ranking: ranks by the aggregated result of a specified dimension. In this case, Calculation Dimension can select fields in the dimension area or comparison fields.
However, in some complex scenarios, ranking needs to be used for filtering, or ranking information needs to be used for secondary calculation. The system's built-in ranking feature may not meet these needs. In such cases, Guandata BI also supports using ranking functions in window functions to calculate ranks. The following introduces common ranking functions and usage scenarios.
Common Ranking Functions
| Function | Meaning | Window Example |
|---|---|---|
| rank | Allows ties and leaves gaps. When the same rank appears, the next rank skips the duplicated rank. The ranking structure is generally: 1, 2, 2, 4, 5, 5, 7... | rank( ) over(partition by [Group Field] order by [Sort Field]) -- ascending ranking after grouping |
| dense_rank | Allows ties and does not leave gaps. When the same rank appears, the next rank does not skip. The ranking structure is generally: 1, 2, 2, 3, 4, 4, 5... | dense_rank( ) over(partition by [Group Field] order by [Sort Field] desc) -- descending ranking after grouping |
| row_number | Sorts sequentially with no ties. The ranking structure is: 1, 2, 3, 4, 5, 6, 7... | row_number( ) over(partition by 1 order by [Sort Field]) -- global ascending ranking |
Case Sharing
Scenario
When analyzing a multi-line chart, too many dimensions can create a hard-to-read spaghetti chart. Therefore, Top N filtering on dimensions is often needed. In the example below, the horizontal axis is the date dimension, comparison is by Province, and the monthly trend of Sales Amount for each Province is analyzed. When there are many provinces, only the Top N provinces by total Sales Amount within the chart time range should be displayed.
Solution 1
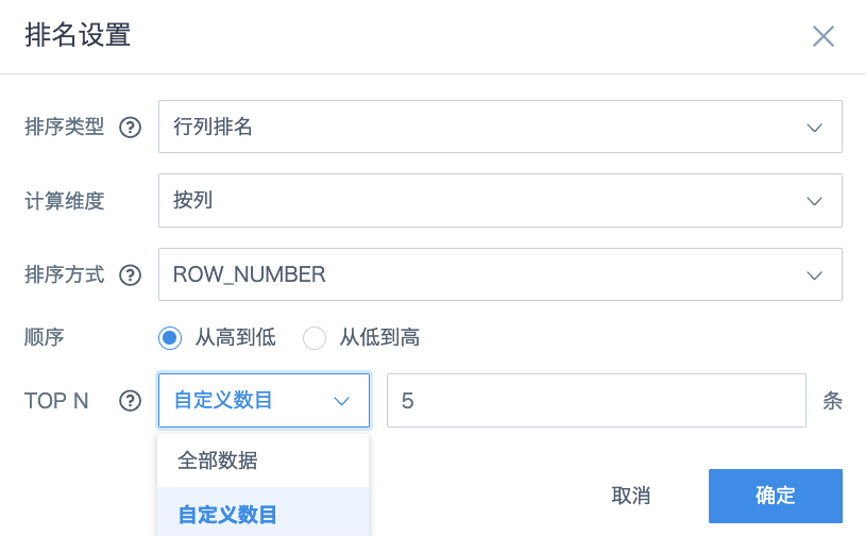
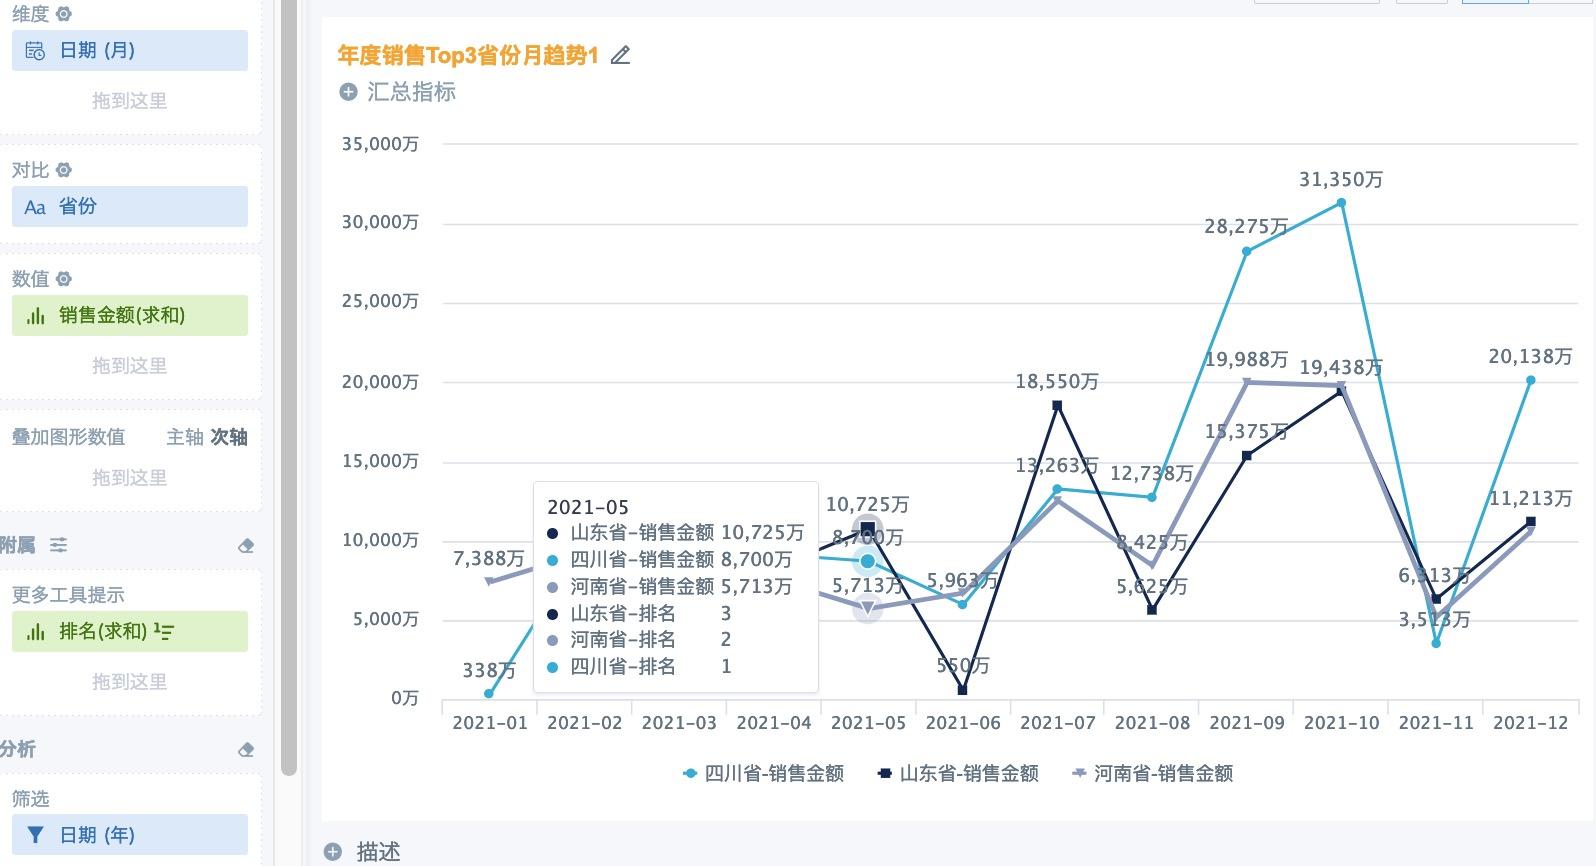
Create a multi-line chart and drag the required fields into the dimension, comparison, and value areas. At this point, there may be many messy lines. Drag the Sales Amount field used in the value area into More Tooltips as well, keep the default aggregation method as Sum, click Advanced Calculation > Rank, configure it as shown below, confirm and save, and then rename the field.
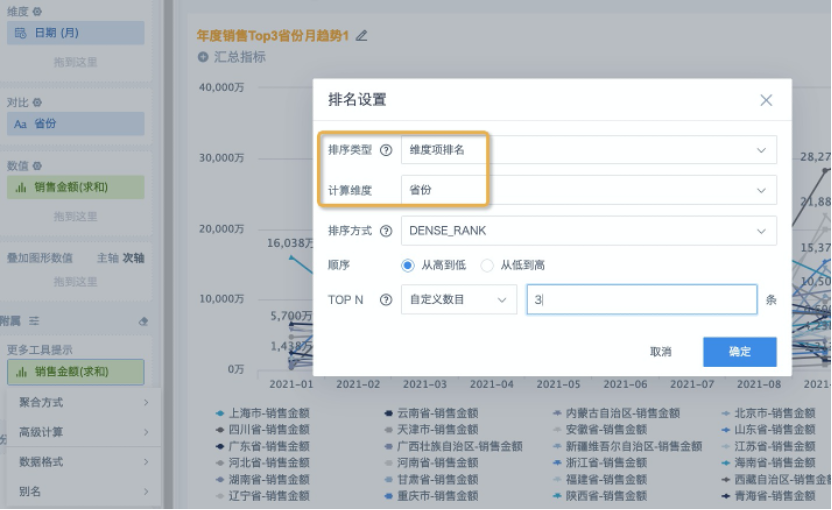
Because ranking is based on the total value of Province, and the Province field is a comparison item, the ranking type should be Dimension Item Ranking.
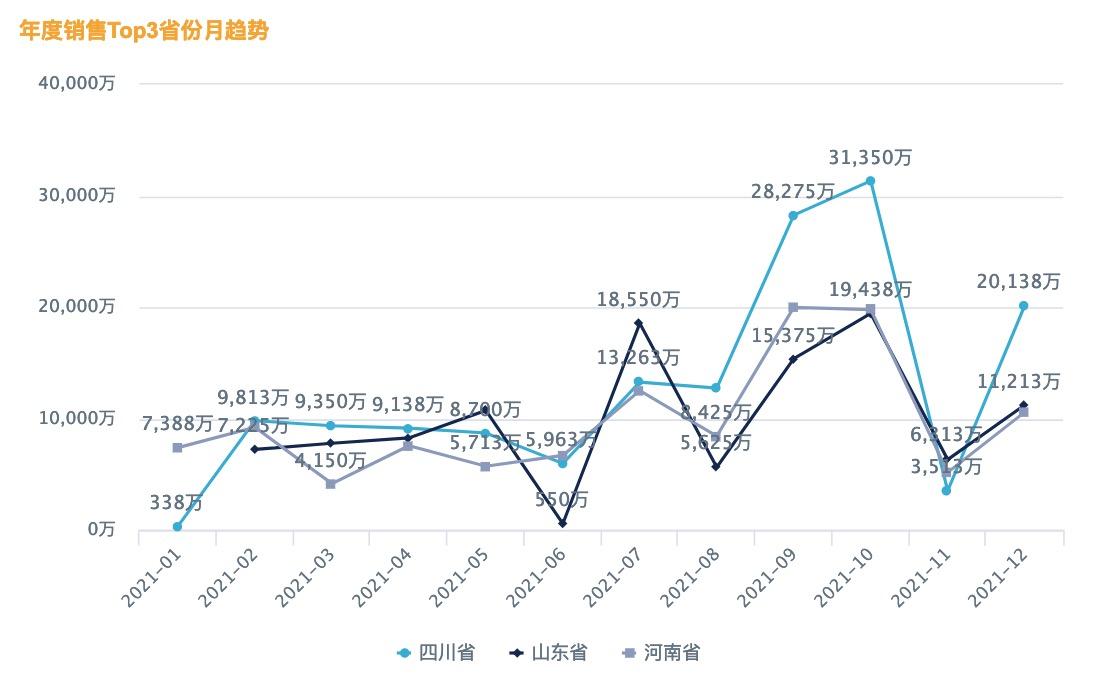
The effect is shown below. When the cursor hovers over the chart, ranking information is displayed in the tooltip.
Solution 2
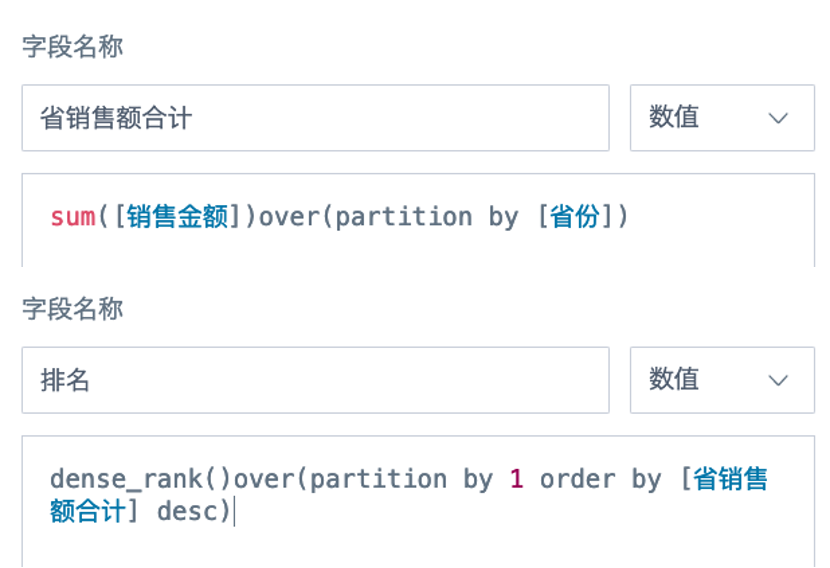
1. Create two calculated fields in the card:
Province Sales Amount Total: sum([Sales Amount]) over(partition by [Province])
Rank: dense_rank() over(partition by 1 order by [Province Sales Amount Total] desc)
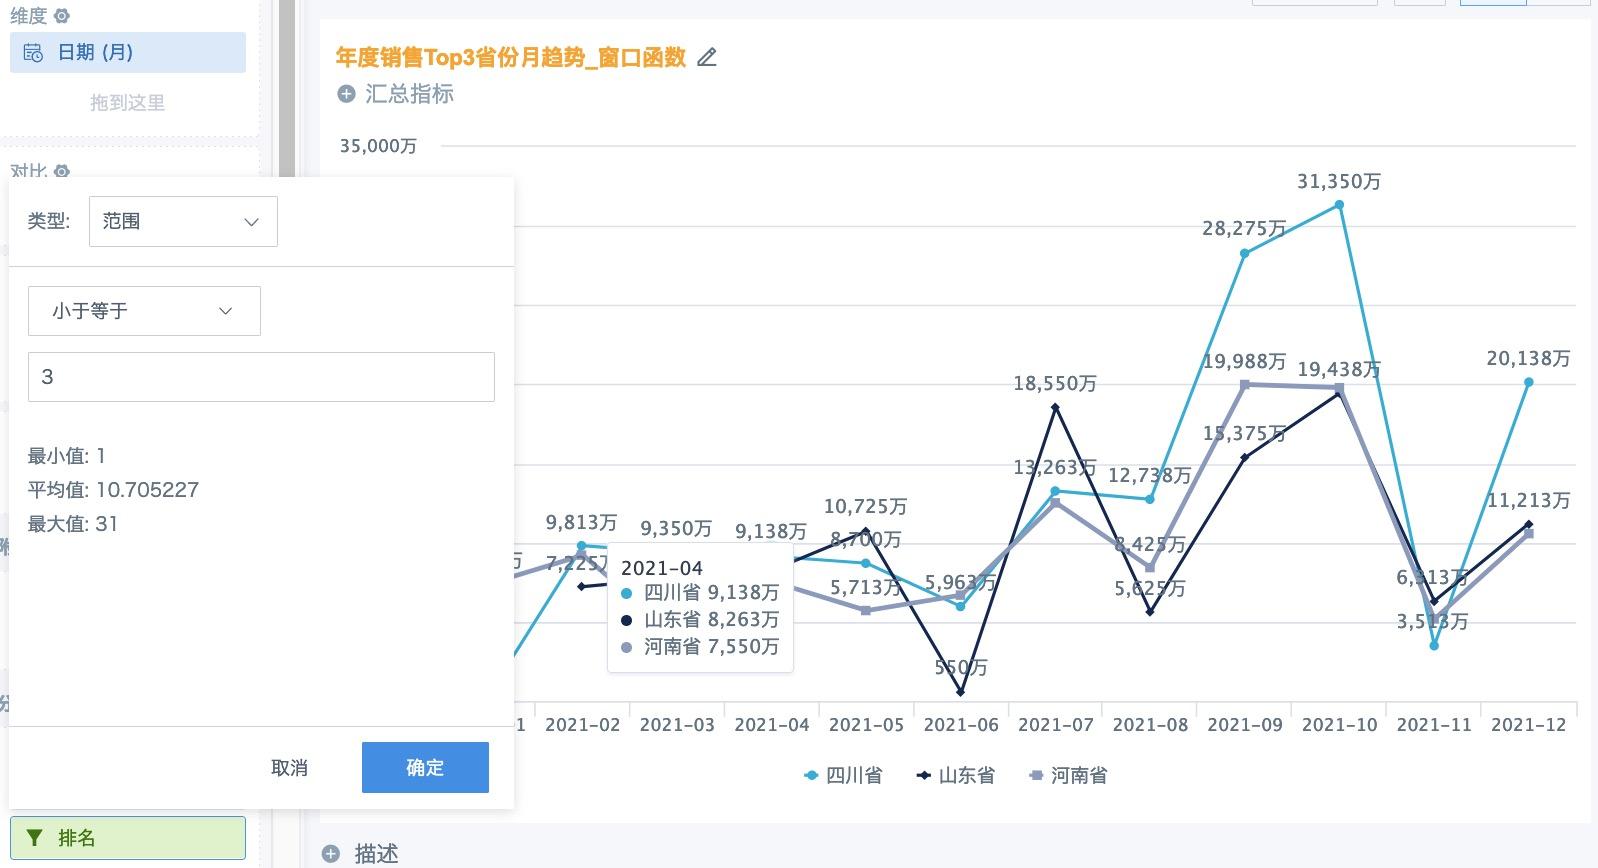
2. Drag Rank into the filter area and set the range to less than or equal to 3. The final display effects of the two solutions are basically the same, with only slight differences in tooltip and legend display.
Extended Case
Calculate cumulative sales share of product subcategories by sales ranking. For details, see Calculate Cumulative Sales Share of Product Subcategories by Sales Ranking.
Notes
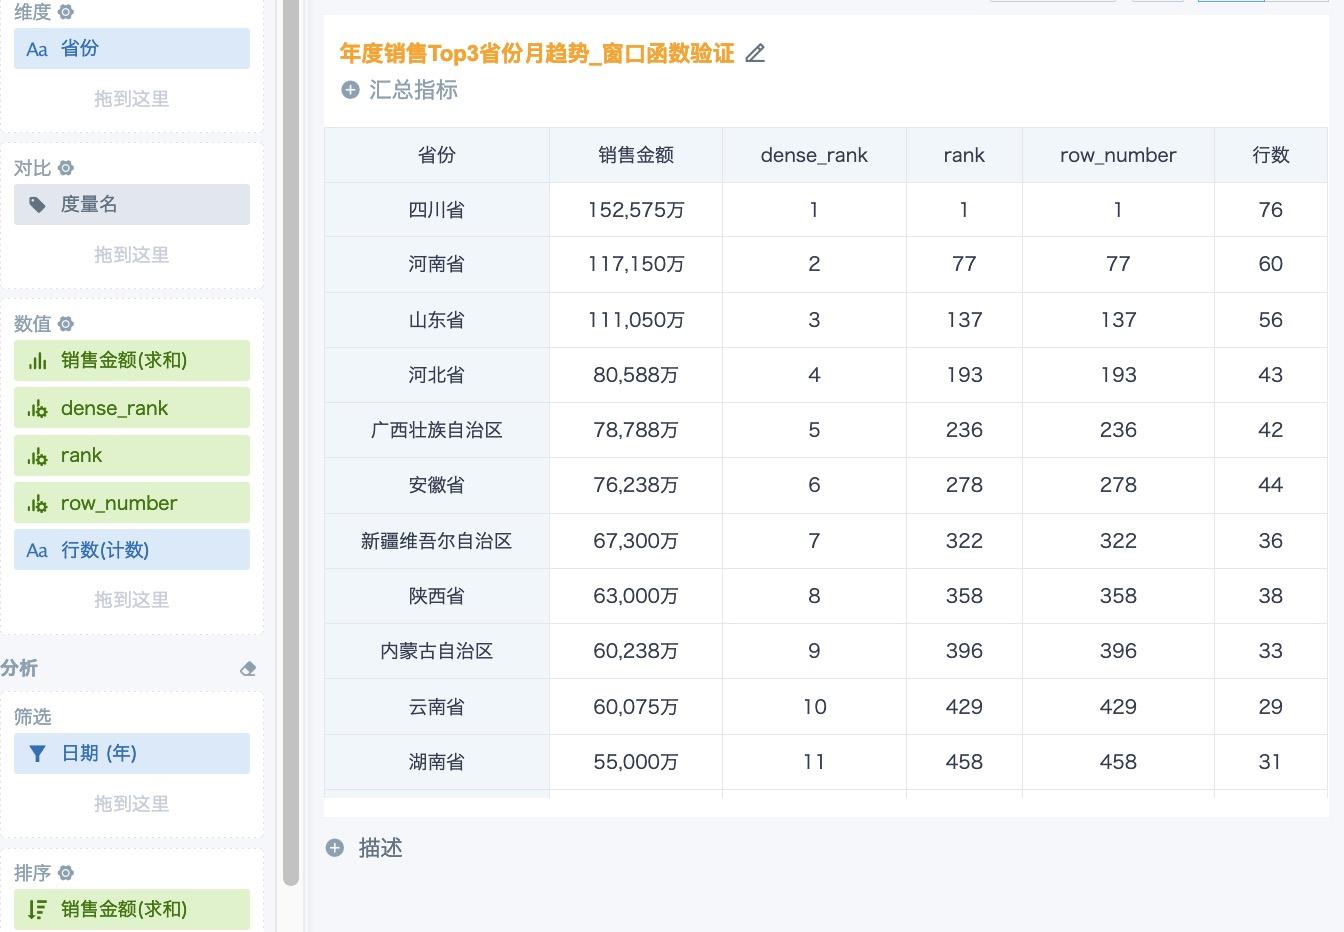
The system's built-in ranking feature first aggregates data to the minimum row count and then sorts it, so you can choose rank, dense_rank, or row_number as needed. However, window functions sort on the original dataset and do not aggregate a group into a single row. Therefore, in cards, we recommend using only dense_rank, because it allows ties and does not leave gaps.
The comparison of the window calculation results of the three functions in a card, with aggregation method set to No Processing, is shown below. You can see that the rankings of rank and row_number are affected by the original row count of the dataset, and the sorting results do not meet expectations. If you must use these two ranking logics, we recommend using the system's built-in ranking feature first. If it cannot meet your needs, aggregate the data to the required dimensions in ETL before using the corresponding window function.