Read-Only User Getting Started Guide
Overview
This document is a comprehensive getting started guide for read-only users of Guandata BI and helps you quickly understand the platform's core features and operations.
Applicable Users
- Read-only users who mainly view and analyze data.
- Typical roles include store managers, store staff, and business users who primarily consume data.
Registration and Login
Guandata BI supports two login methods. You can choose the one that fits your environment.
Manual Login
-
Open the platform page.
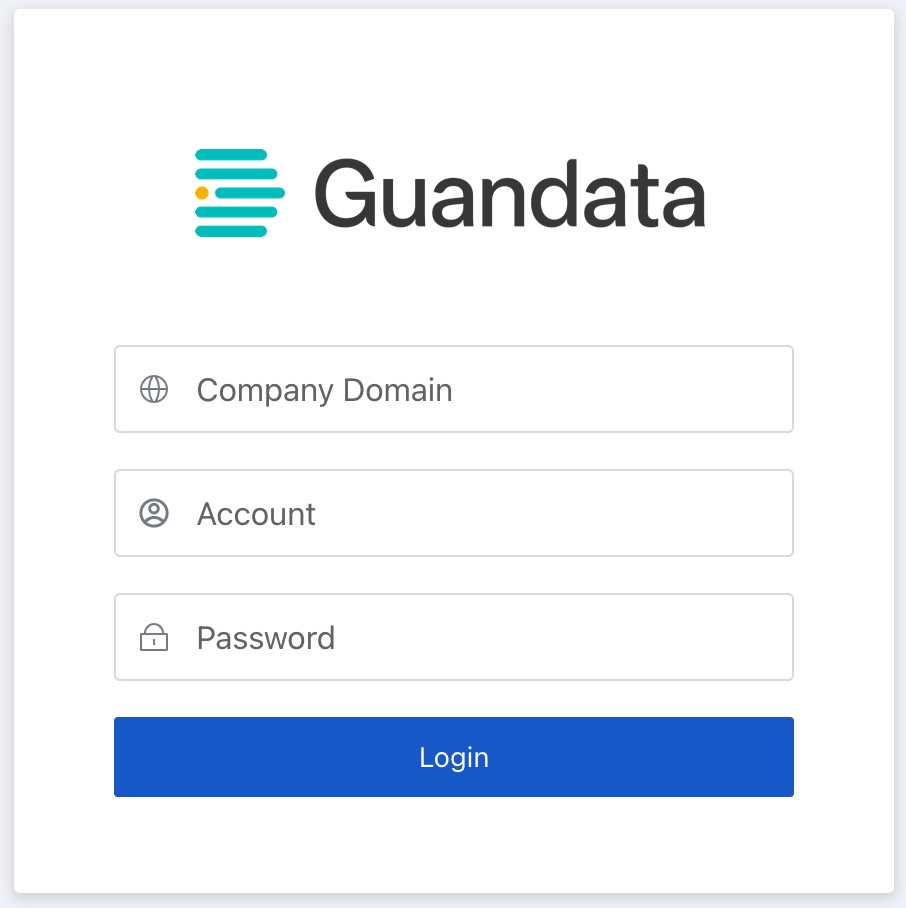
-
Enter your domain, account, and password on the login page, then click
Login.
In a single-domain environment, the domain field is not required.
Change Your Password
-
After logging in, click the user avatar in the upper-right corner and choose
Settings.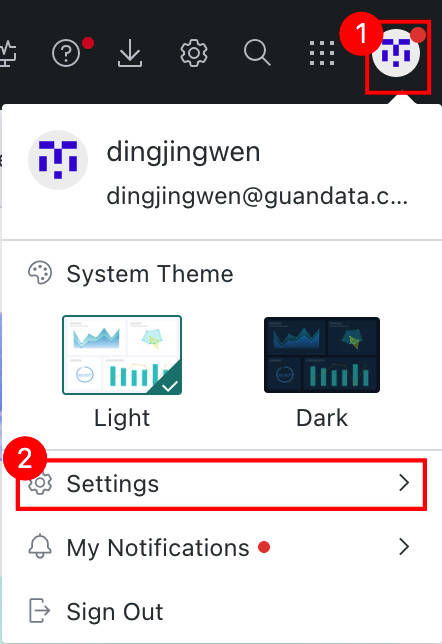
-
In the password section, click
Modify.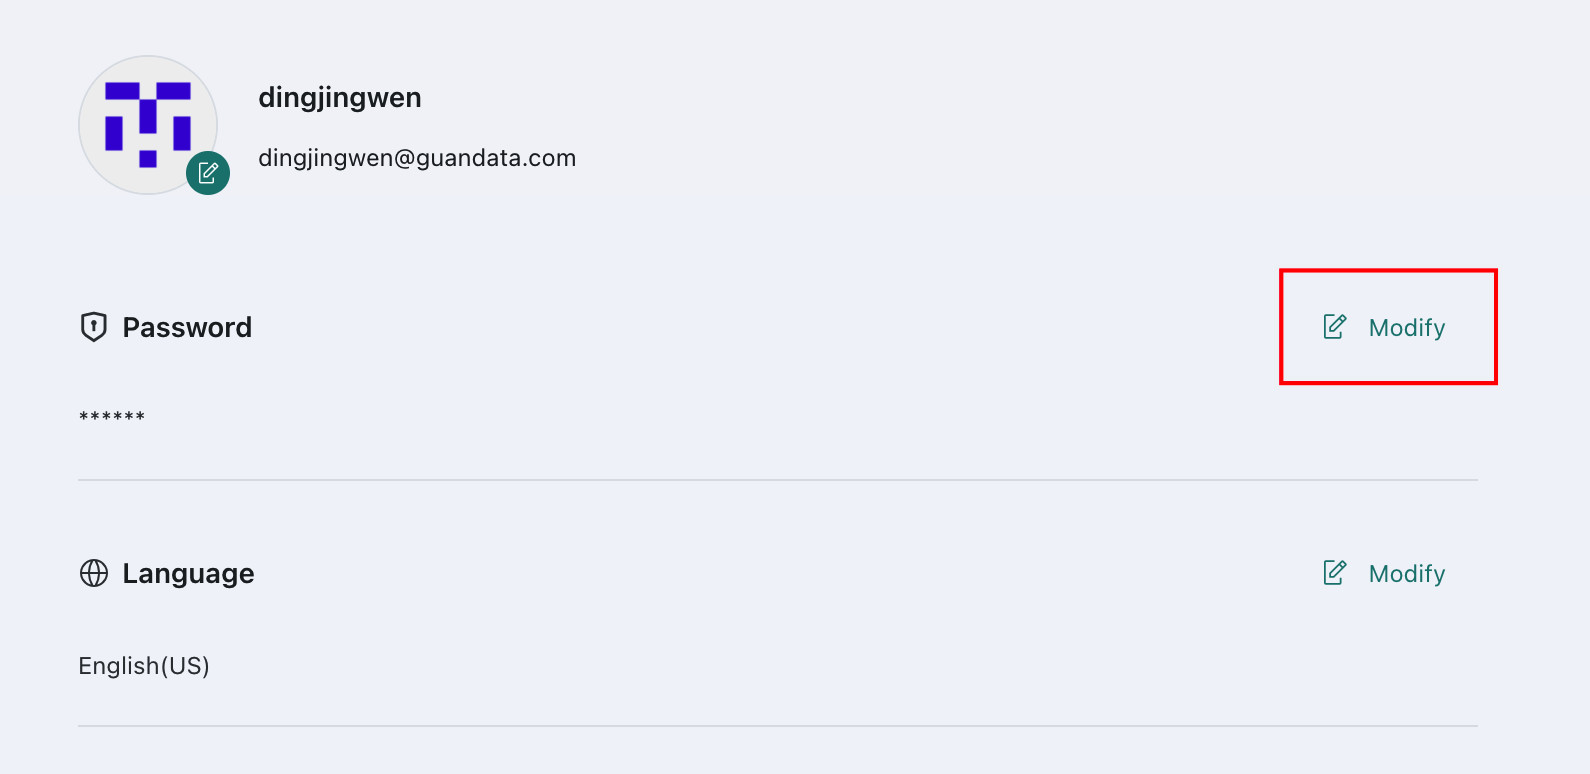
-
Enter the old password and the new password, then click
Save.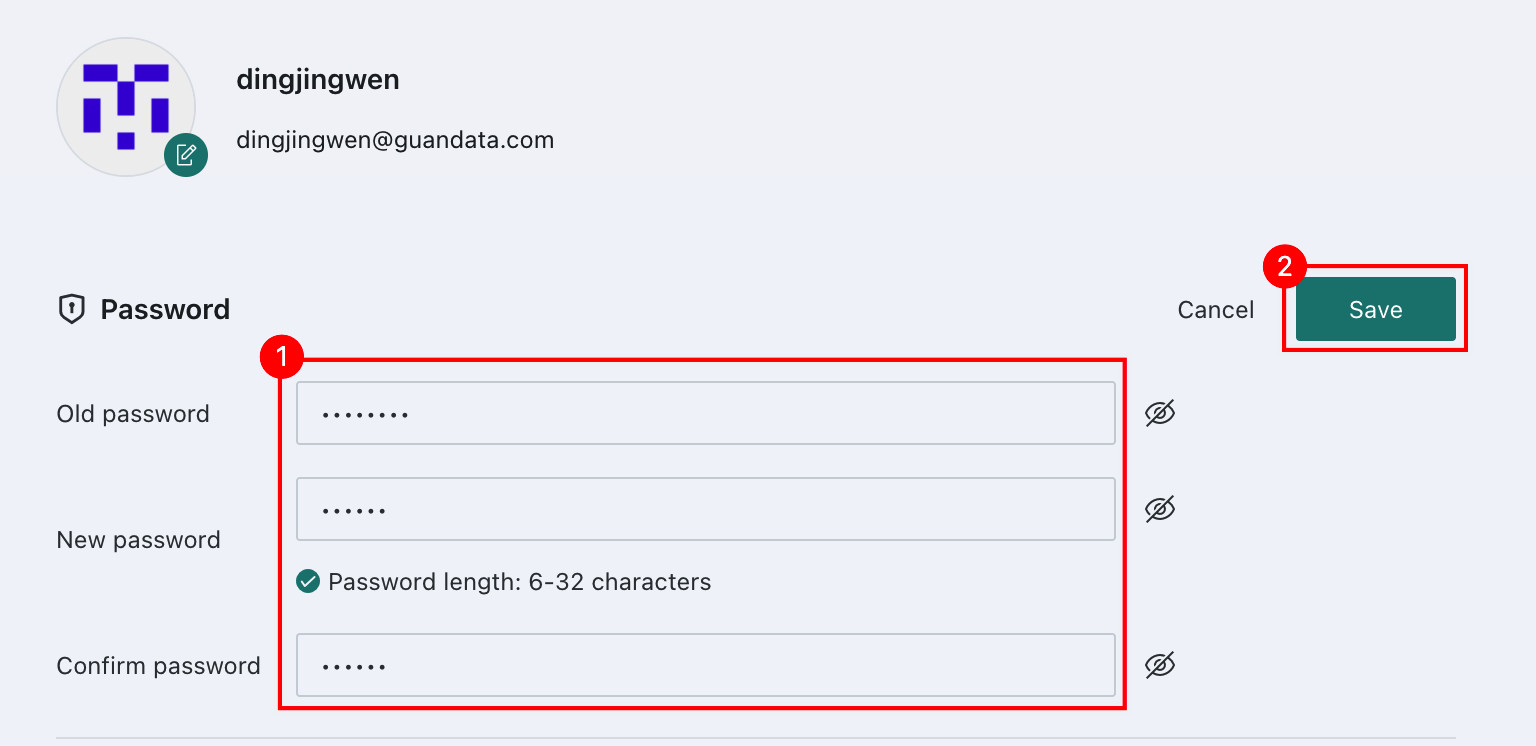
Reset Your Password
If you forget your password, you can reset it through the email recovery process.
-
Enter the domain on the login page and click
Forgot Password.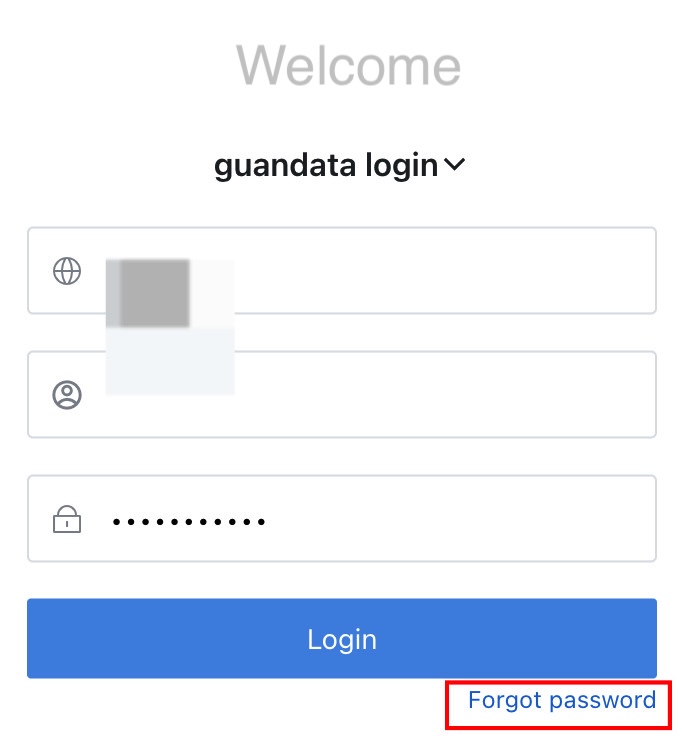
-
Enter the domain, account, and verification code, then click
Next. A verification email will be sent to your registered email address.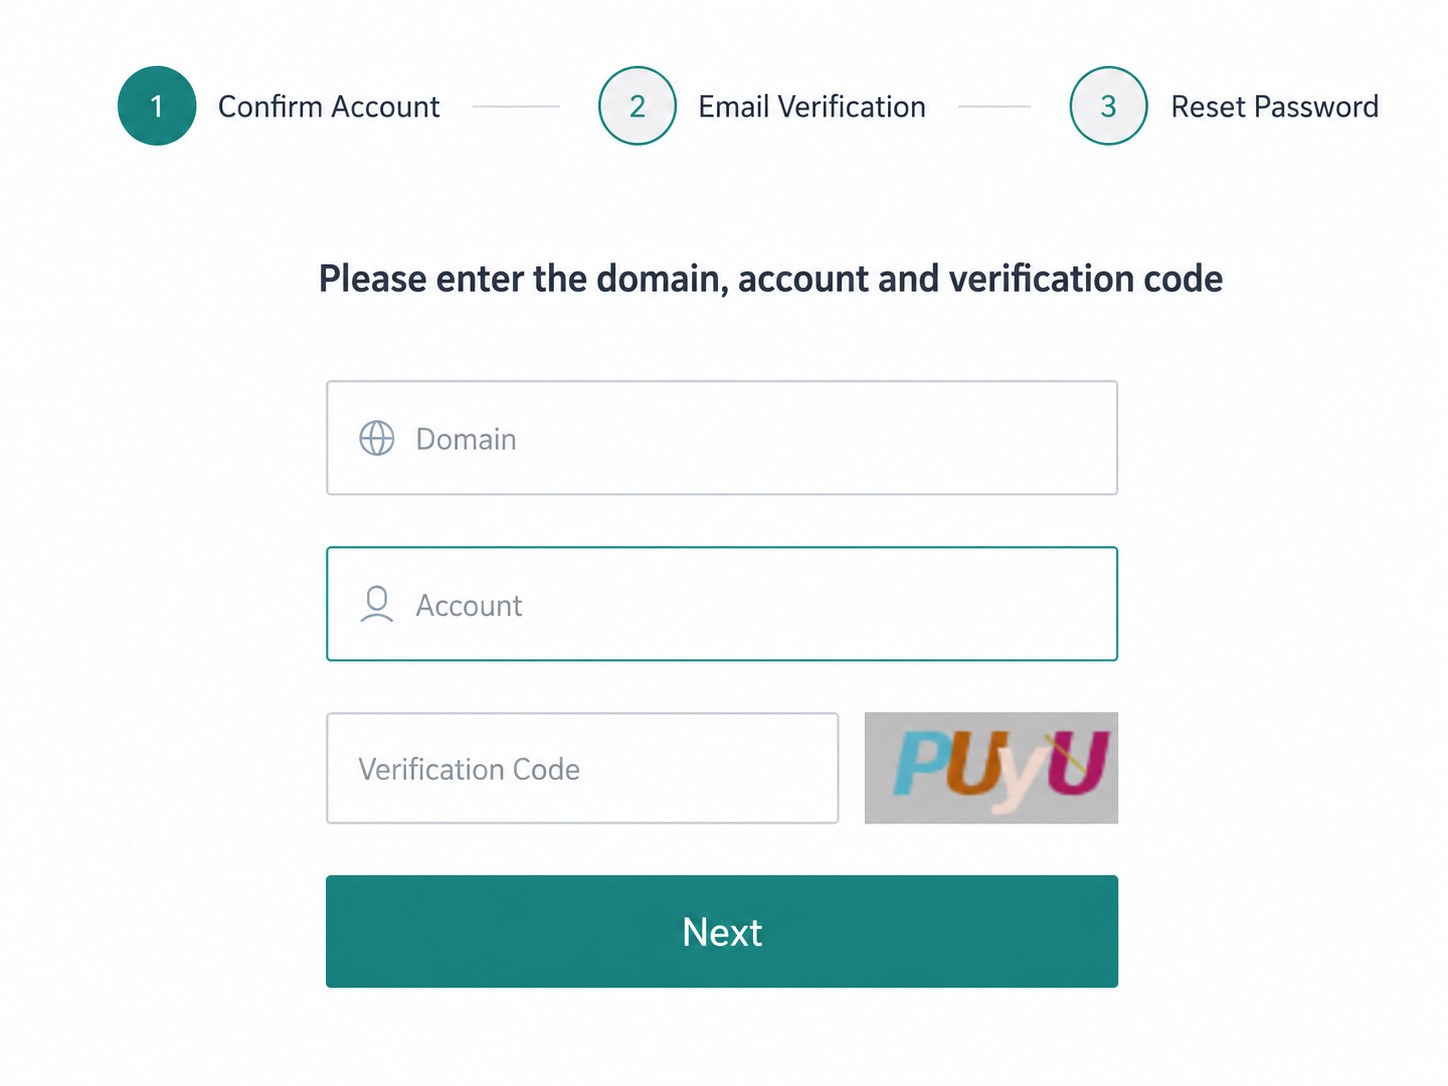
-
Open the email, retrieve the verification code within 60s, enter it, and click
Next.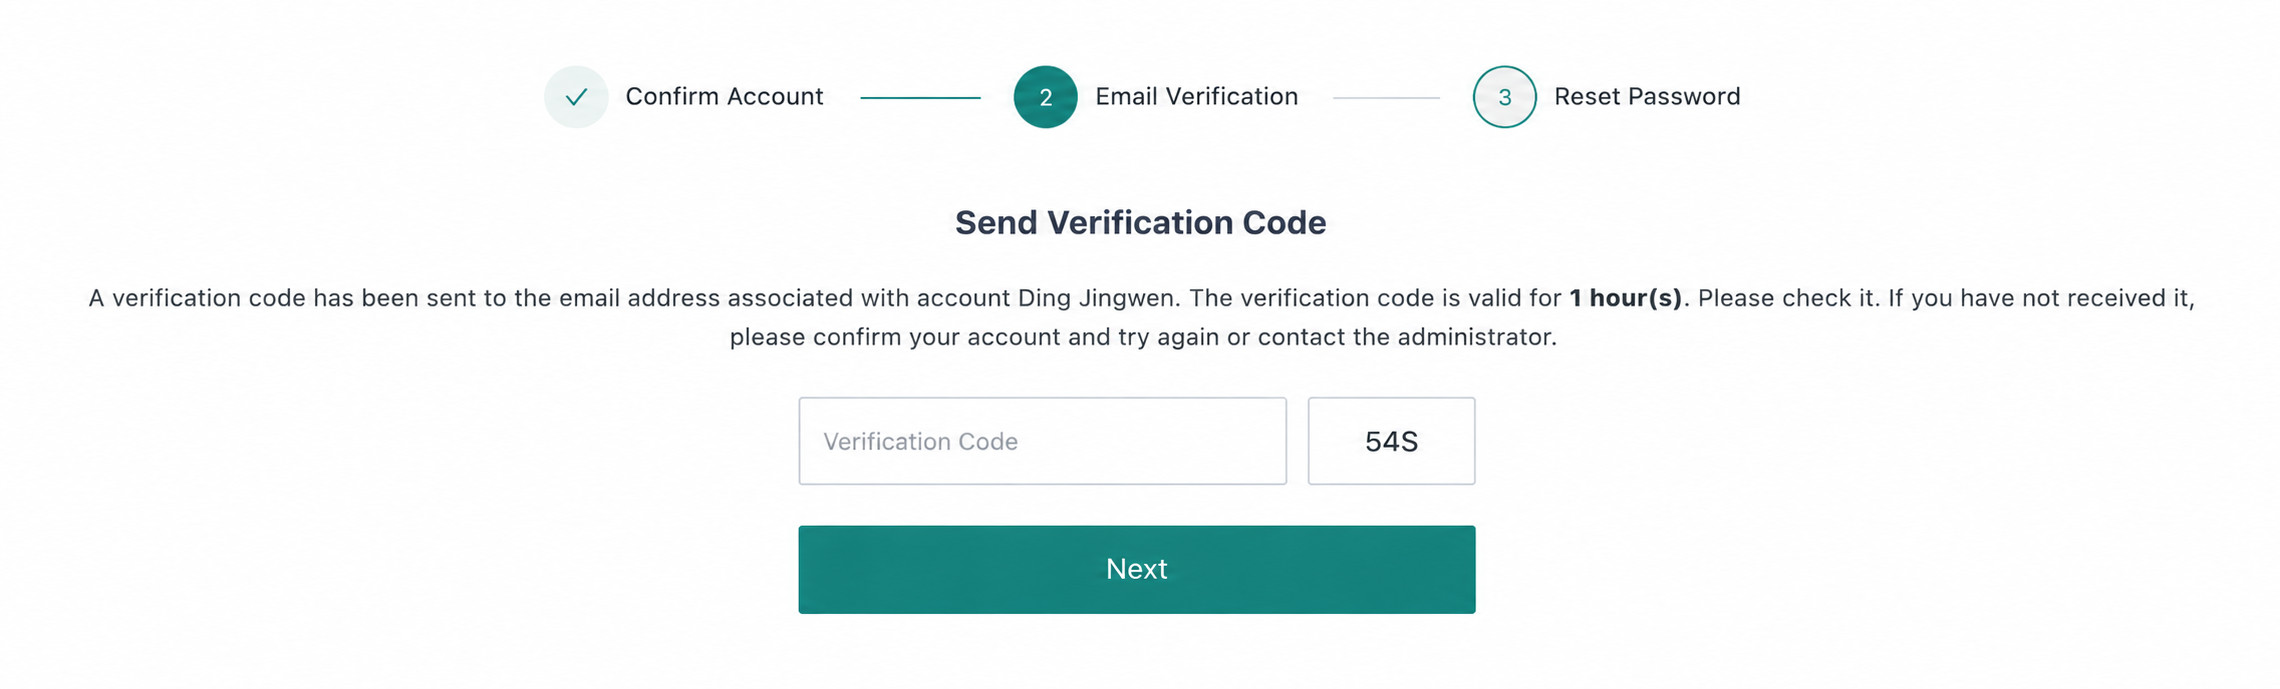
-
Enter and confirm the new password, then click
Confirm.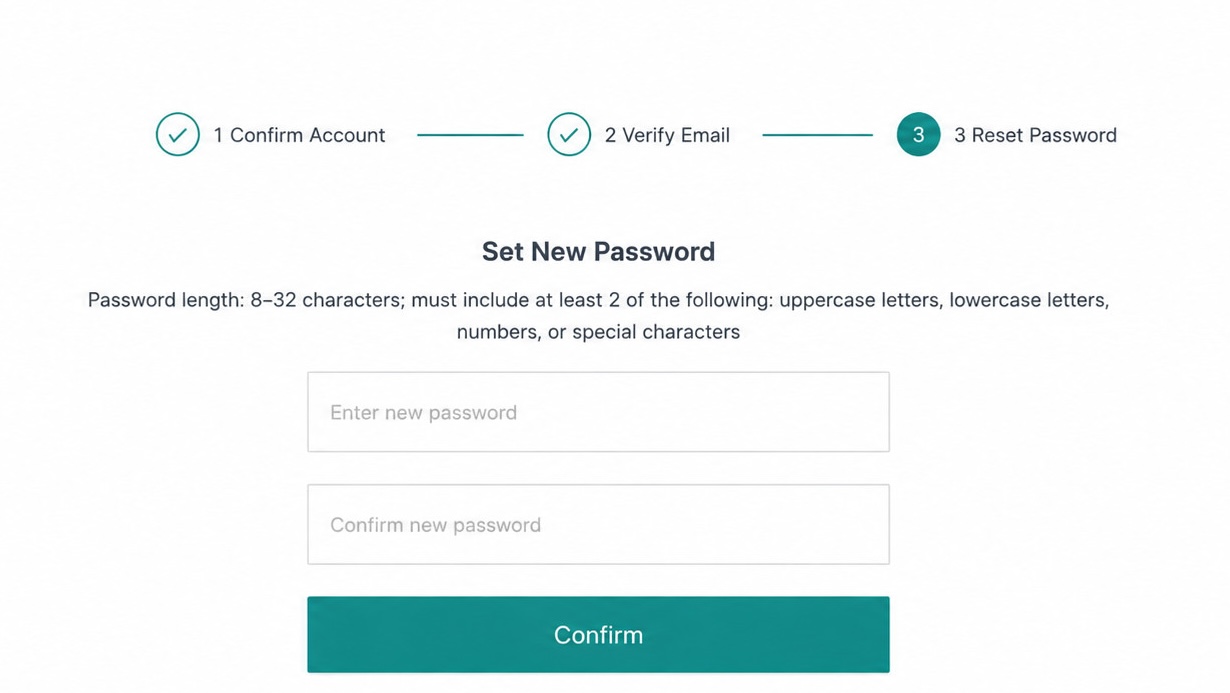
-
After reset, the system returns to the login page and you can sign in with the new password.
Self-Service Actions
View Data
Dashboard Pages
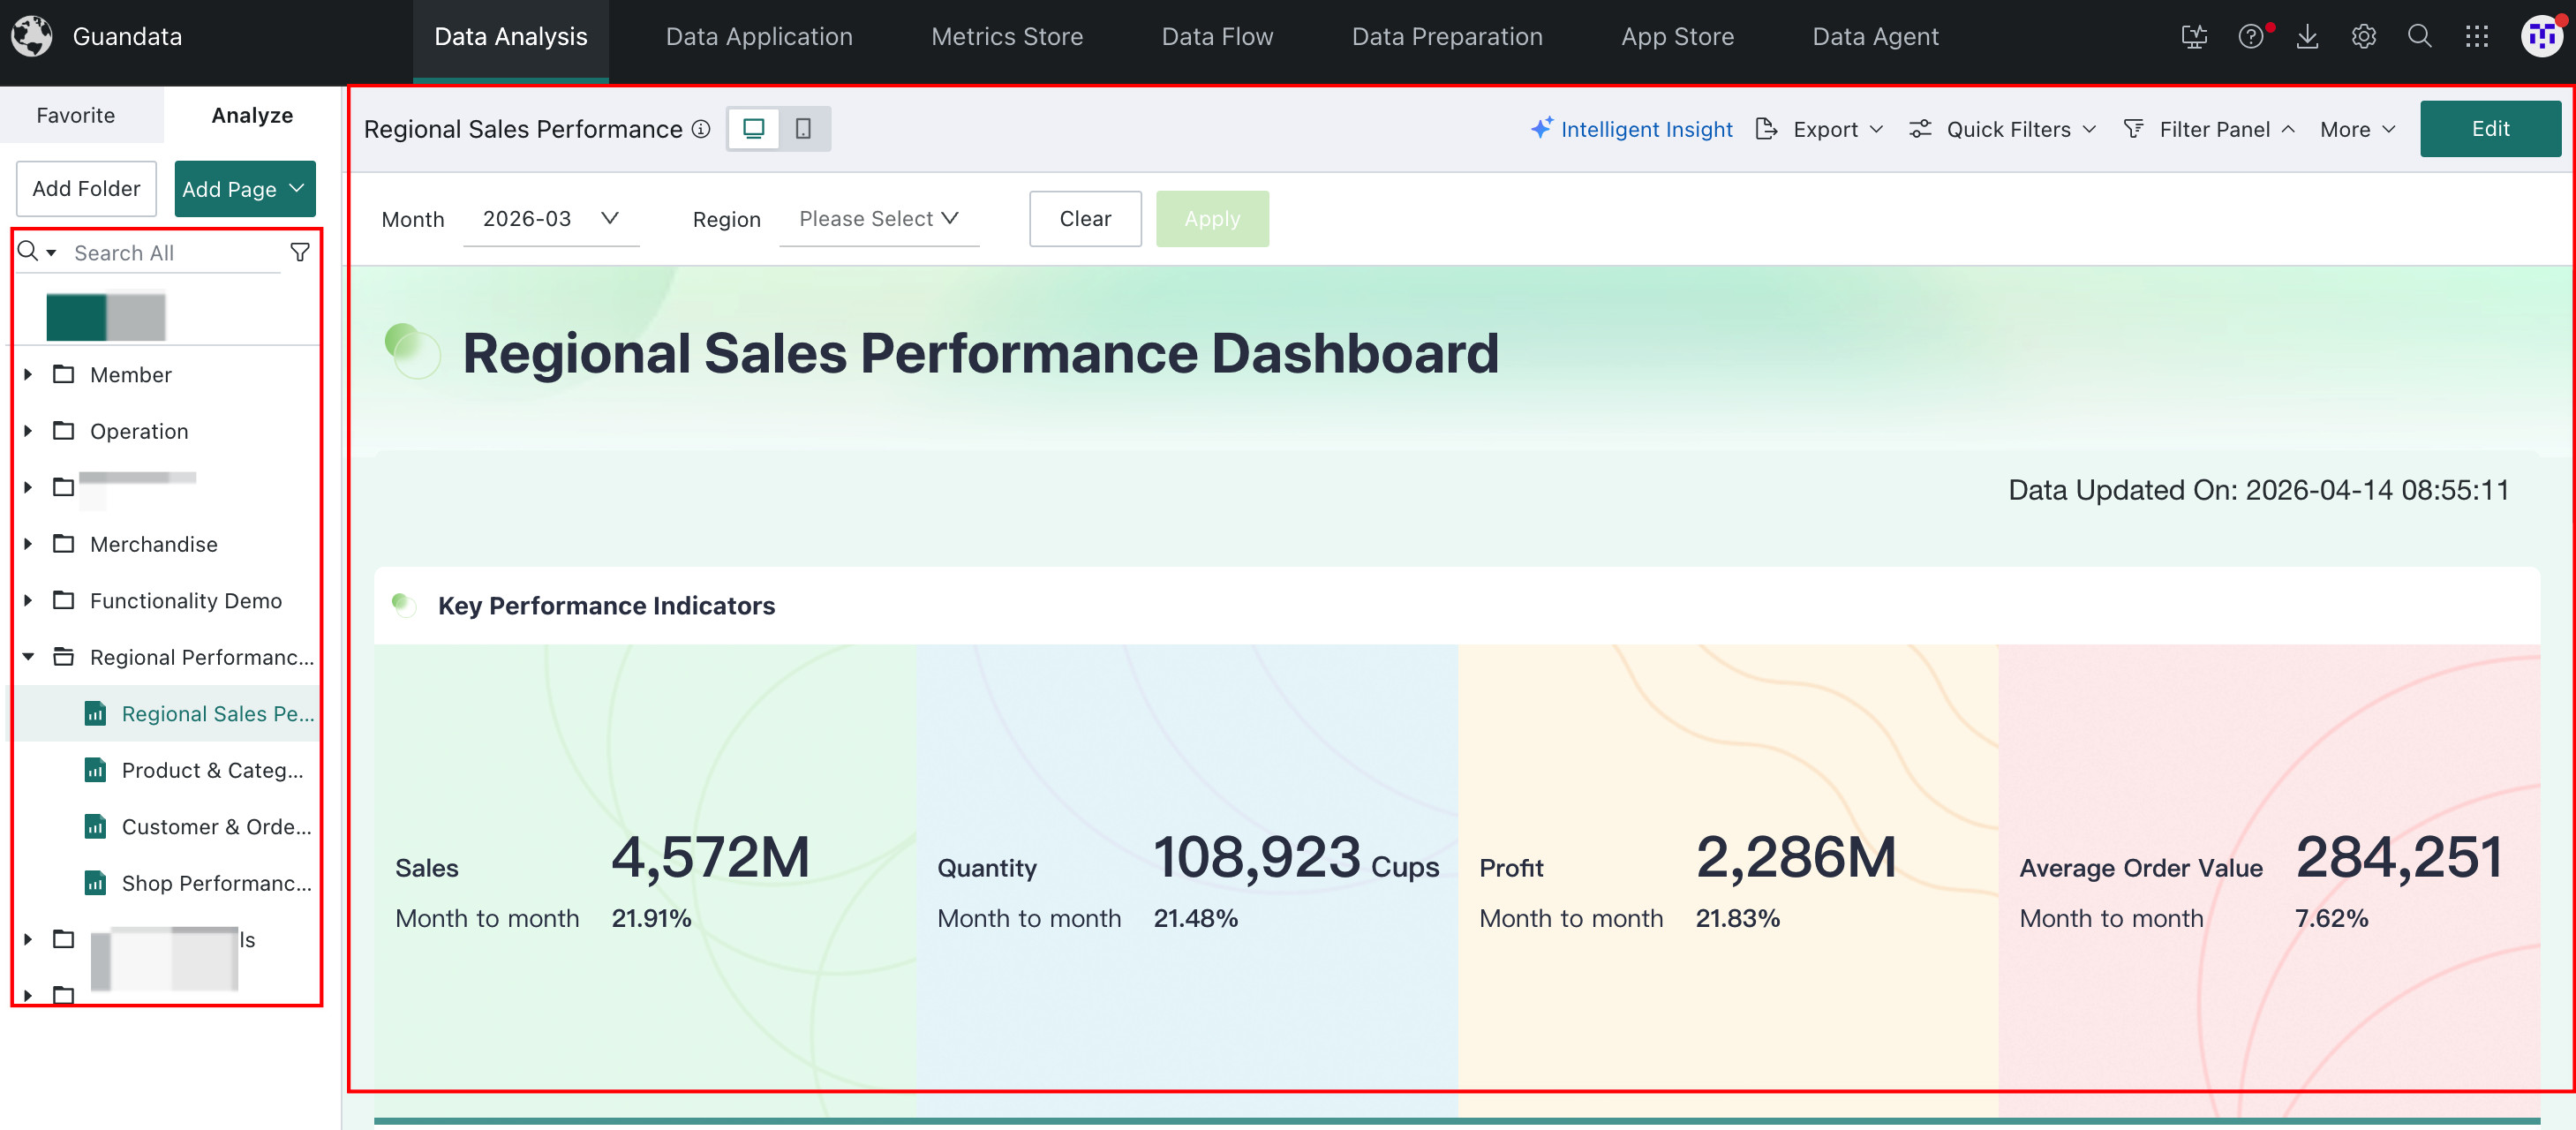
After logging in, you can browse or search Dashboards from the folder list on the left side of the Data Analysis page and open any Dashboard you are authorized to access.
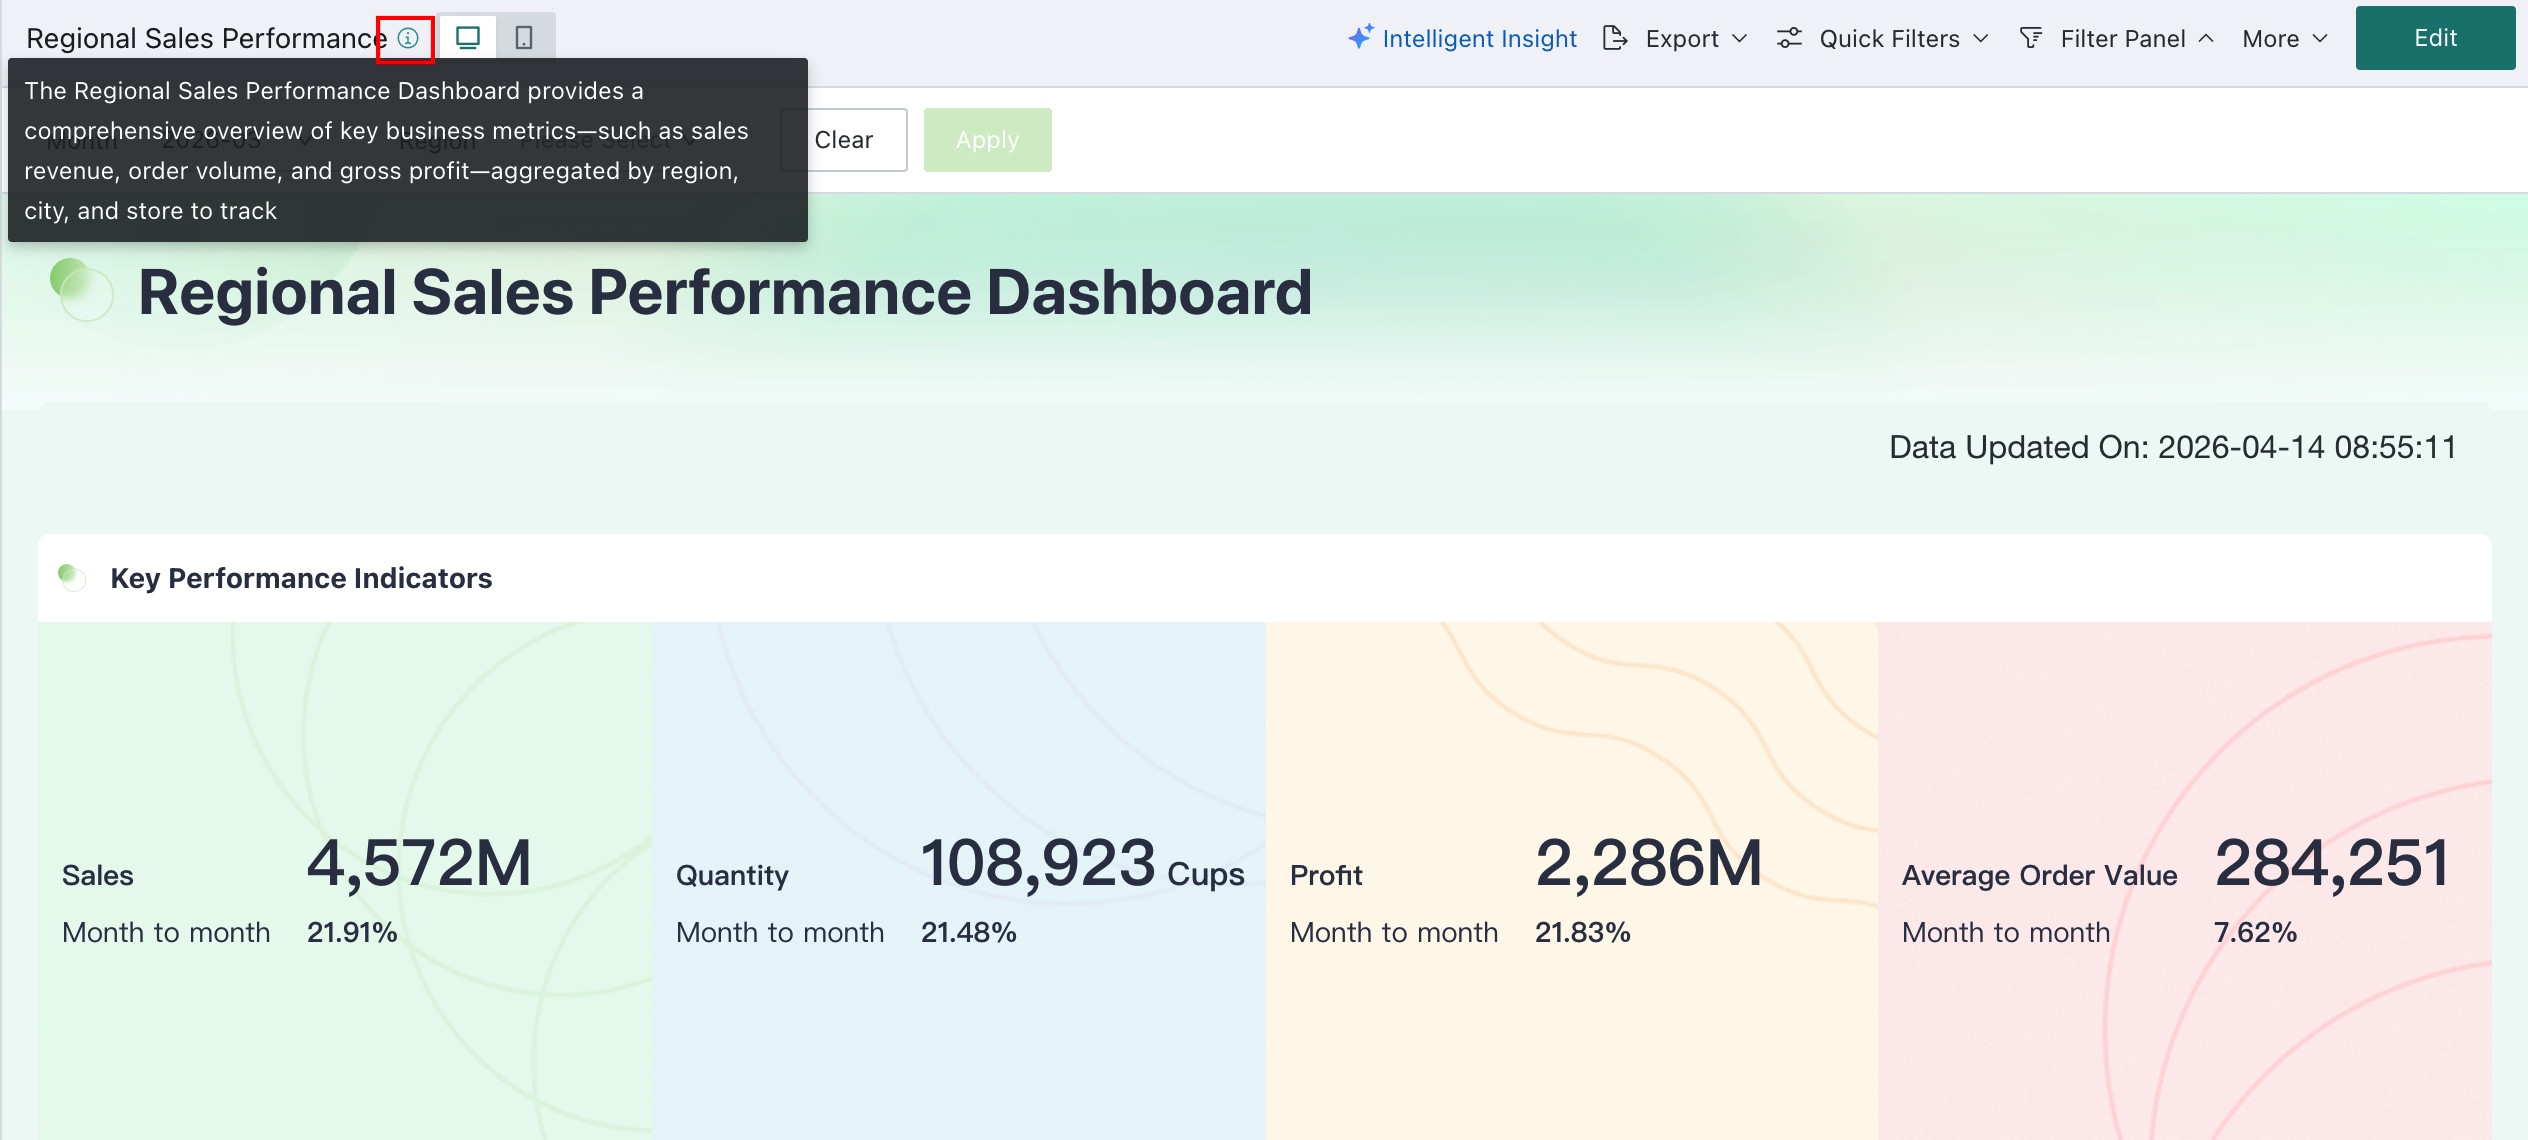
Tip Information
If a Dashboard creator added tip information, click the exclamation-mark icon in the upper-right corner of the Dashboard to view its description.
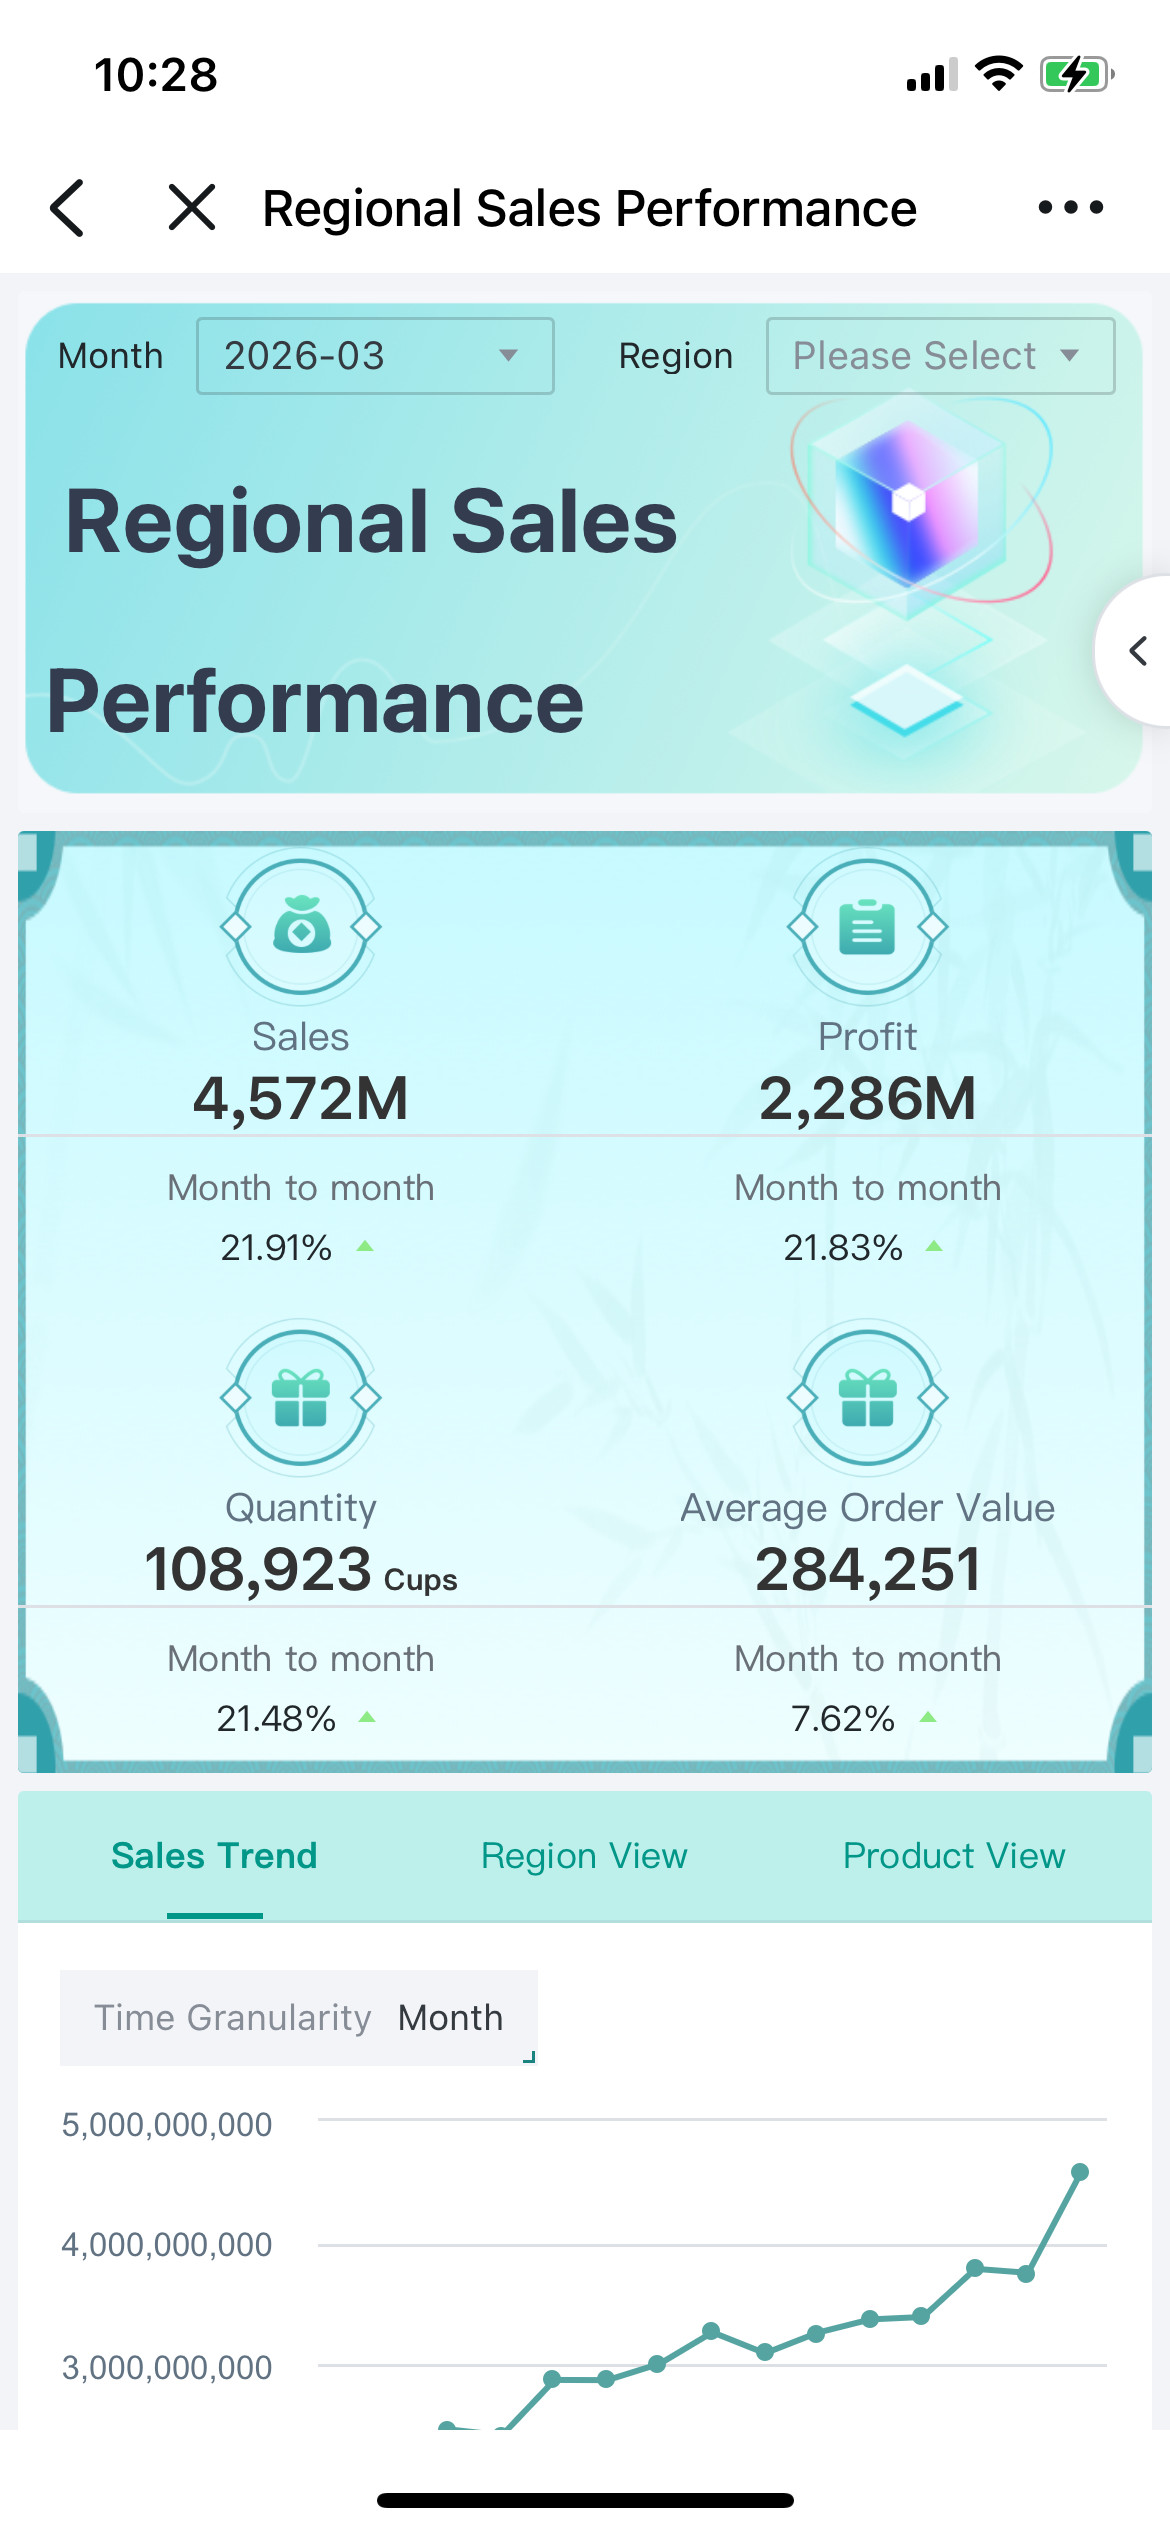
Mobile
If you are authorized, you can also open Guandata on your mobile device to view dashboards.
Data Visualization Wall
If you have permission to access Data Visualization Wall, you can either view them online in the platform or view them offline on a large display device.
Favorite Pages
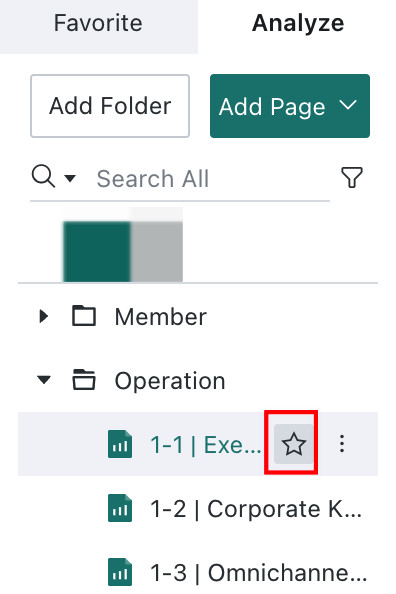
The platform provides a Favorites feature for quick access to important pages.
- On the left side of the Data Analysis page, open the
Favoritestab to see all favorited pages you can access. - Click
☆beside a file to add it to Favorites. - Click
★to remove it from Favorites.
Interactive Queries
Chart Interaction
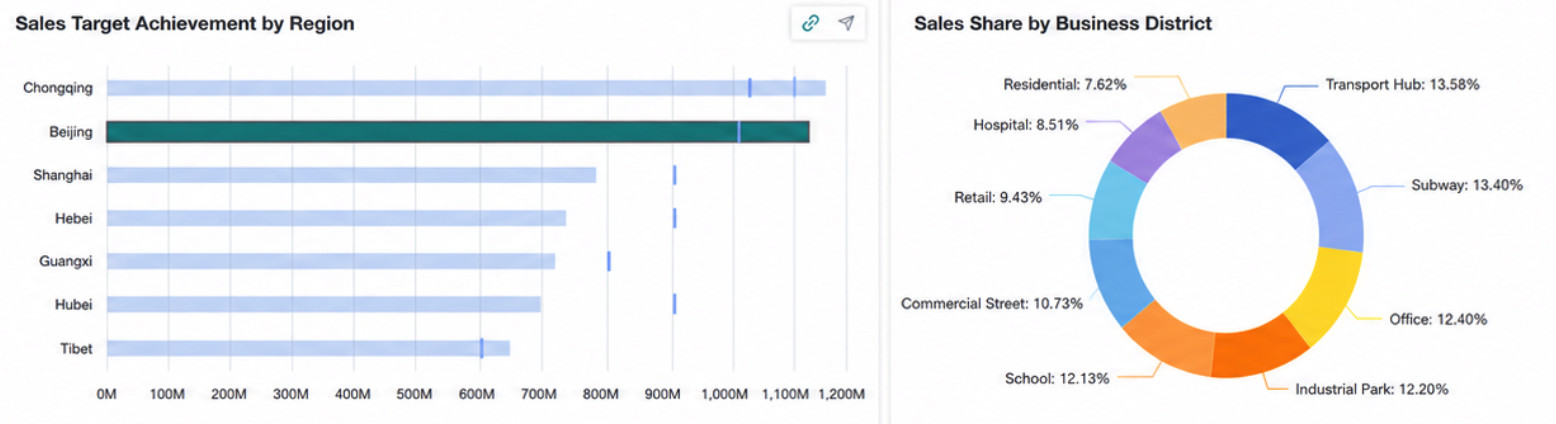
Chart interaction allows you to click the content of one Card and automatically filter or update related Cards on the page, making correlation analysis easier.
Supported chart types include all column charts, all bar charts, all line charts, single pie charts, tables, administrative maps, and heatmaps. More chart types are being added progressively.
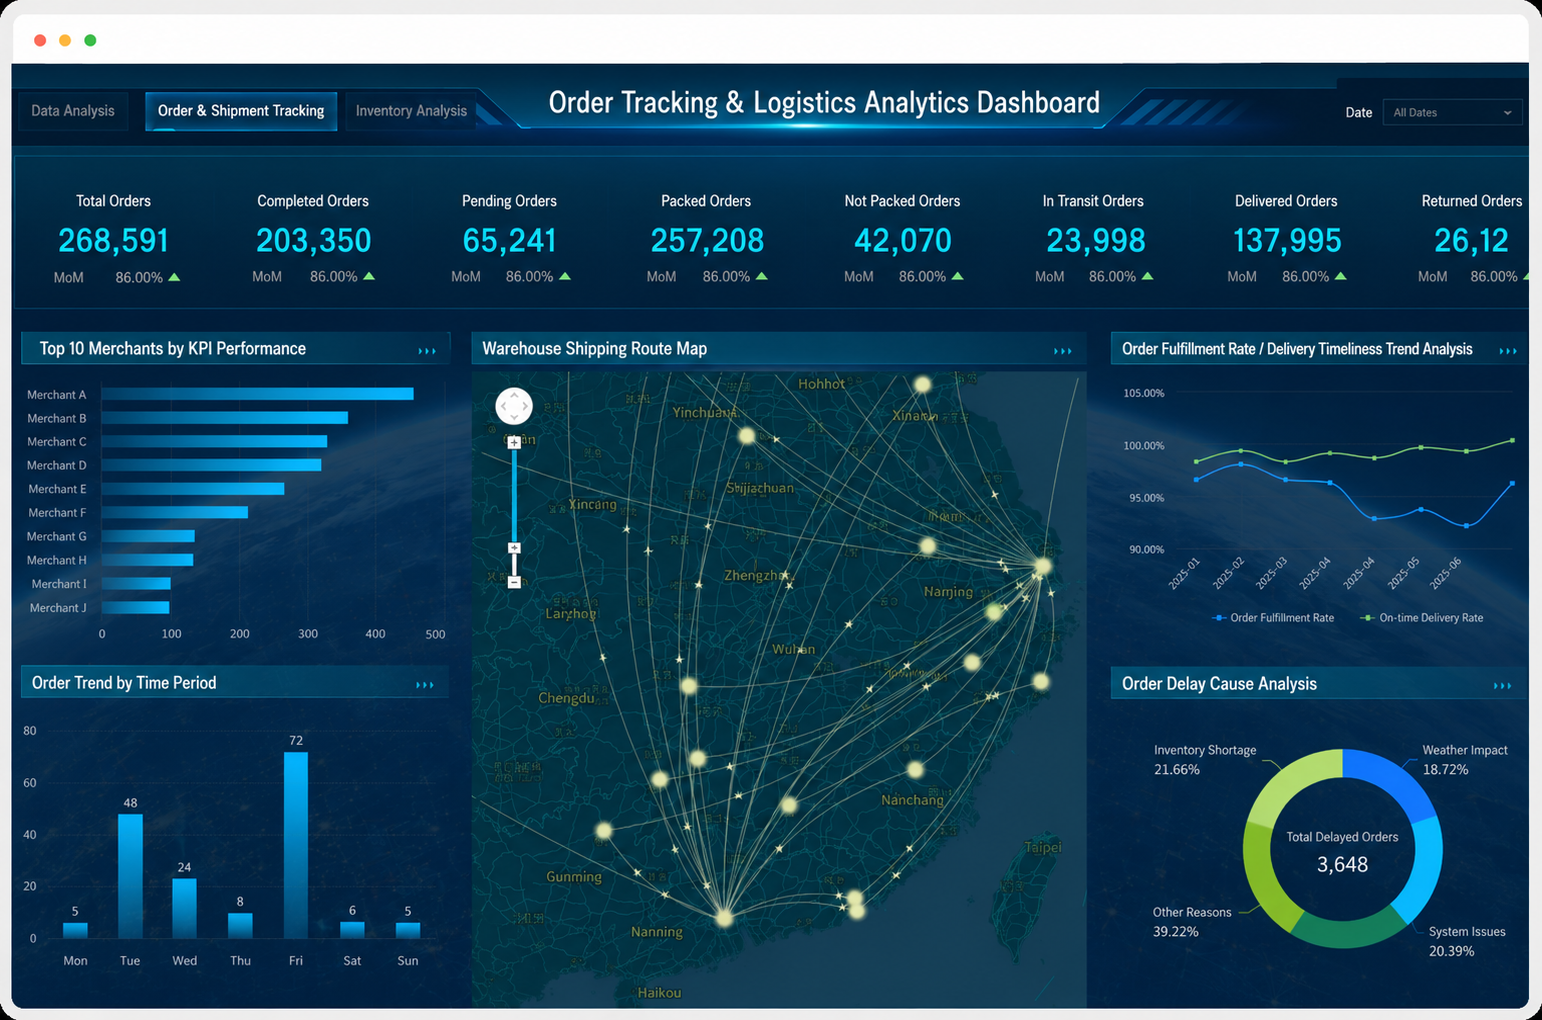
For example, In the sales dashboard, click the Beijing area, and the associated business district sales proportion chart on the right will automatically update to display data for Beijing.
Drill Down
Drill Down means analyzing data at increasingly detailed levels, such as from a month to daily data or from province to city to district.
If a Card has drill-down configured, click a bar, point, or other data mark to enter the next level.
Click the dimension label in the lower-left corner of the Card to go back.
Navigation
Navigation allows users to jump from one page to another with conditions. It supports all chart, table, text, and image Cards except filter Cards. This is useful when a single chart is not enough to present a full analysis process or result.
Export Data
If you have export permissions, Dashboard data can be exported in multiple formats for offline review and sharing.
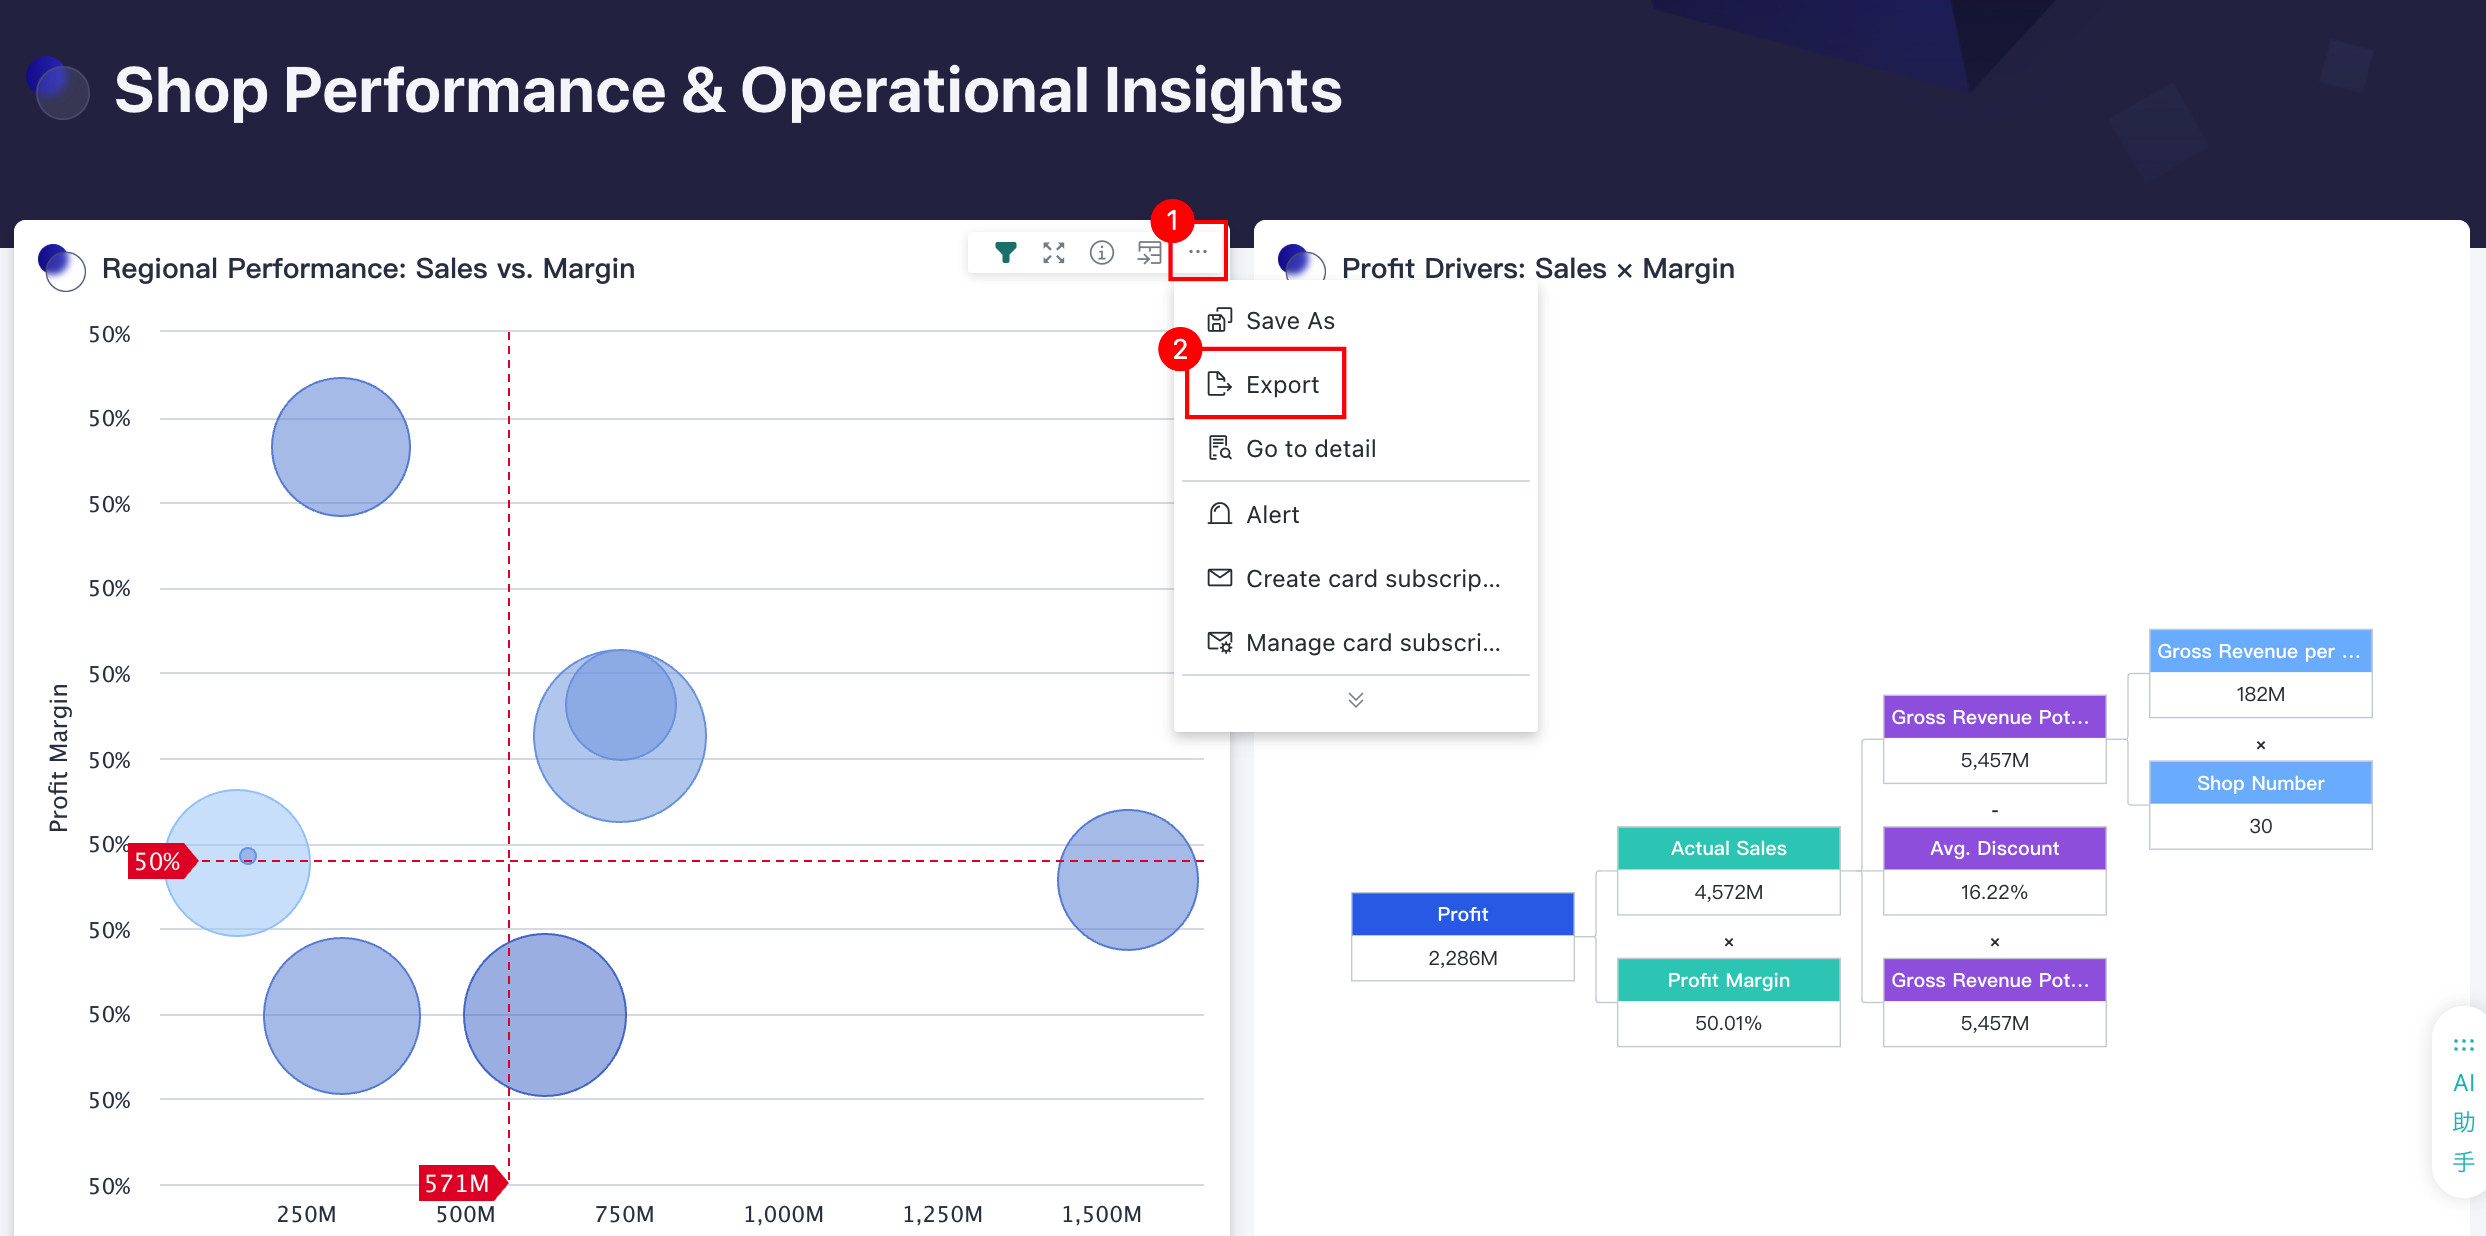
Export a Single Card
- Find the Card to export.
- Click the operation menu in the upper-right corner.
- Choose the export format.
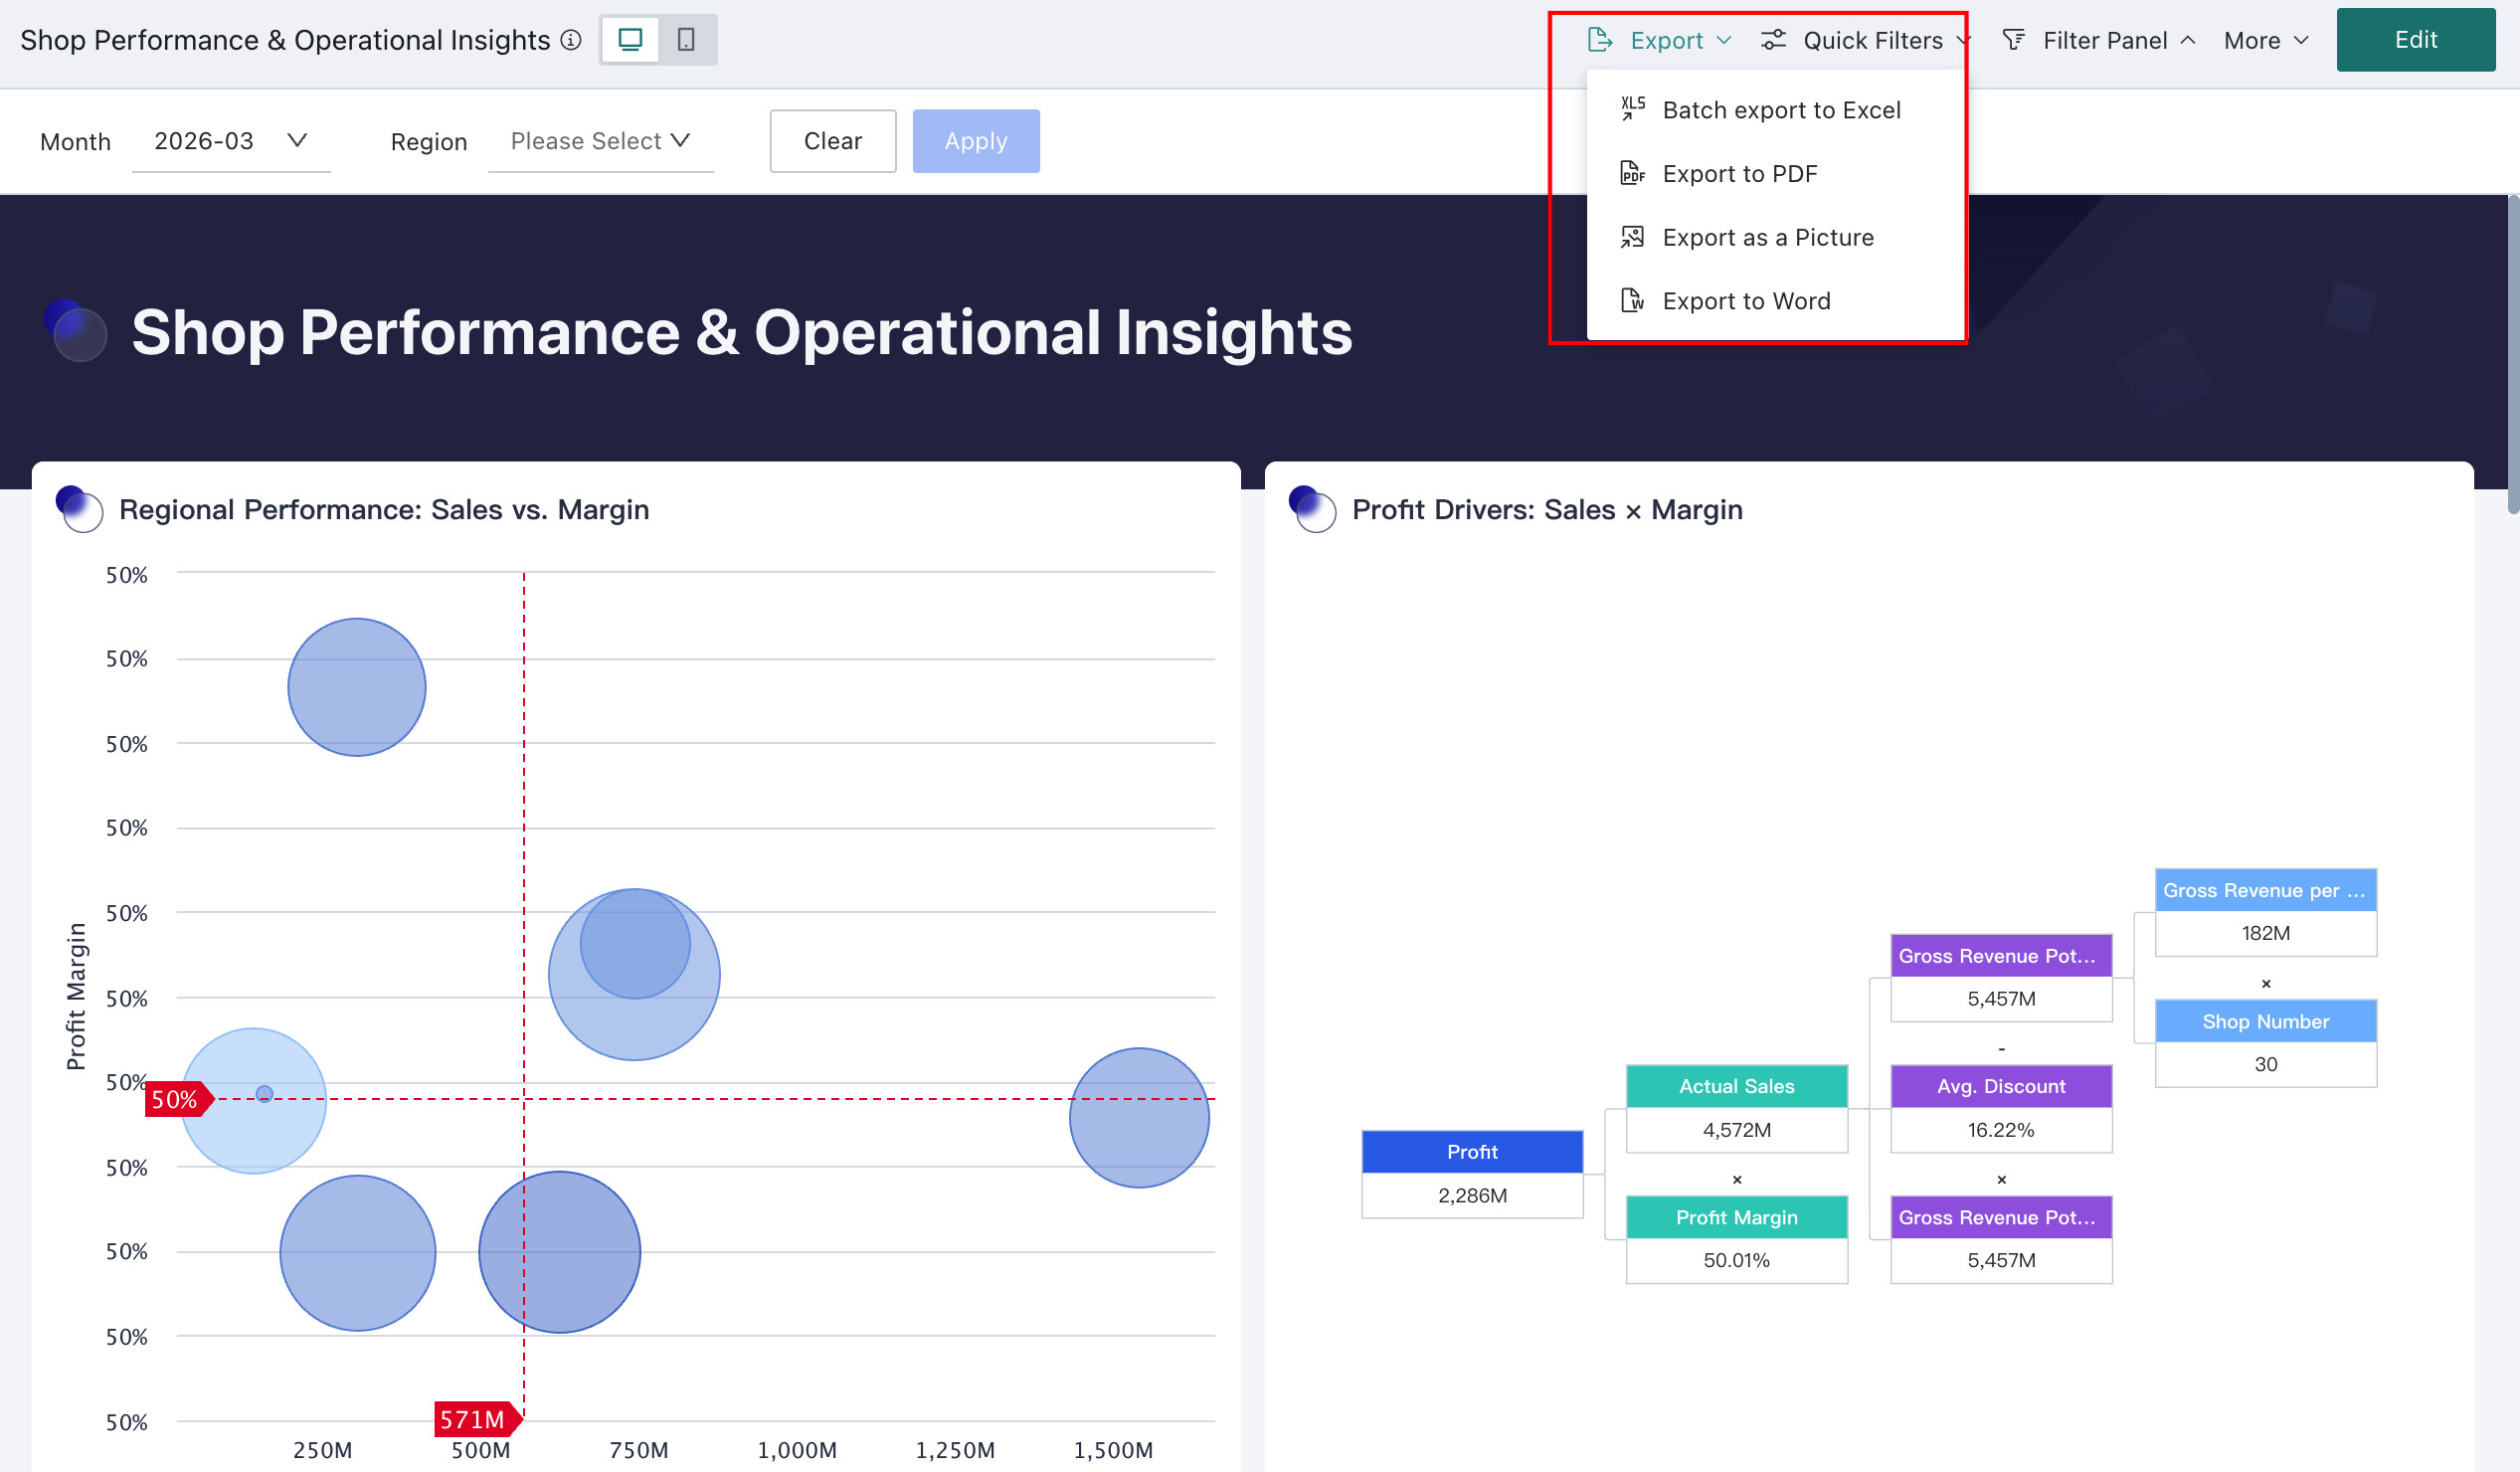
Bulk Export
- Click
Exportin the upper-right corner of the page. - Select the desired format, such as PDF, image, or Excel.
- Complete the export according to the selected format.