Guandata BI Core Features
1. Description
Guandata BI is a one-stop BI platform composed of a series of product matrices, such as the zero-code drag-and-drop ETL tool Smart ETL; scenario-based applications and intelligent insight apps based on industry best practices; highly Excel-compatible Chinese-style reporting; cool visualization components for one-click installation; and one-click data entry to solve temporary data source integration, etc.
The product capability matrix mainly consists of BI Core, BI Plus, BI Management, and BI Copilot, corresponding to end-to-end ease of use, business-oriented scenarios, enterprise-level platform foundation, and innovation lab. Below is a quick overview of the product features of Guandata BI platform under different versions.
- Note: Some product modules are value-added modules. For trial experience, please contact Guandata sales or customer success manager (usually your company's current service contact).
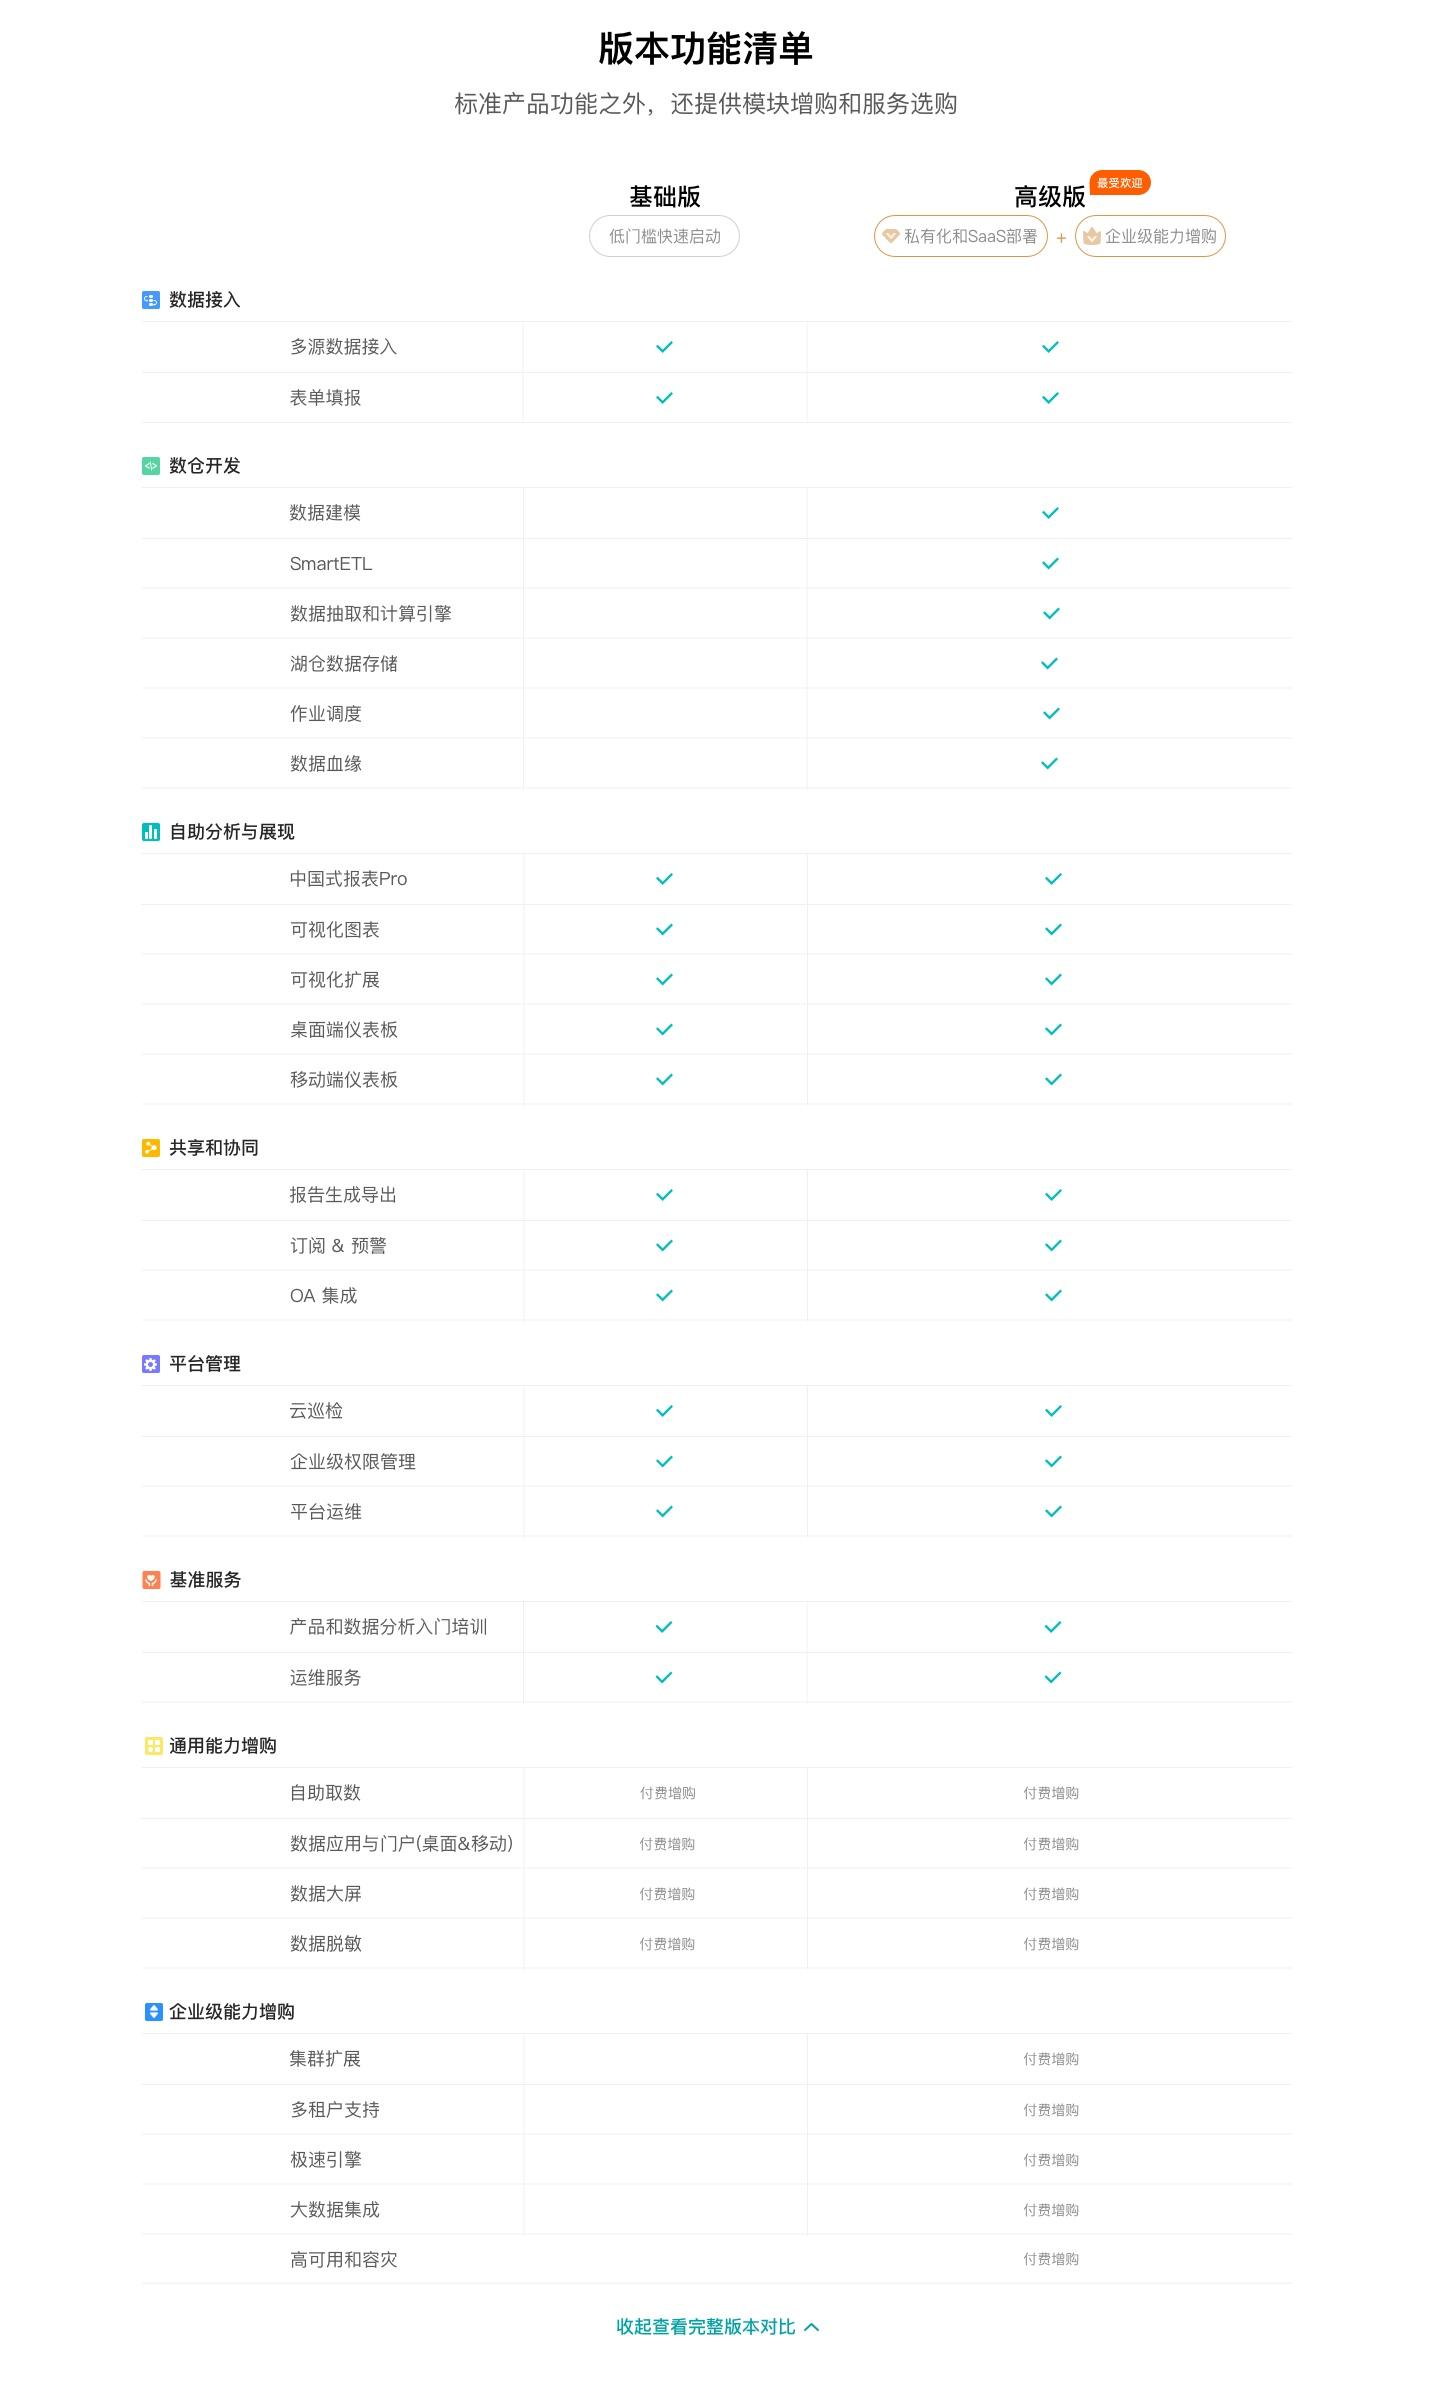
2. Version Feature List
Guandata BI currently provides a low-threshold basic version for quick start, as well as a complete solution version suitable for digital transformation nodes, and offers additional services for enterprise-level and big data capabilities.
3. Feature Introduction
Guandata BI has four core product capability matrices, mainly composed of BI Core, BI Plus, BI Management, and BI Copilot, corresponding to end-to-end ease of use, business-oriented scenarios, enterprise-level platform foundation, and innovation lab.
3.1. Data Integration and Preparation
Multi-source Data Integration
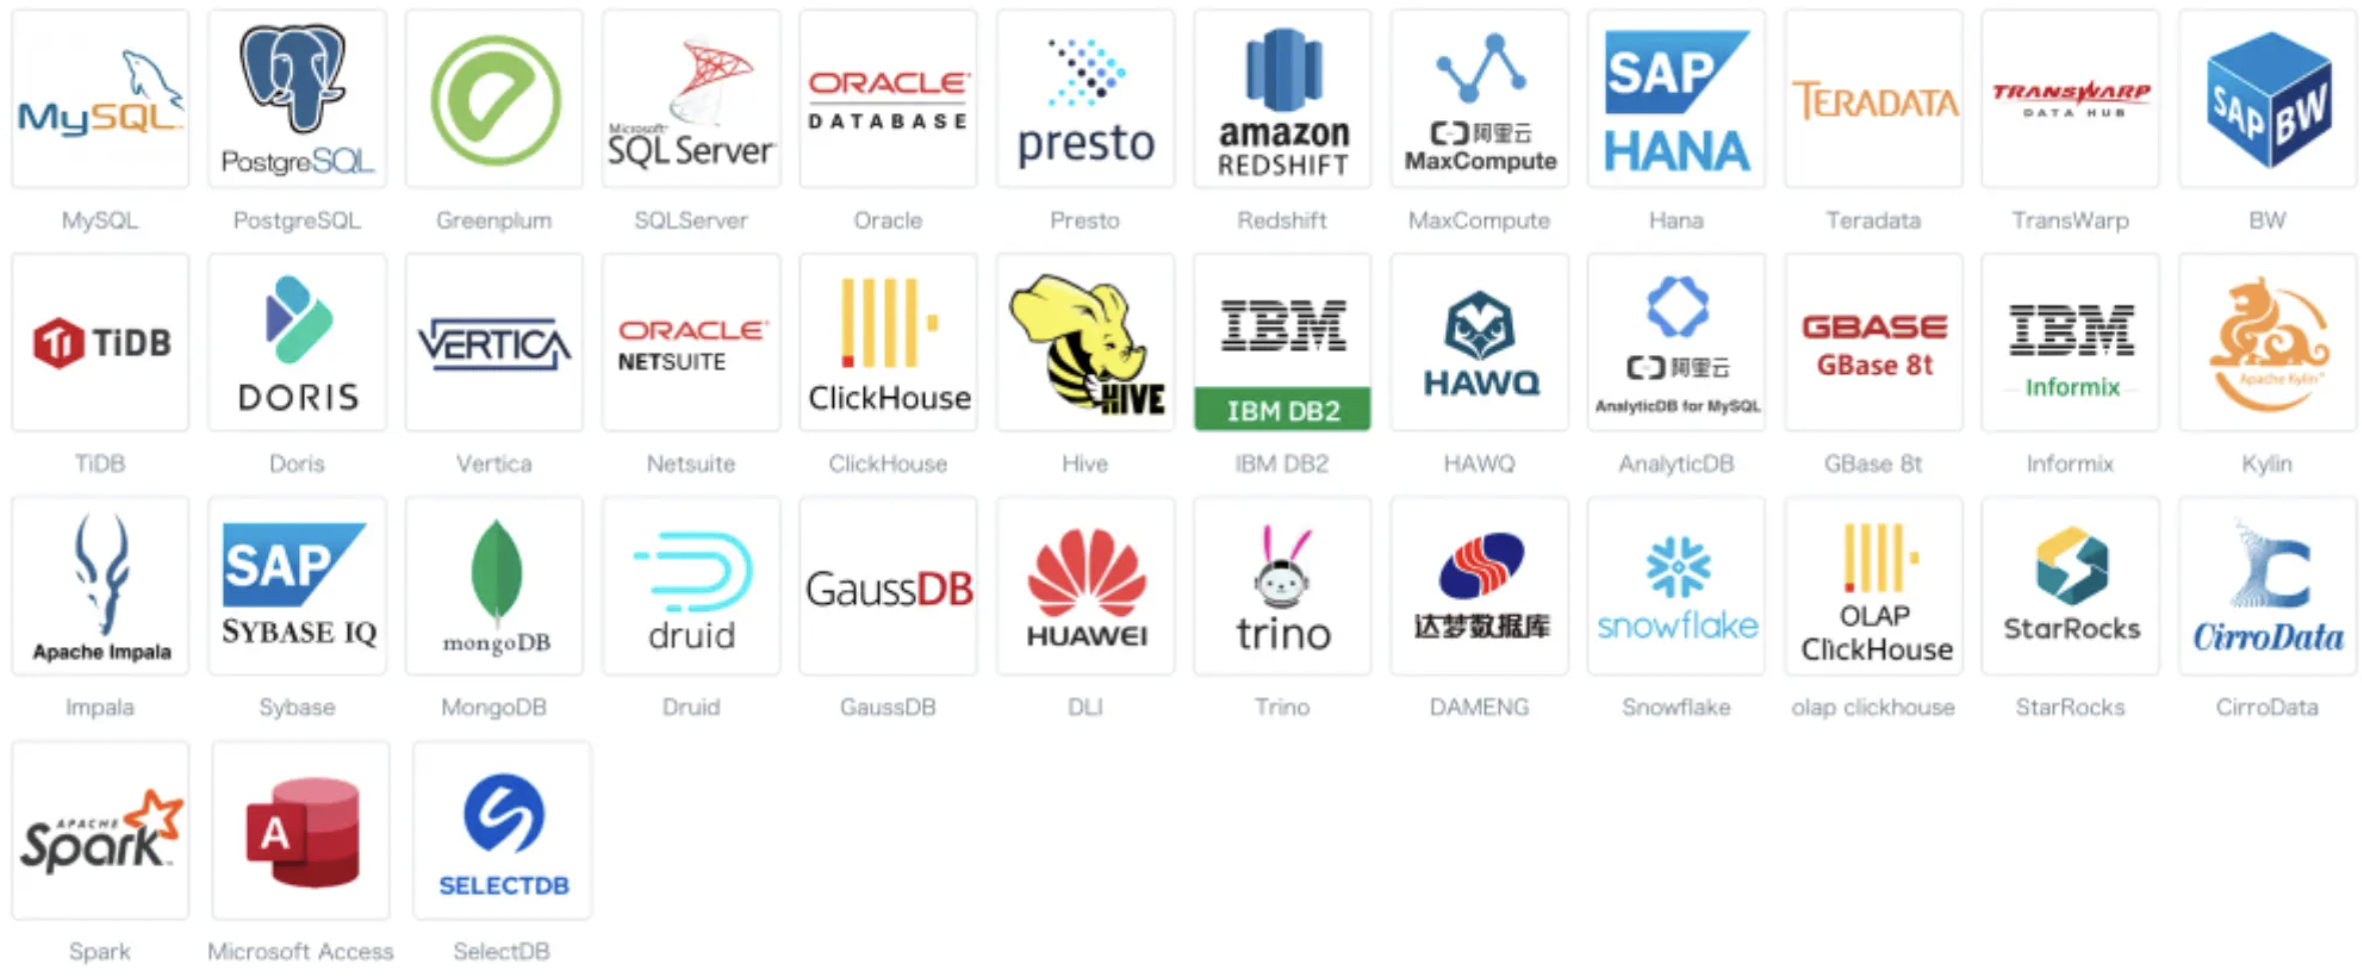
For enterprises with scattered and heterogeneous multi-source data, Guandata BI provides comprehensive data integration capabilities. By unifying data standards, it accumulates a data pool with a full view of data, breaking the phenomenon of data silos. Currently, Guandata supports JDBC, API, and other methods to integrate files, databases, and various types of data, including but not limited to 35+ built-in databases, self-service integration with cloud vendors/domestic external databases, local files, Web Service, FTP/SFTP, view datasets, stored procedures, and other multi-source data integration solutions.
-
File data: Provides services for importing data from Excel, CSV, and other files and processing the data.
-
Database data: Supports connecting to various databases, including but not limited to MySQL, PostgreSQL, Greenplum, SQL Server, Oracle, and 35+ types of databases; also supports self-service integration with cloud vendors, domestic external databases, etc. Provides both direct database connection and non-direct synchronization (extraction) methods.
-
API data: Integrates API data via Web Service, supports custom flexible configuration of API response parsing rules and field selection.
-
Account data: Supports synchronizing account data from common OA systems, enabling seamless integration between enterprise OA systems and Guandata BI. Currently supports WeCom, DingTalk, LDAP, Feishu, etc.
-
Public/industry data: Can integrate various public or industry data, such as weather data, national economic data, etc.
-
Remote file data: Supports integrating file data from remote file storage servers, supporting FTP/SFTP and ADSL Gen2.
-
Online document data: Supports integration with Feishu spreadsheets, allowing users to seamlessly import and synchronize data from Feishu spreadsheets to form online document datasets.
-
Stored procedure data: Supports integration with stored procedures in Oracle, MySQL, SQLServer, etc., allowing parameterized data extraction and dynamic query of stored procedure datasets via the web interface.
-
View datasets: Dynamic datasets based on SparkSQL that can be parameterized and executed, allowing users to dynamically associate and calculate one or more non-direct datasets to form new datasets.
Form Entry
Form Entry is a flexible and easy-to-use tool designed to provide convenient form building and data management functions, enabling data collection, management, and visualization analysis through simple data collection forms/questionnaires.
Applicable for:
-
Flexible business data collection: Previously, business data collection and maintenance mainly relied on Excel, which was cumbersome to notify, submit, and aggregate. With Guandata BI's form entry, Excel template maintenance and data collection/aggregation can be effectively simplified in the backend.
-
Mobile event registration: Collect personnel information for internal and external company events without having to ask one by one via DingTalk or WeChat. One form does it all: create form—send form—collect info, simple and efficient.
-
Conducting surveys: Quickly create and distribute surveys using forms, no need to print or distribute on the street, ensuring data quality and improving survey effectiveness.
-
Master data management: Free master data from manual Excel maintenance, automatically collect, update in time, and maintain regularly.
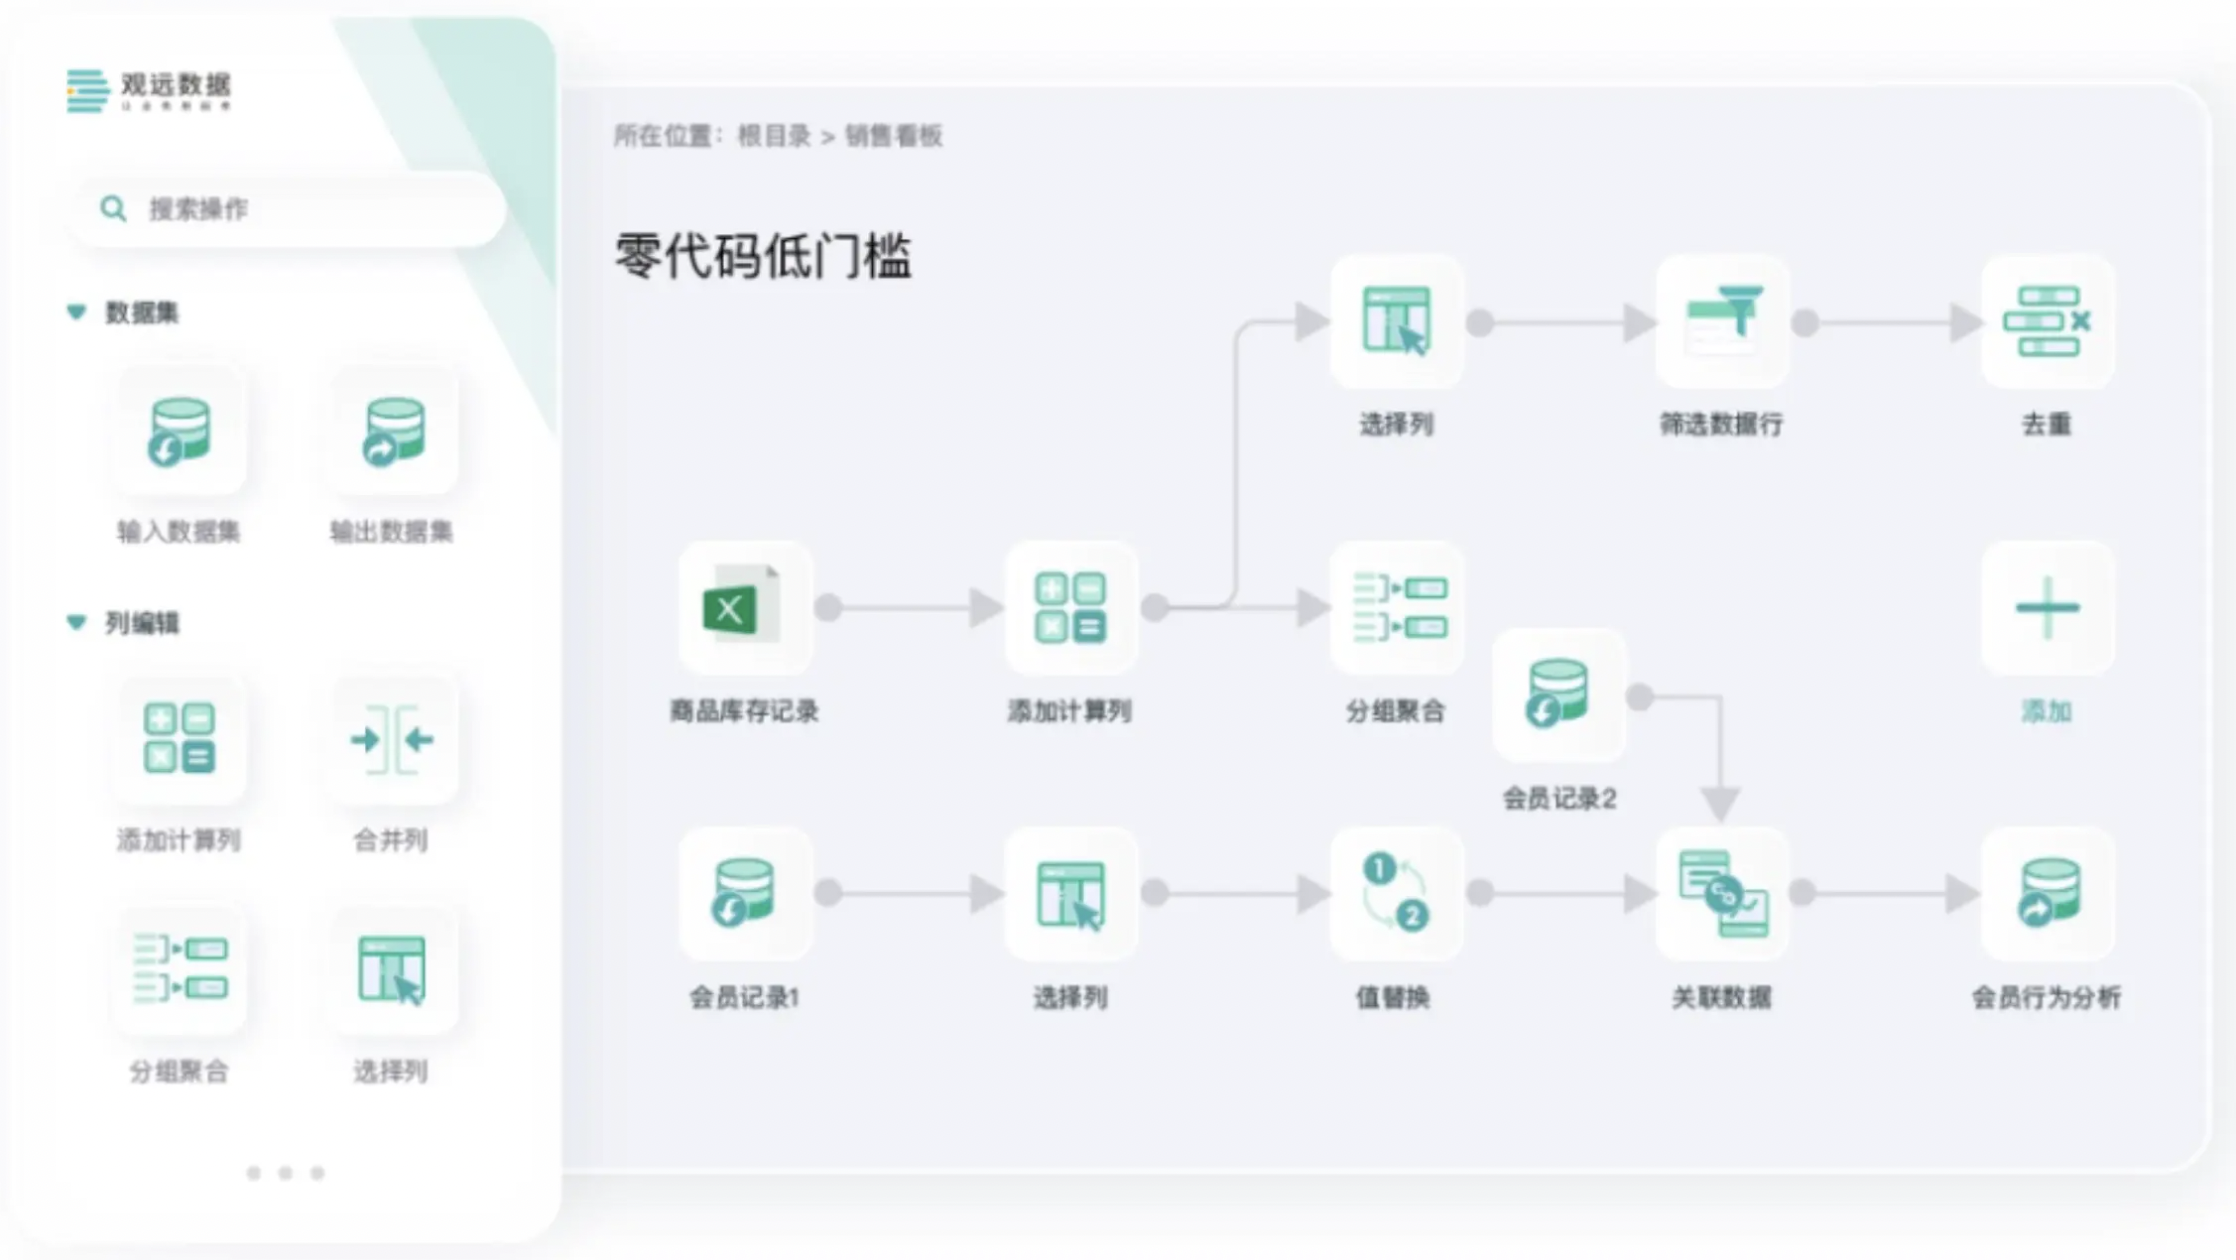
Smart ETL
Smart ETL is a zero-code, fully drag-and-drop, self-service data preparation and data warehouse construction tool provided by Guandata for business users. It allows users to easily, efficiently, and intelligently process datasets before data analysis and visualization, even without SQL knowledge. Based on powerful data processing operators and nodes, users can clean, transform, and load data through drag-and-drop and configuration, preview and correct outputs in real time at any node, and build data processing workflows, helping enterprises/departments build lightweight data warehouses.
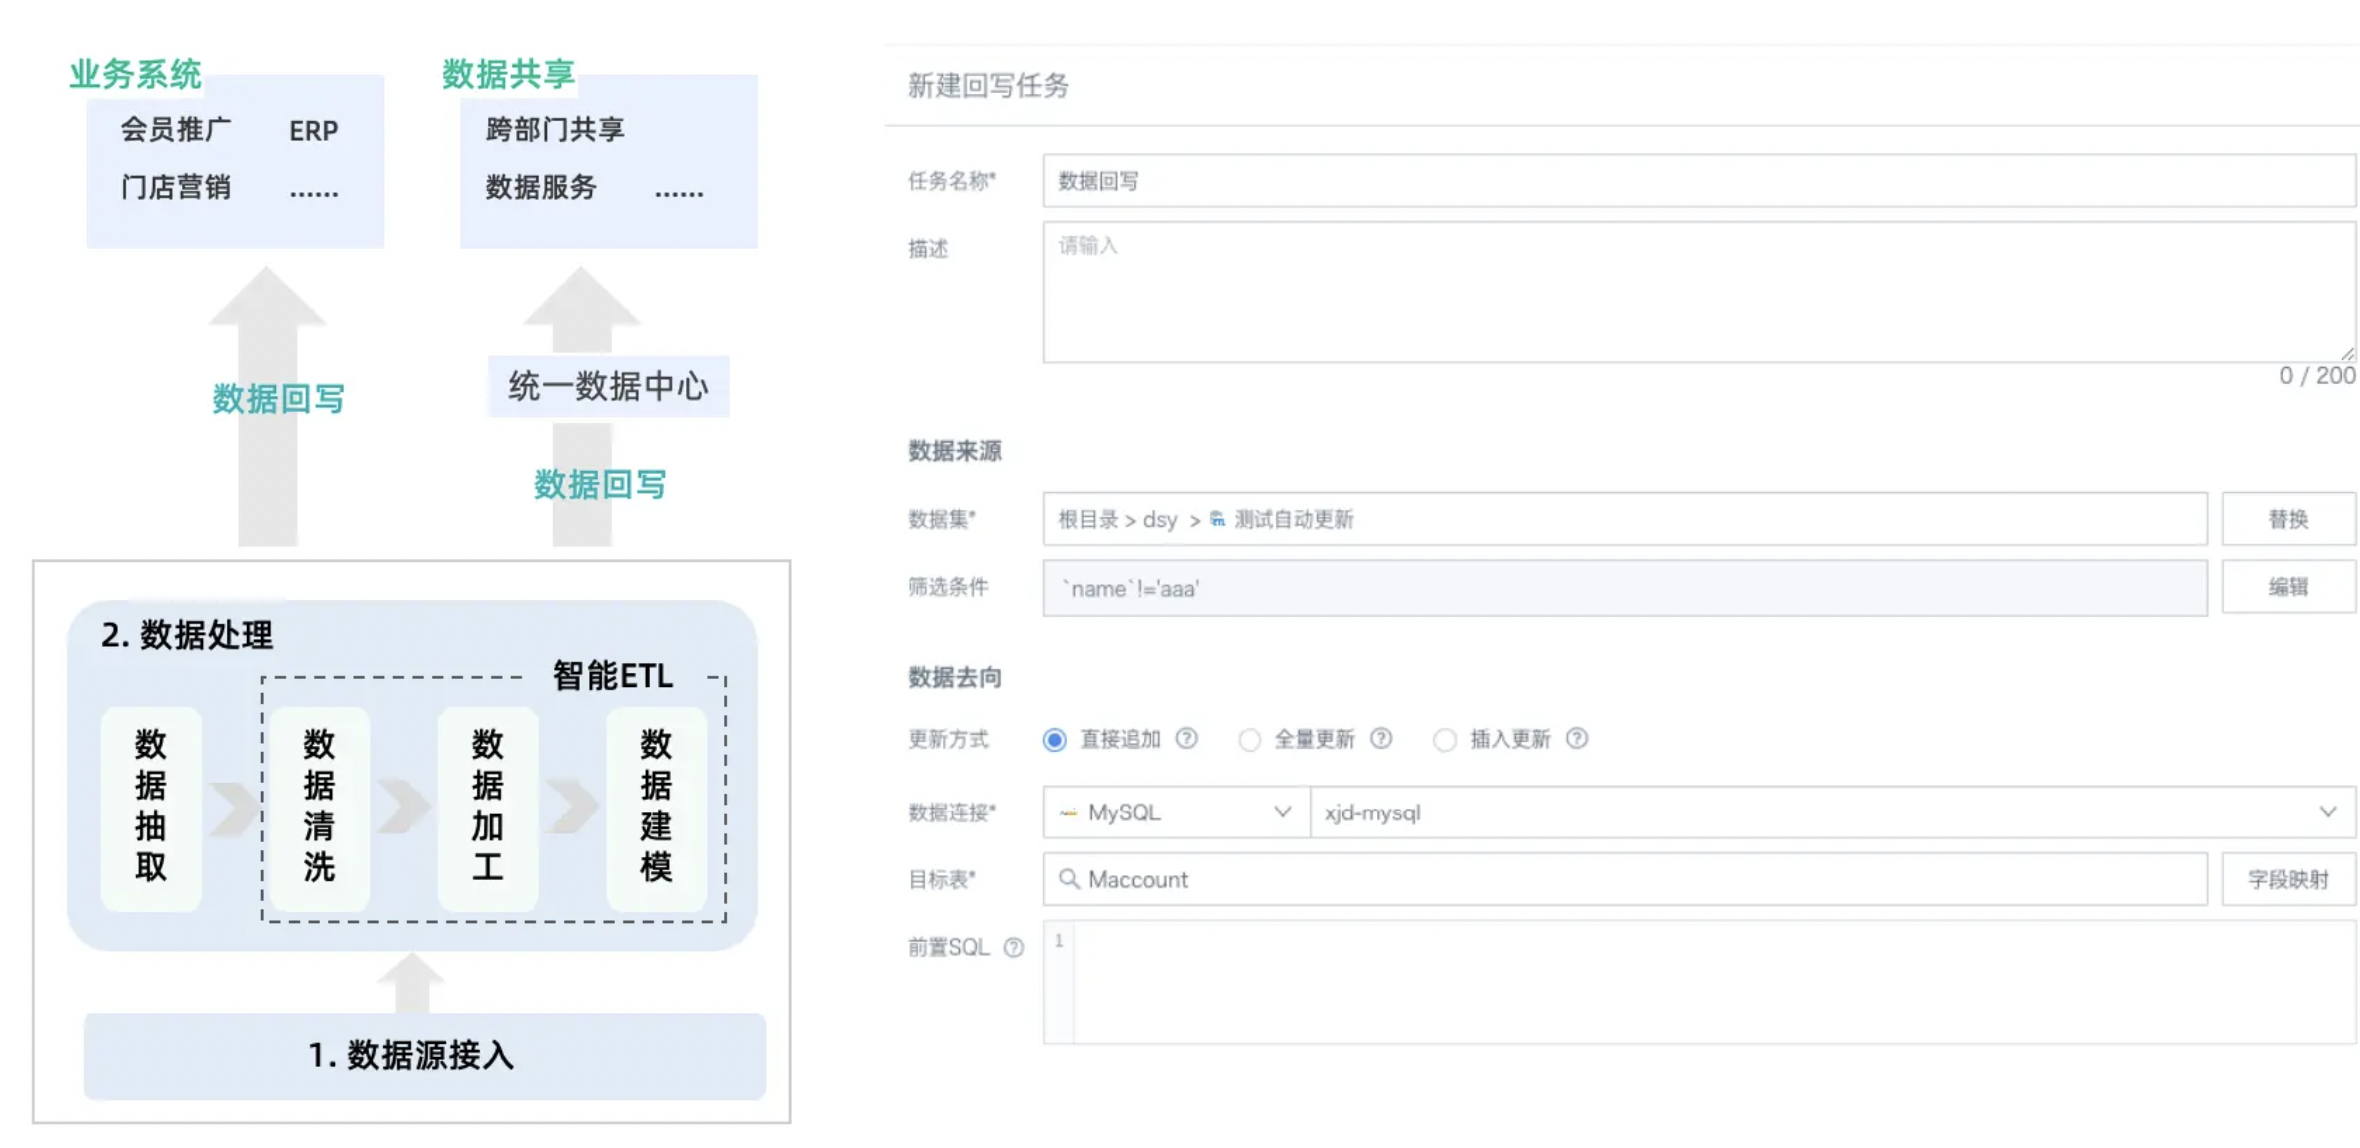
Data Writeback
Data writeback sends datasets processed or analyzed by the BI platform back to customer business systems and data warehouses. The returned data may include ETL output, key business value card analysis results, or form entry data. This enables the direct application of analysis insights to real business scenarios, such as sending product sales data back to the supply chain system for planning, or sending audience analysis data back to the marketing database for targeted marketing, thus accelerating real-time business decision adjustment and optimization, and completing the digital operation closed loop.
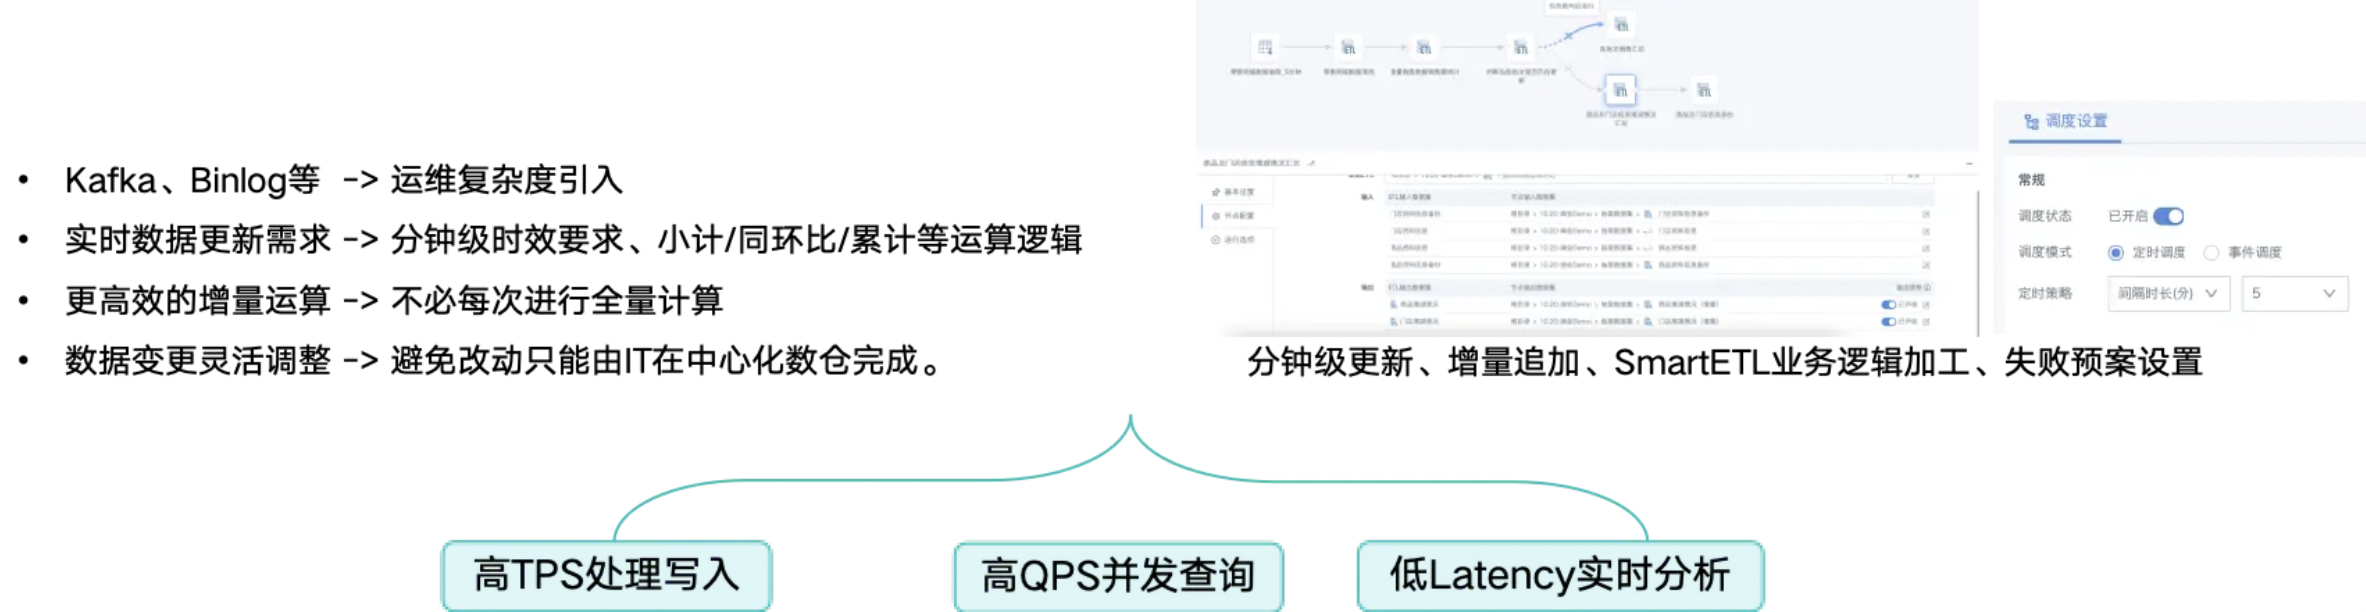
Complex Task Orchestration (Advanced Scheduling)
Traditional event scheduling has a high threshold, requiring users to master SQL to configure dependencies and scheduling between tasks. Complex ETL dependencies cannot be visually monitored. Guandata's advanced scheduling uses DAG workflows to assemble platform tasks (including ETL, datasets, etc.), allowing users to configure dependencies and execution order via drag-and-drop, and provides a global view for real-time monitoring, retry, recovery from failure, pause, and kill operations.
We also provide event-driven and time-driven workflow scheduling, combined with a high-frequency incremental update scheduler based on Micro-Batch computing engine, offering high-performance, stable, real-time data integration and analysis at lower cost.
3.2. Reporting and Visualization
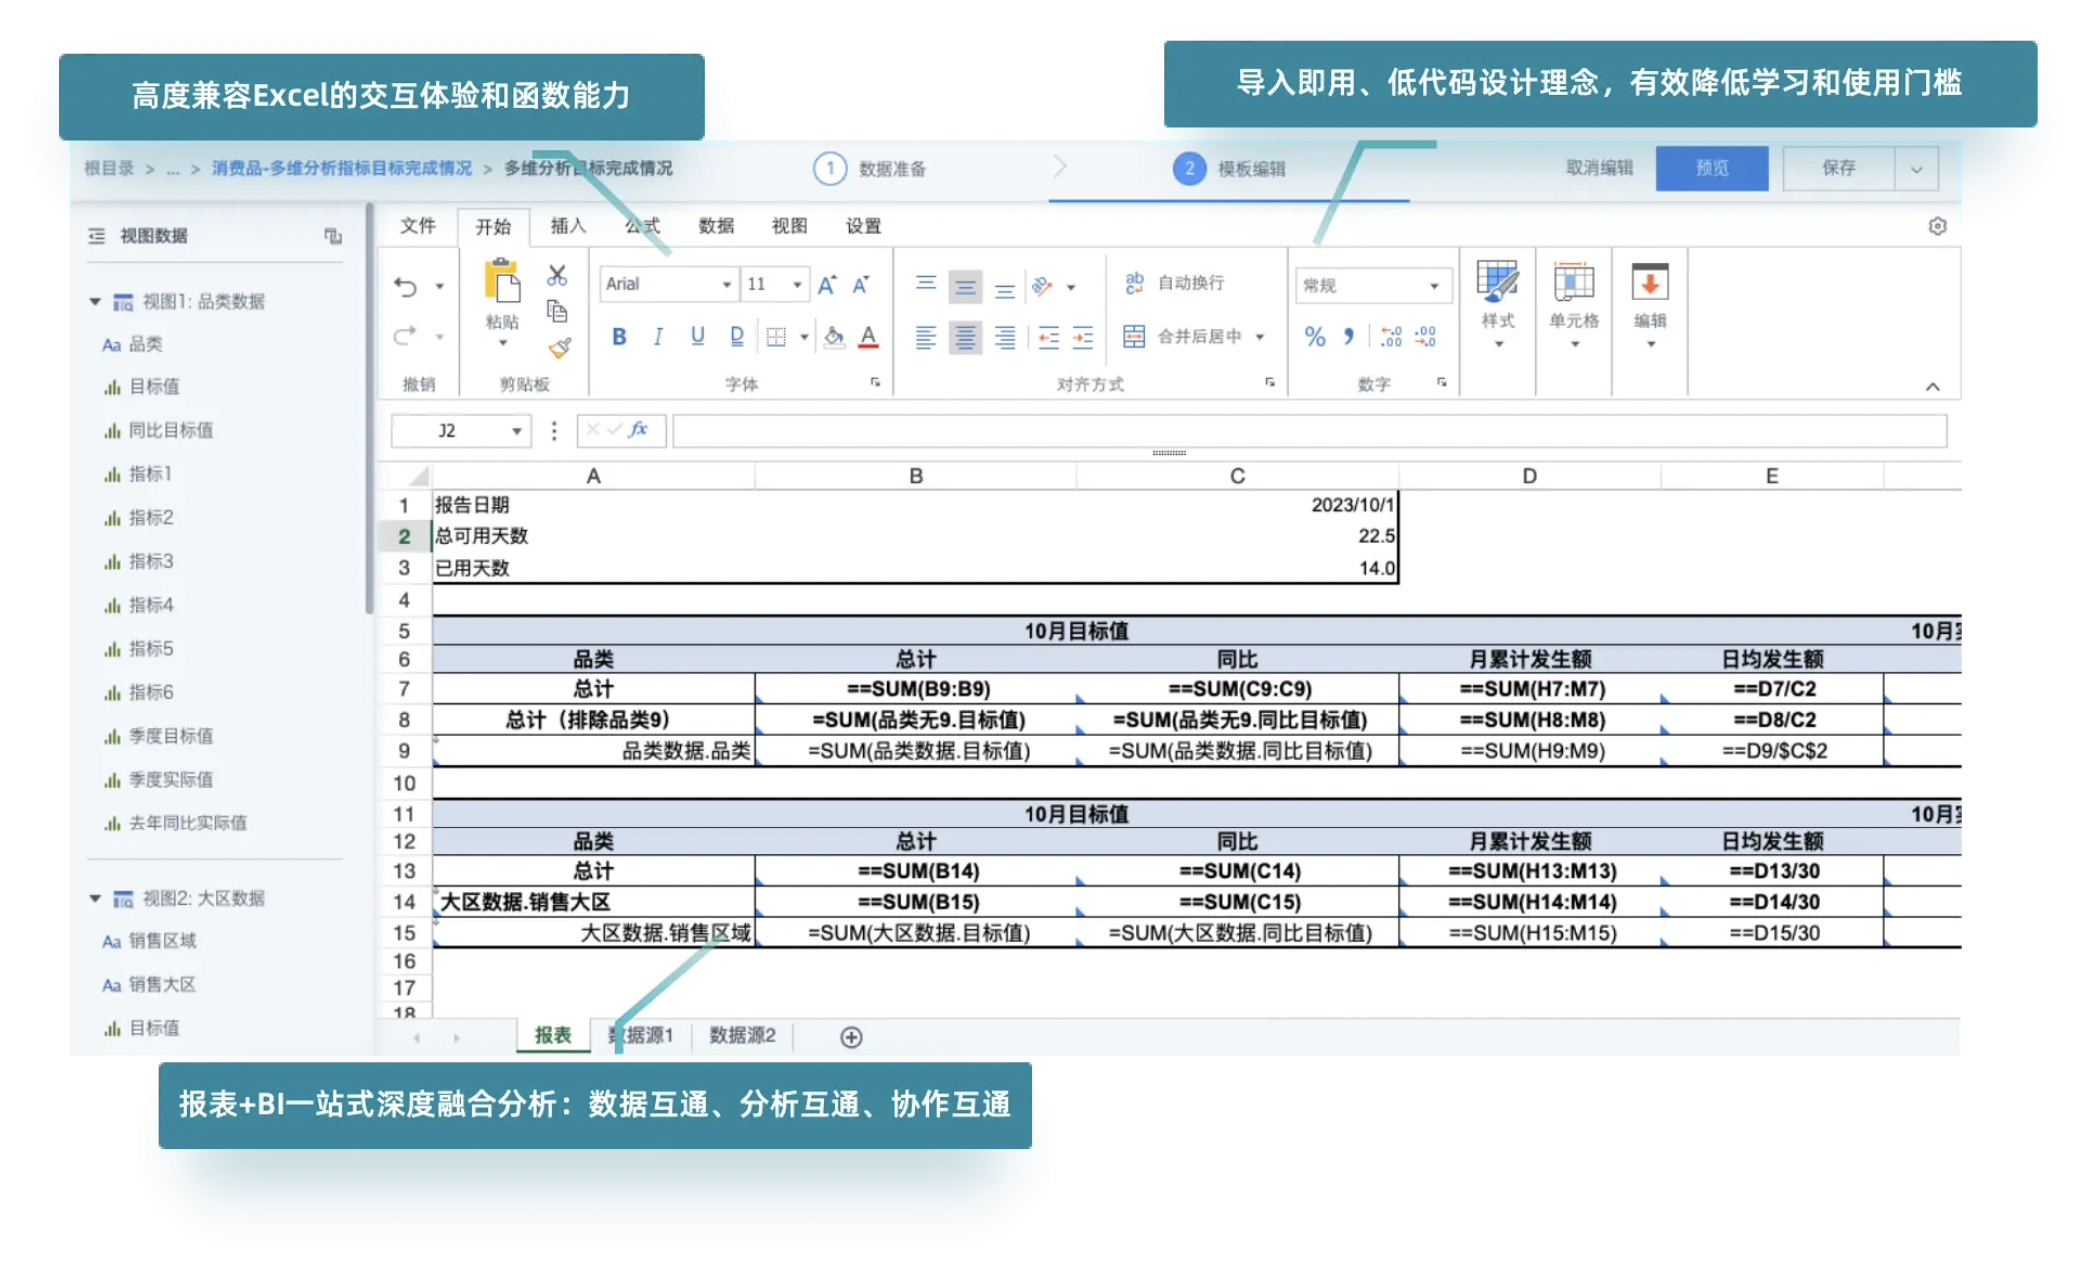
Chinese-style Report Pro
Chinese-style Report Pro is a low-threshold, one-stop complex reporting product highly compatible with Excel user habits, designed to make report development more agile and complex reports no longer "complex." Embedded in Guandata BI, it supports multi-source integration, multi-table analysis, cross-row calculation, function calculation, and can be linked with other BI charts, with easy online/local editing mode switching, lowering the threshold and improving report development efficiency.
Key features of Chinese-style Report Pro:
- Highly compatible with Excel: Supports Excel interaction habits, 450+ native functions, and powerful table capabilities.
- Low threshold: Drag-and-drop template editing, easy to learn, real-time preview, WYSIWYG.
- Fast online migration: Reuse offline report formats and content for quick online migration, no need to redefine logic.
- Smart data preparation: With Smart ETL, quickly integrate and process all data sources needed for complex reports, reducing development threshold.
- Complex calculation and analysis: Supports value queries, cell calculations, parameterized queries, and can be integrated with other BI charts for linkage and filtering.
- Security and permission control: Use BI's data permission control to manage report data sources securely.
- Sharing and collaboration: Supports template download, card export, and subscription for multi-person sharing.
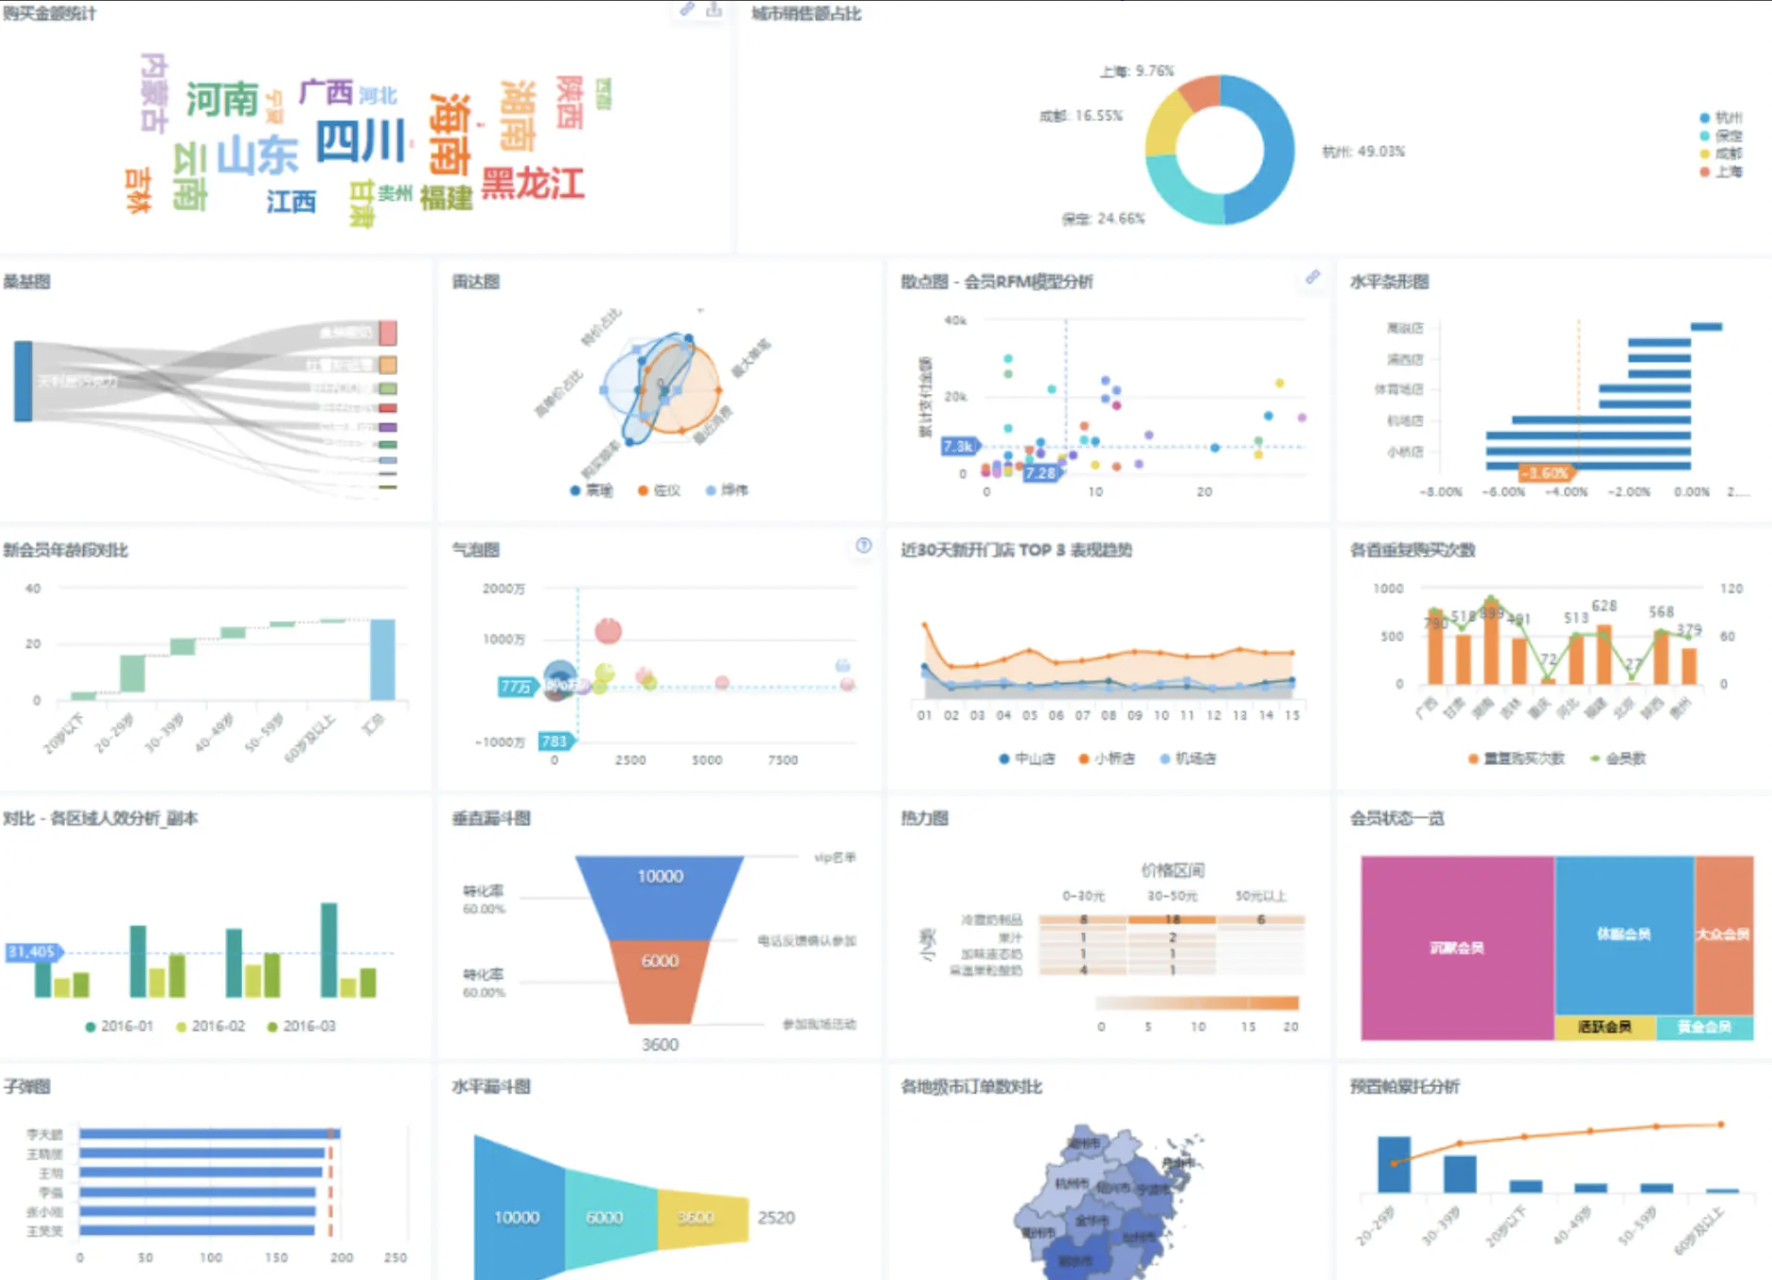
Visualization Chart Analysis
Guandata provides a variety of chart and table types for data analysis display, presenting intuitive, easy-to-understand results through visualization.
Basic chart visualization: Includes various chart types and analysis options to ensure flexible query and analysis needs.
- Chart visualization: Supports tables, indicator cards, gauges, line charts, clustered bar charts, stacked bar charts, percent stacked bar charts, waterfall charts, bar charts, stacked bar charts, Sankey diagrams, dashboards, and 50+ visualization charts and pivot tables.
- Visualization editing: Supports basic analysis (fields, values, filters, sorting, splitting), chart attribute configuration (theme color, text color, auxiliary lines), calculated fields, grouping, advanced calculations (YoY, percentage, ranking, duplication rate), conditional formatting, summary indicators, chart/table switching, etc.
- Dynamic query and analysis: Supports dynamic time macros, global parameter references, dynamic analysis for complex scenarios, dimension/indicator switching, dynamic classification, cross-table queries, etc.
Extended chart visualization: Provides more extension and customization options for specific chart types, styles, and functions.
- Custom charts: Based on Echarts, Highcharts, etc., supports custom visualization extensions and two editing modes (Custom Chart, Custom Chart Lite).
- Chart plugins: Based on Guandata Visualization SDK, supports dynamic bar charts, butterfly charts, dumbbell charts, forecast curves, linear regression, calendar charts, etc., downloadable from the Guandata app market.
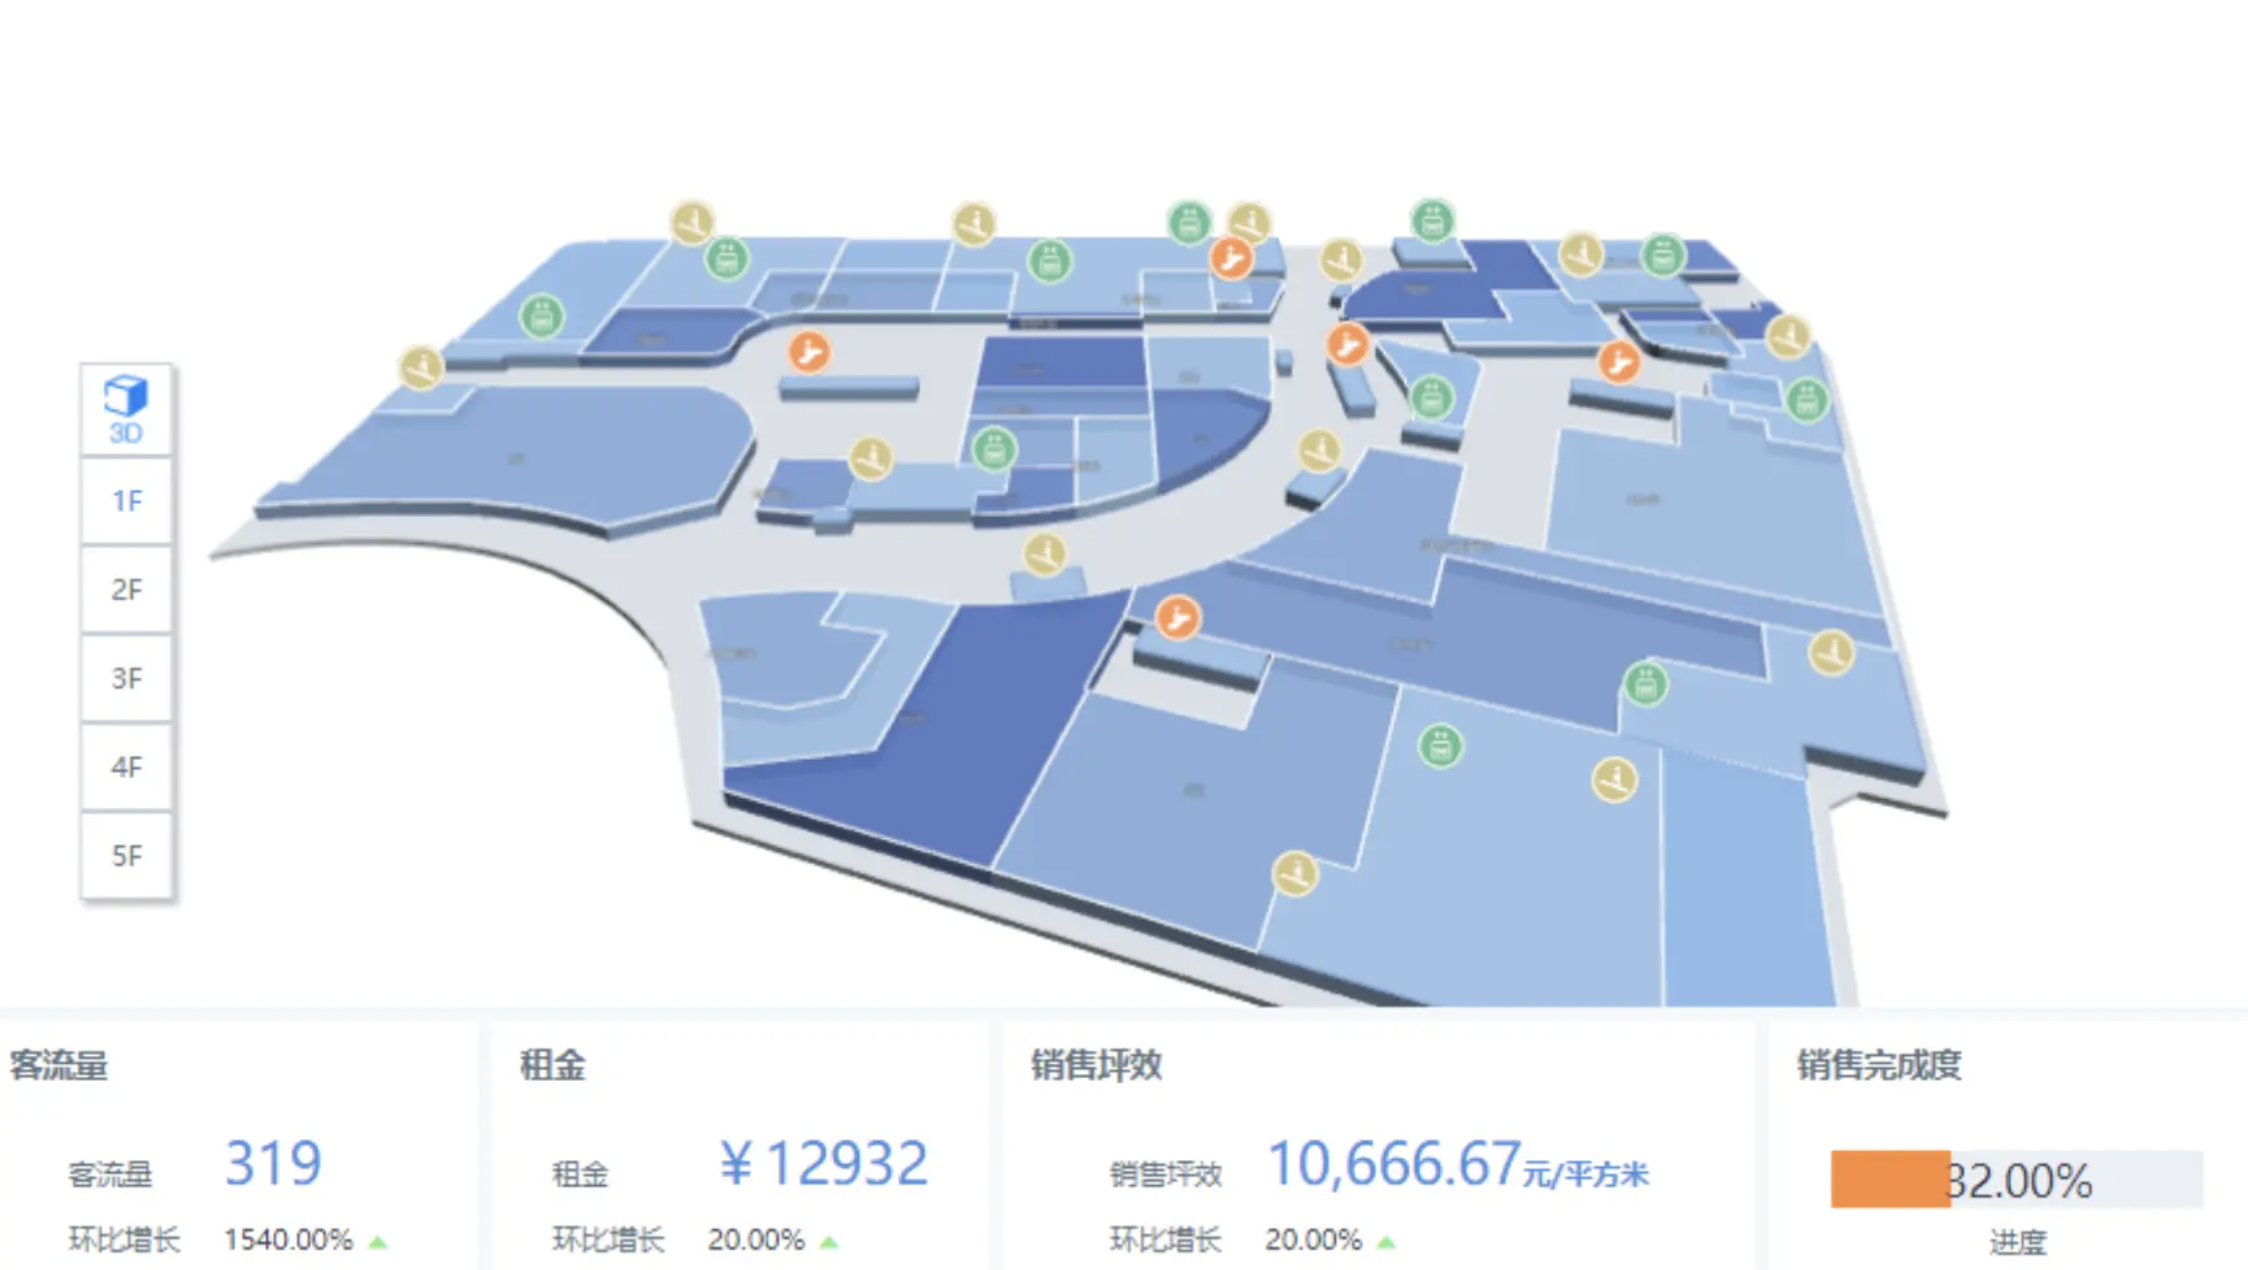
- Custom maps: Provides custom map visualization and management, including Etone indoor maps, flat maps, third-party indoor maps (e.g., Hummingbird Cloud), and custom administrative maps.
Desktop/Mobile Dashboards
Dashboards are pages that aggregate visualization cards, including dashboard pages and directories. Pages are collections of visualization cards, where users can customize layout, copy, favorite, etc. Mobile dashboards use mobile layouts for beautiful, rich content, with layout and settings for components, card styles, and page styles.
3.3. Consumption and Analysis Applications
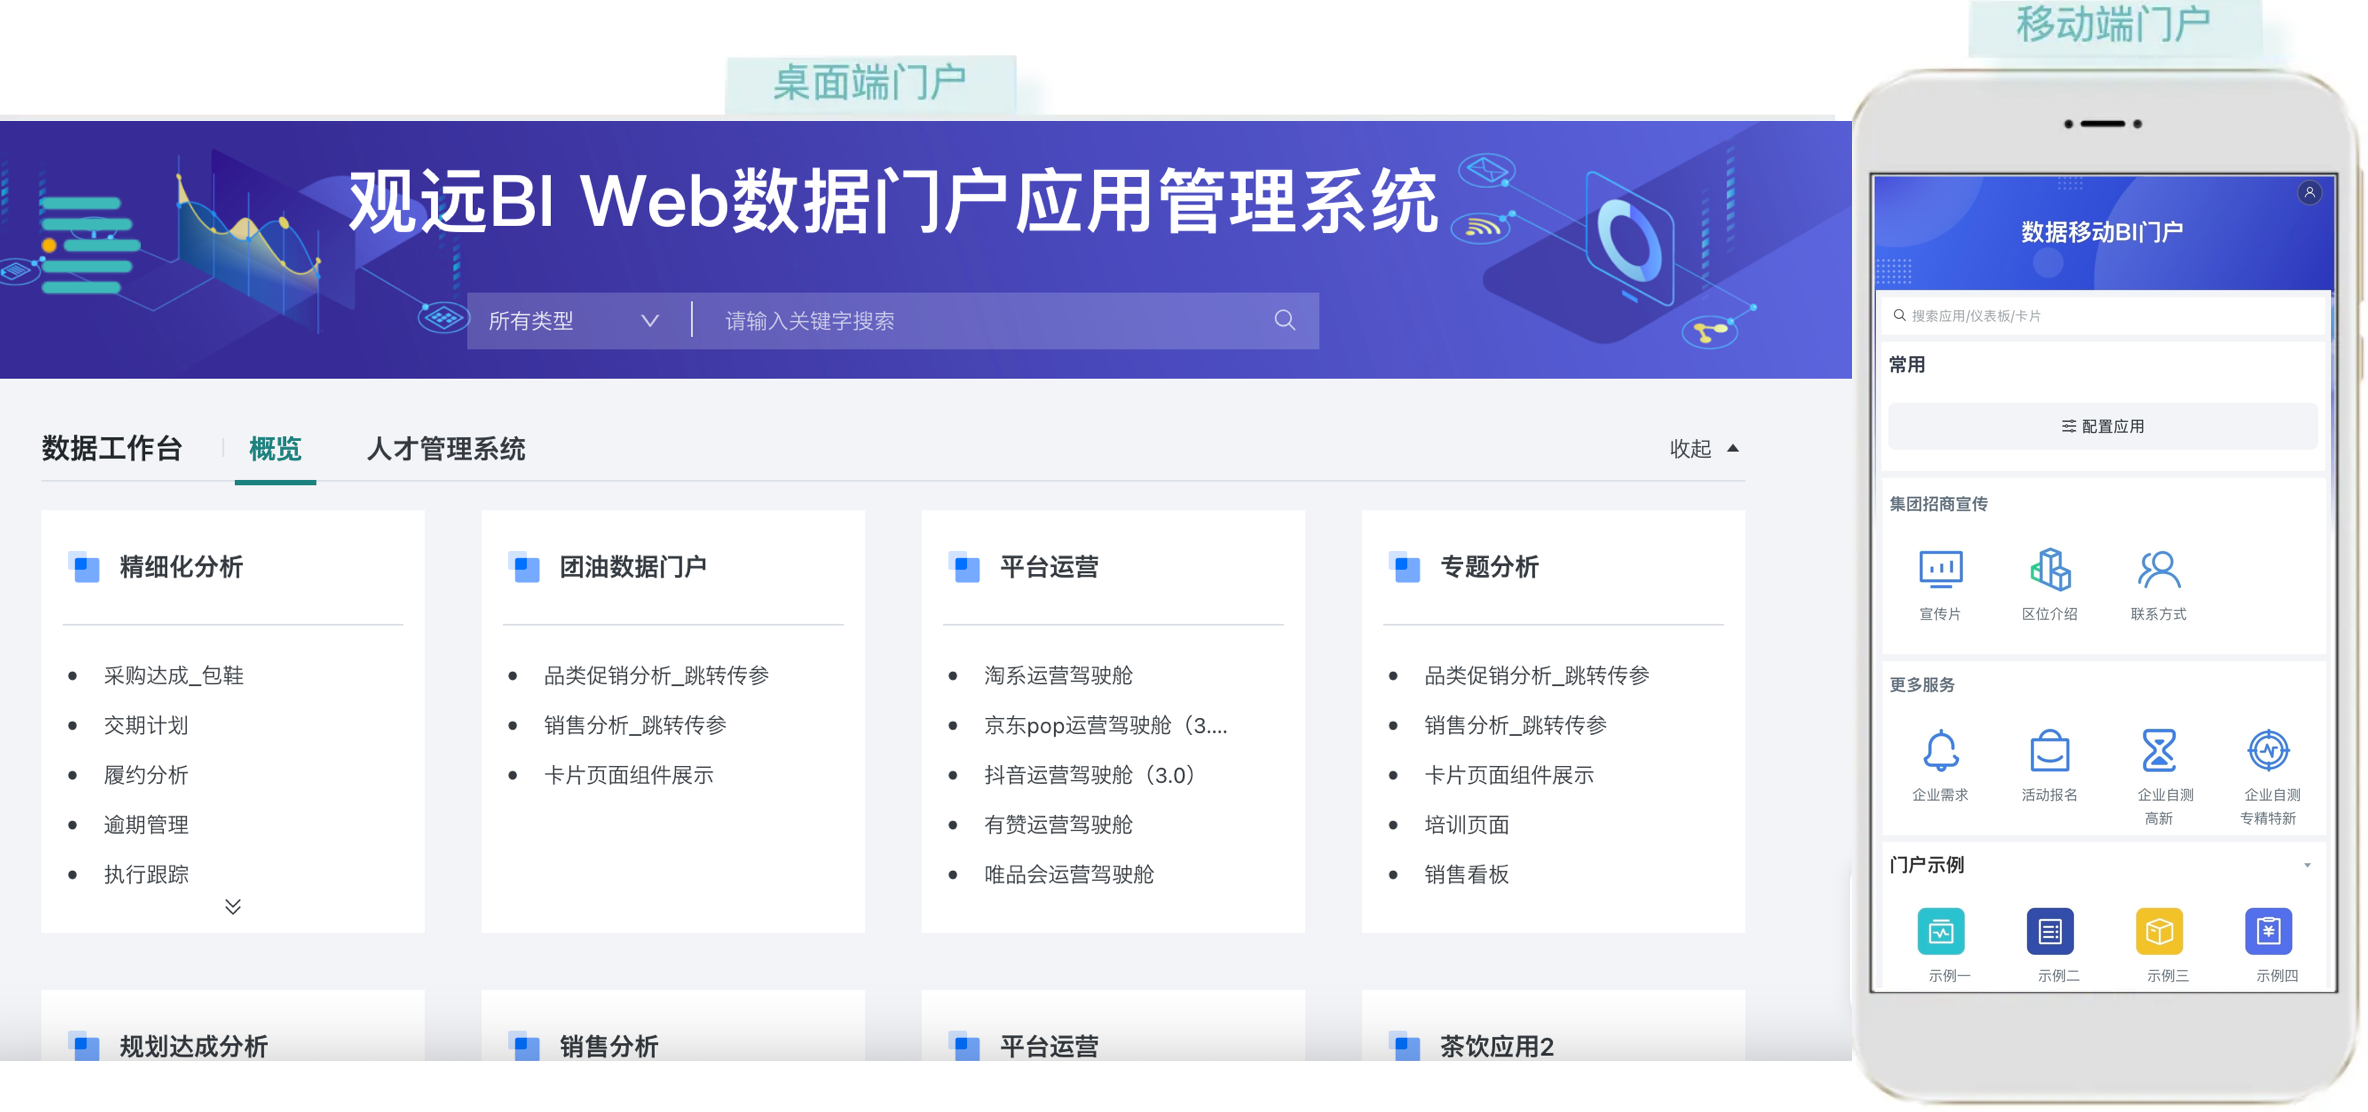
Data Portal
Data Portal is a data application management feature launched by Guandata, including desktop and mobile. It allows classification and grouping of data analysis applications by department, business topic, etc., providing an intuitive portal for data consumers, especially senior management, to quickly understand business status.
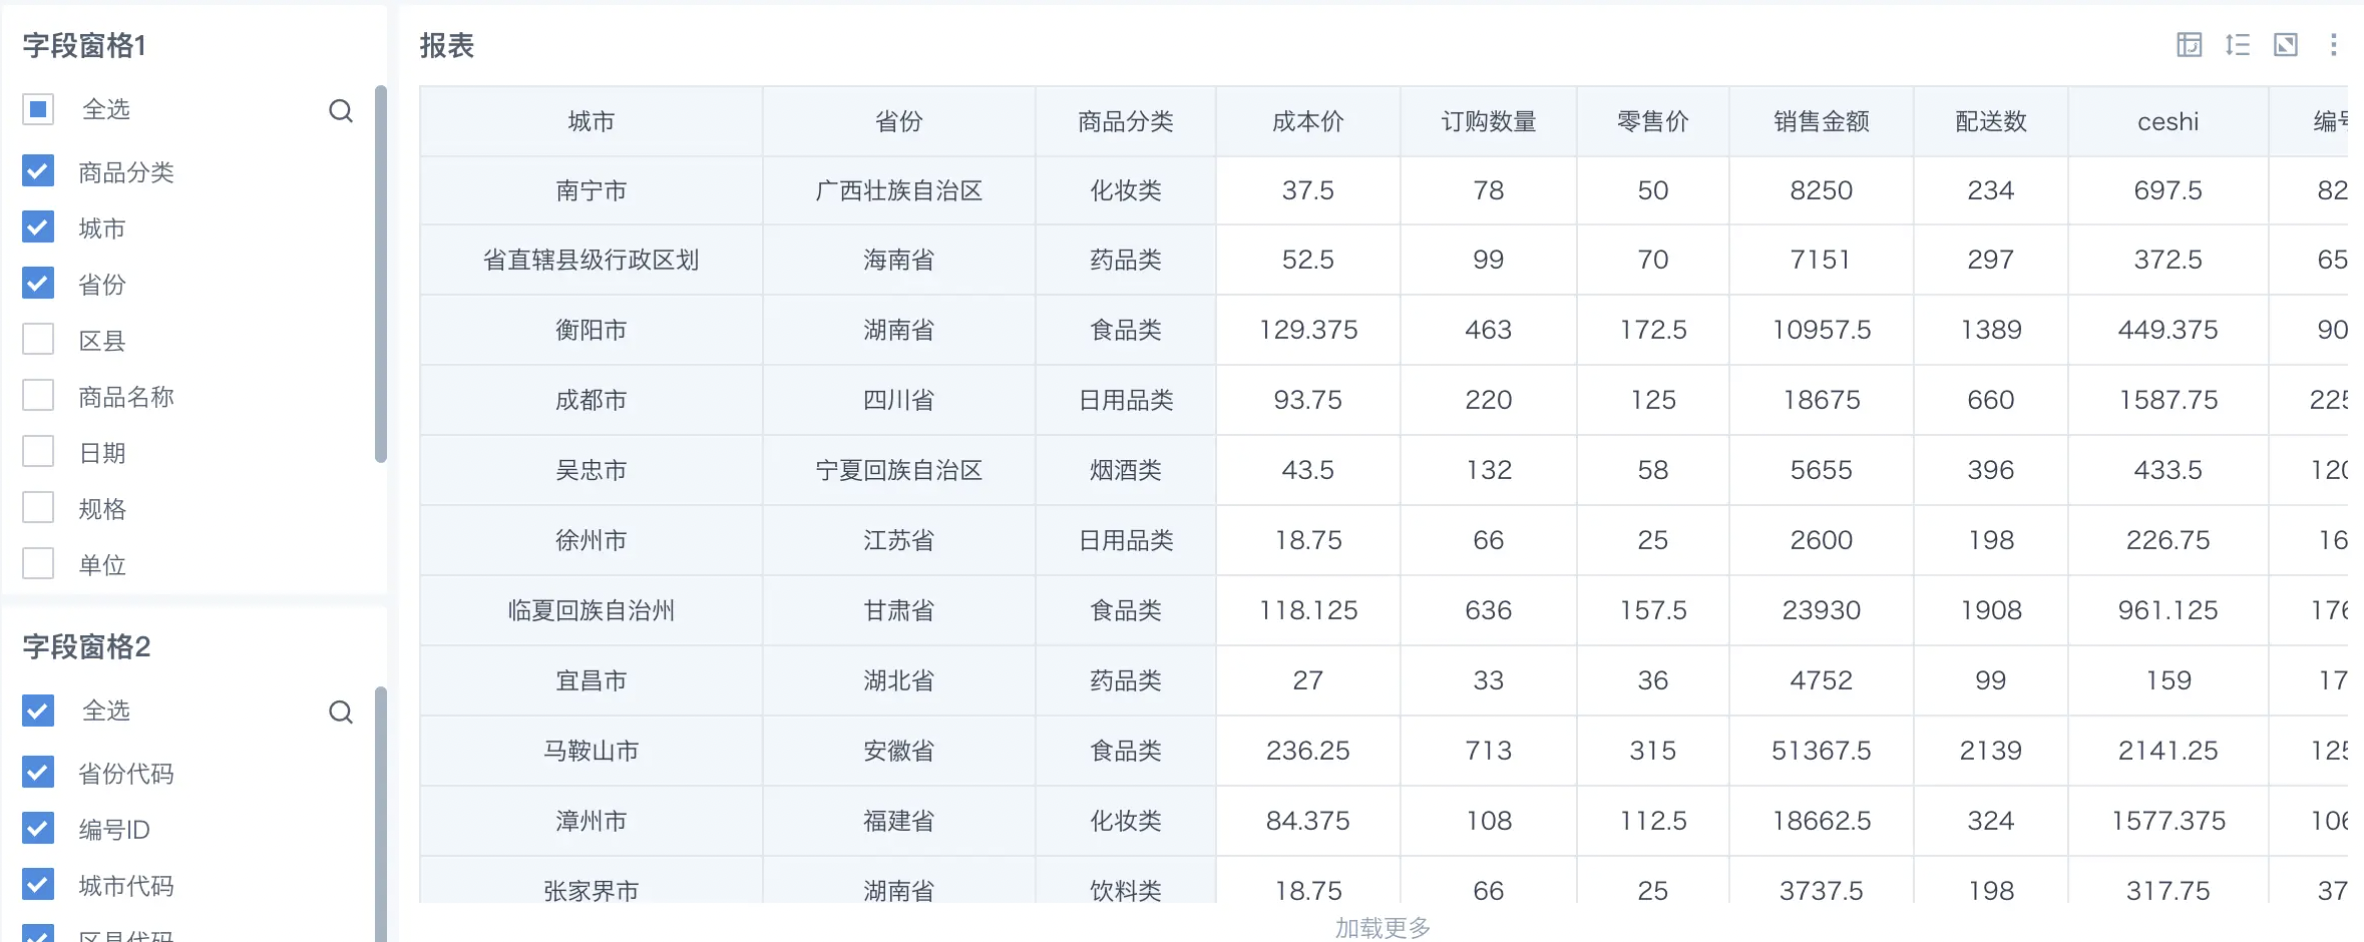
Self-service Data Query
Self-service data query allows flexible report building and ad-hoc queries, enabling end users to build custom reports via the interface and quickly obtain data with drag-and-drop operations, even with frequent data needs.
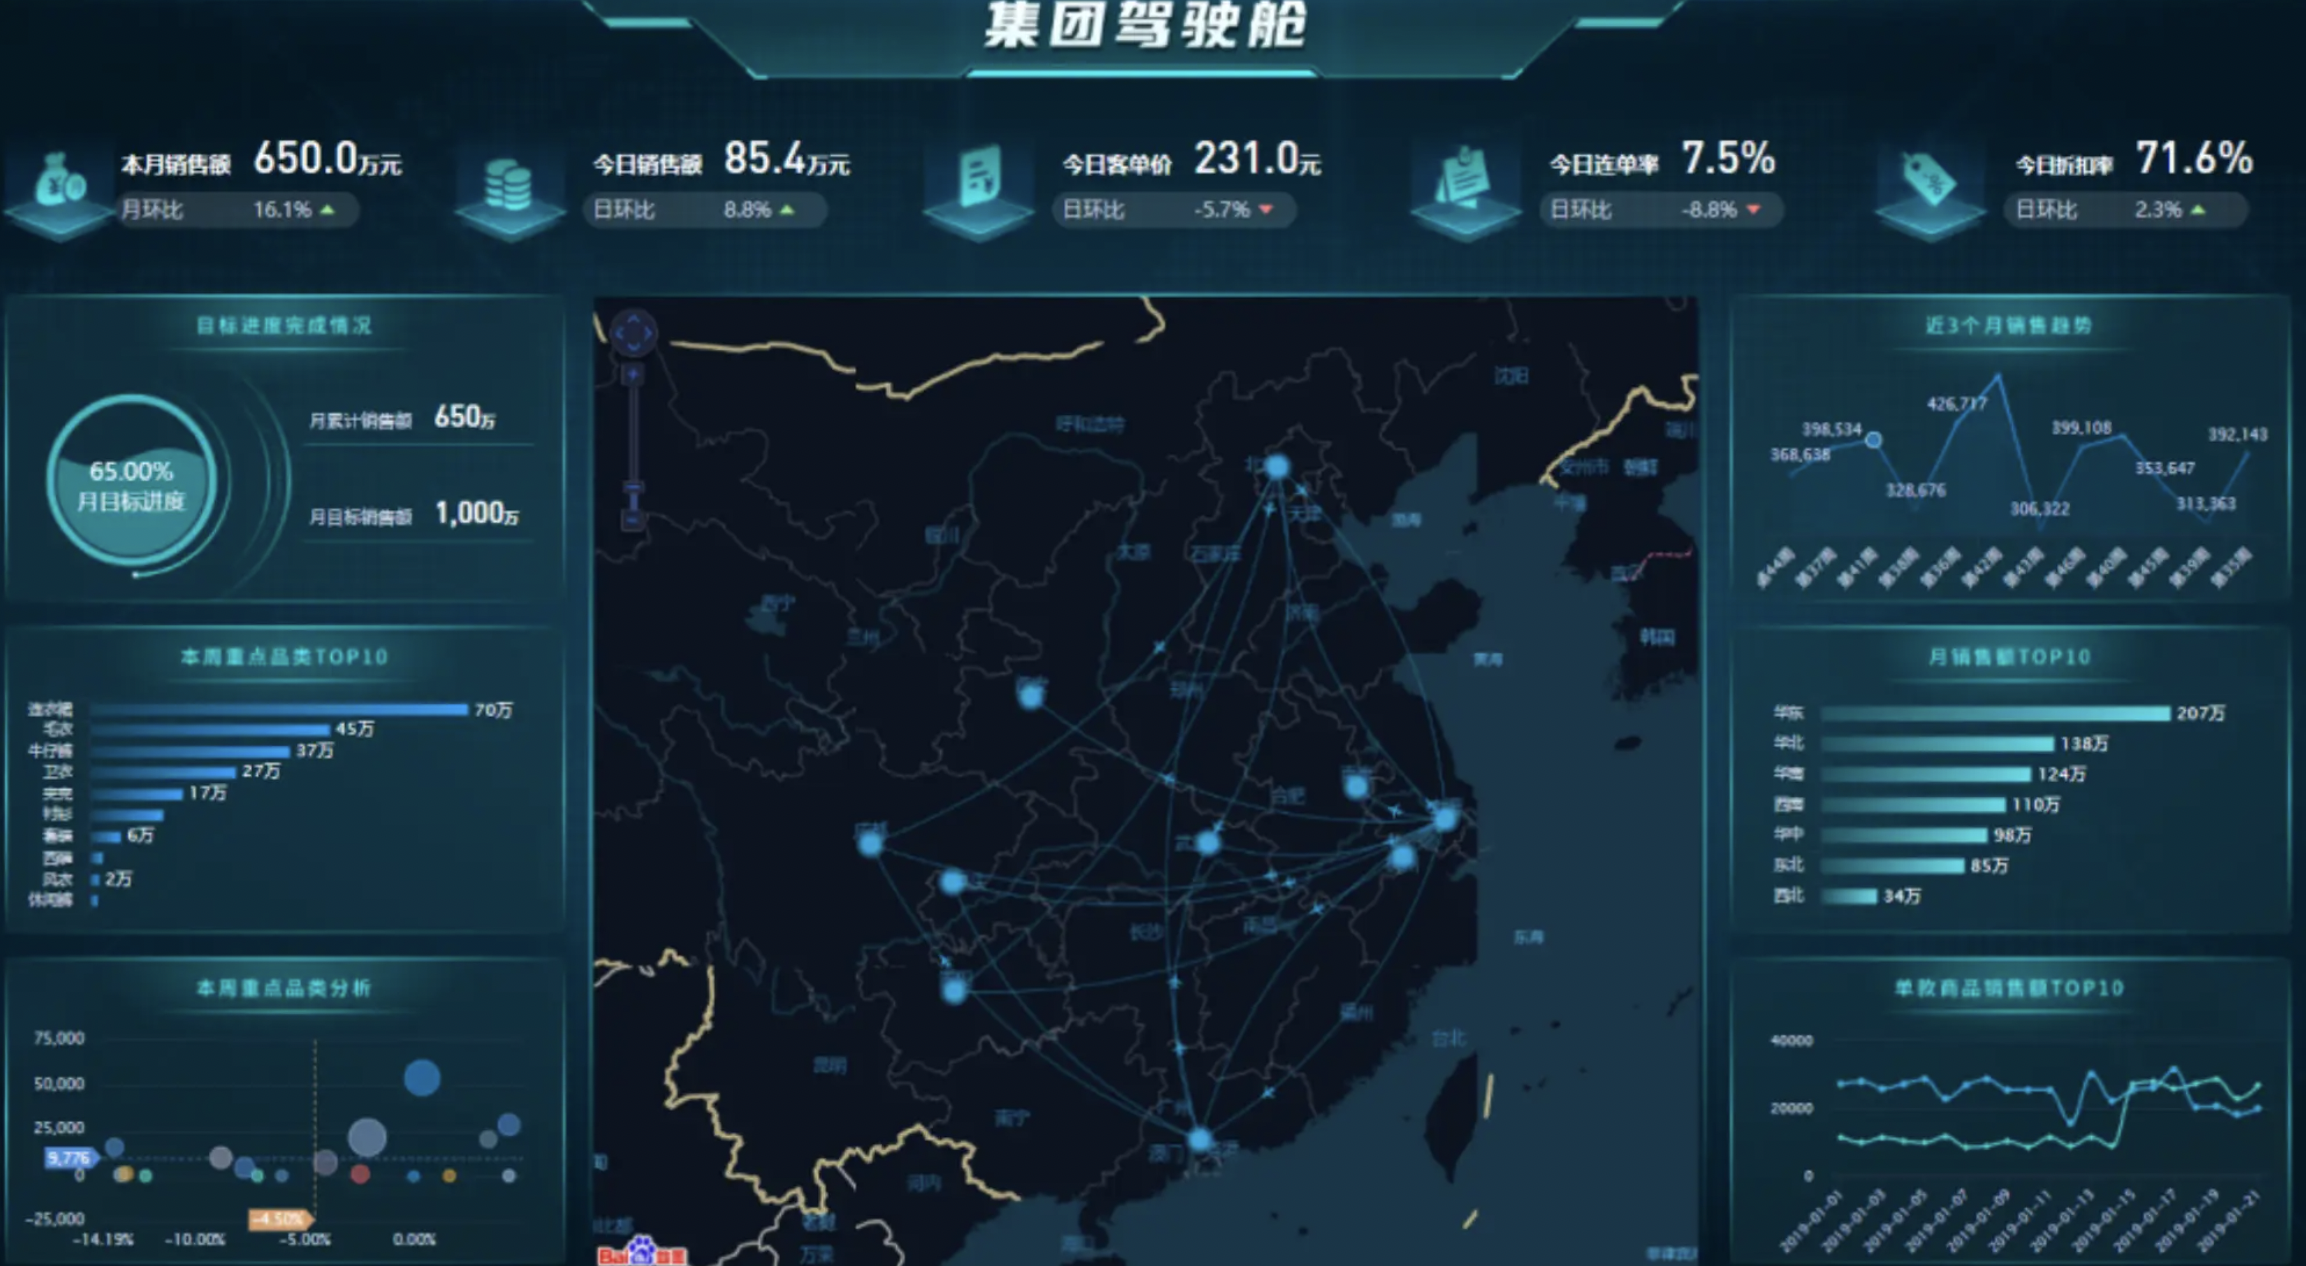
Data Screen
Guandata BI allows users to build cool data screens with zero code, providing direct, visual analysis results for business personnel and decision-makers, real-time monitoring of enterprise data, and more intuitive decision-making scenarios.
3.4. Enterprise-level Platform Foundation
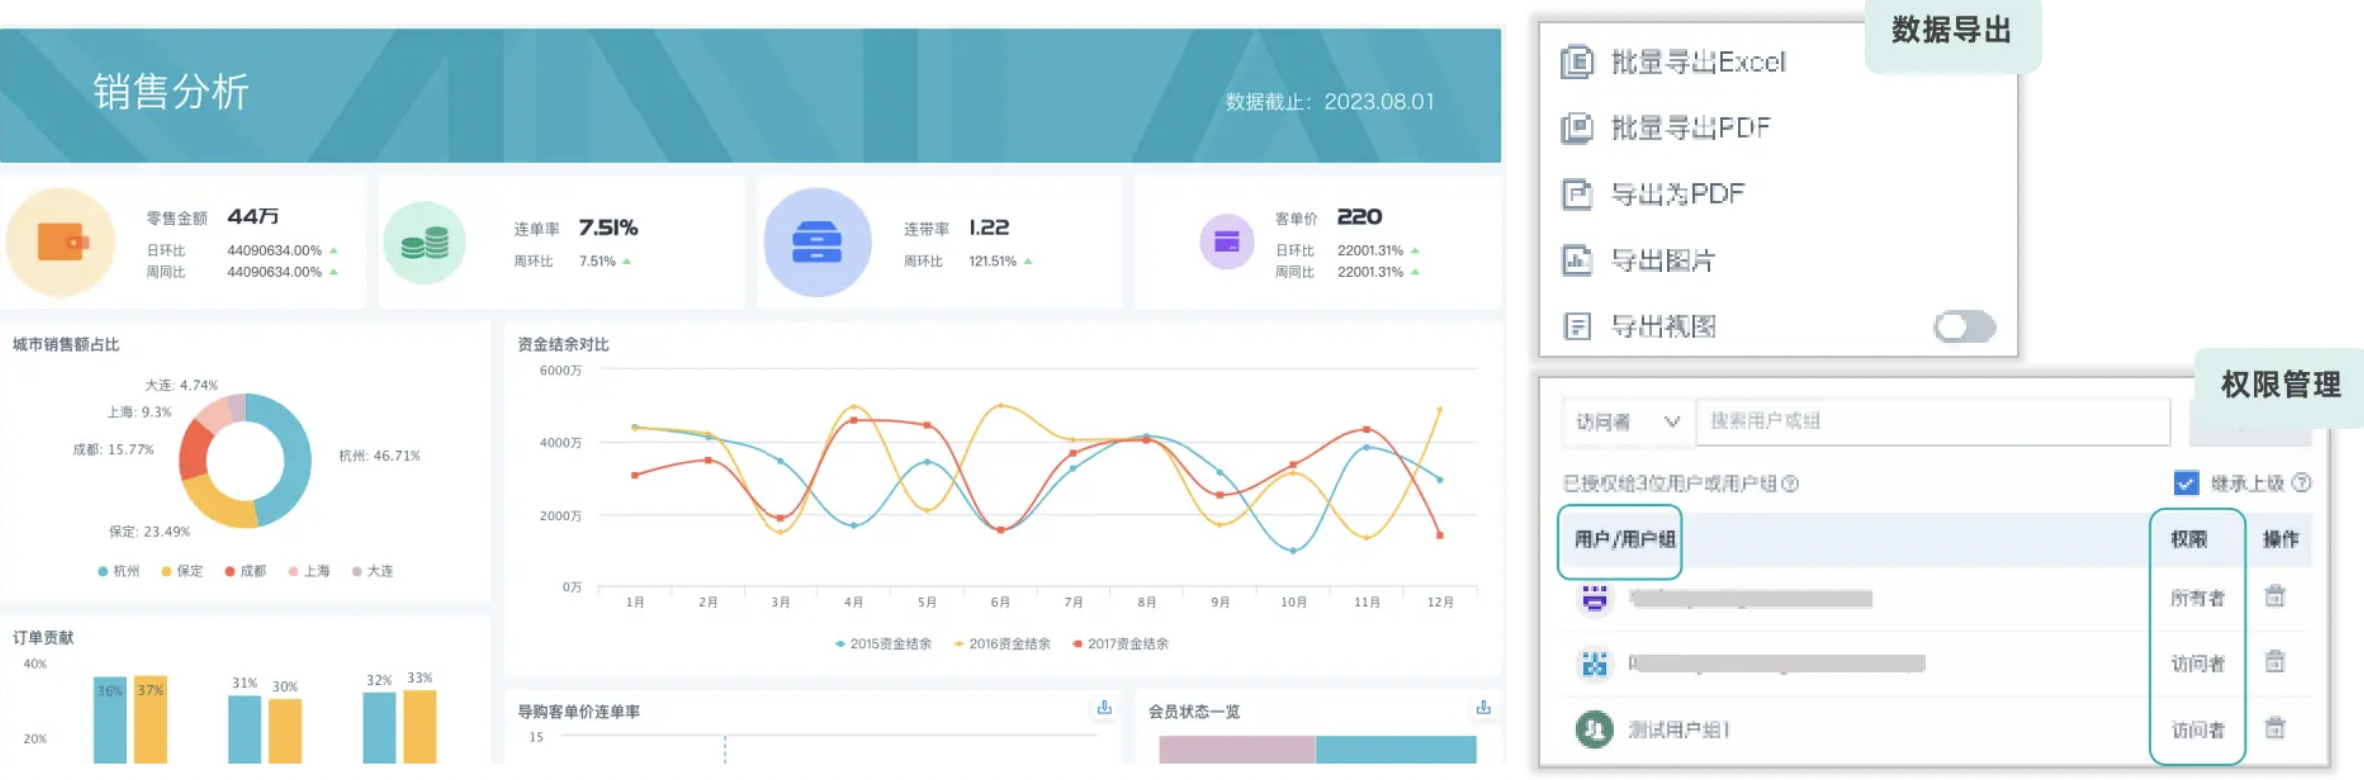
Report Generation and Export
Guandata BI supports exporting various data, such as chart data, dataset export, ETL result export; supports manual and scheduled export to FTP/SFTP, and large data volume export; supports disabling export/download to ensure data security.
Subscription & Alert
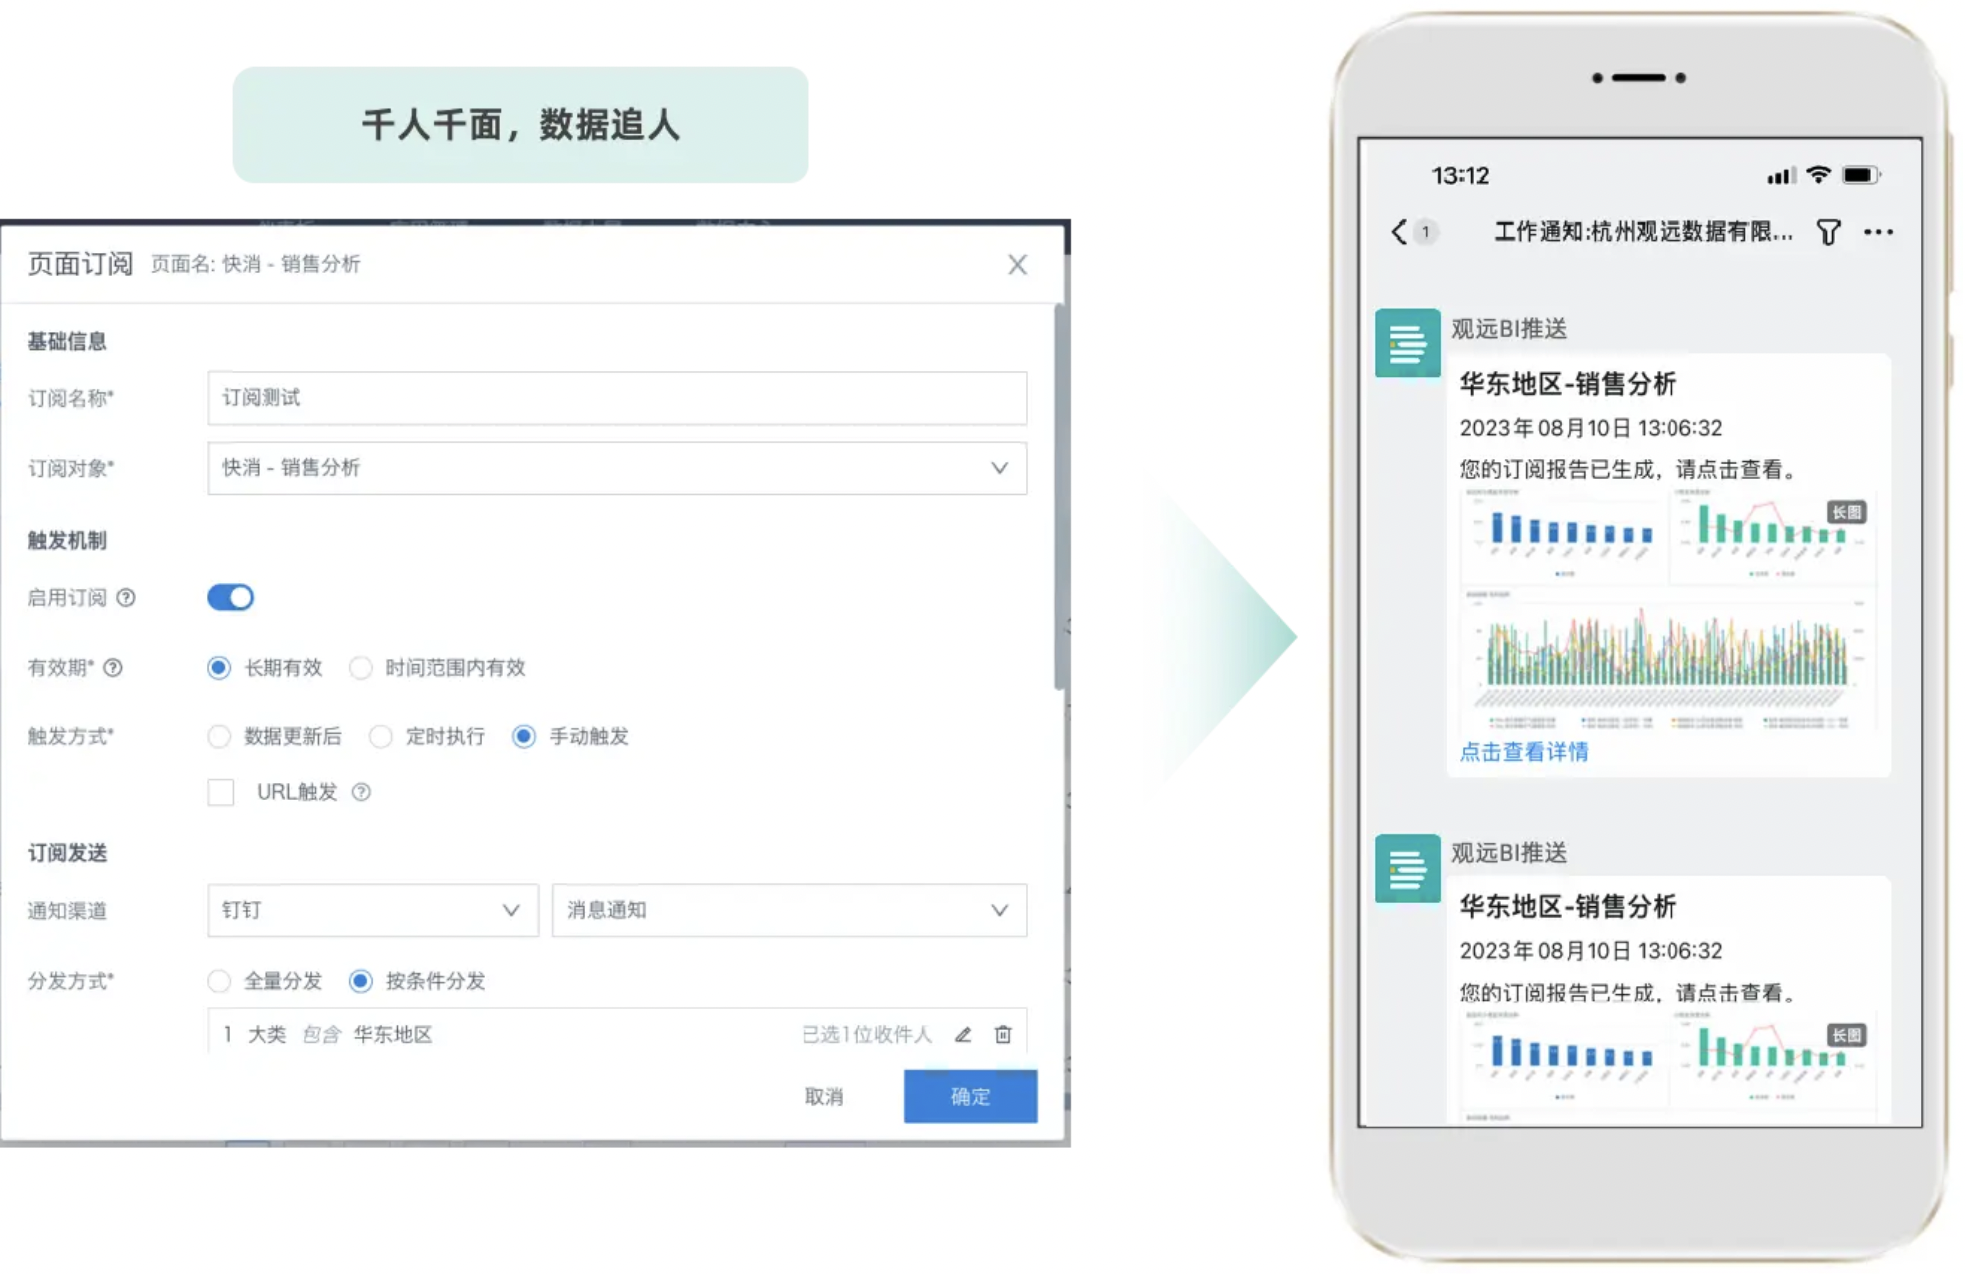
Subscription and alert is a personalized data notification feature, meeting real-time business indicator monitoring needs, widely used in risk control, real-time data acquisition, and indicator tracking. "Proactive data delivery" is the last step in data consumption and enterprise user integration.
- Subscription plan: Users can subscribe to specific charts, dashboards, or datasets, customize sending time, and receive results via email, WeCom, DingTalk, Feishu, Yunzhijia, etc. Email subscriptions support embedding images or PDF attachments. OA platforms support message push with page links. Supports periodic and data-update-triggered subscriptions.
- Risk alert: Users can customize alert trigger conditions for dimensions and indicators. When data meets abnormal conditions, the platform notifies users via email, WeCom, DingTalk, Feishu, Yunzhijia, etc., ensuring timely awareness of business risks and issues.
OA Integration
Supports H5 and integration with WeCom, DingTalk, Feishu, Yunzhijia, Fanwei OA, and other systems, providing SSO or password-free login, and third-party alert/subscription message push.
Cloud Inspection
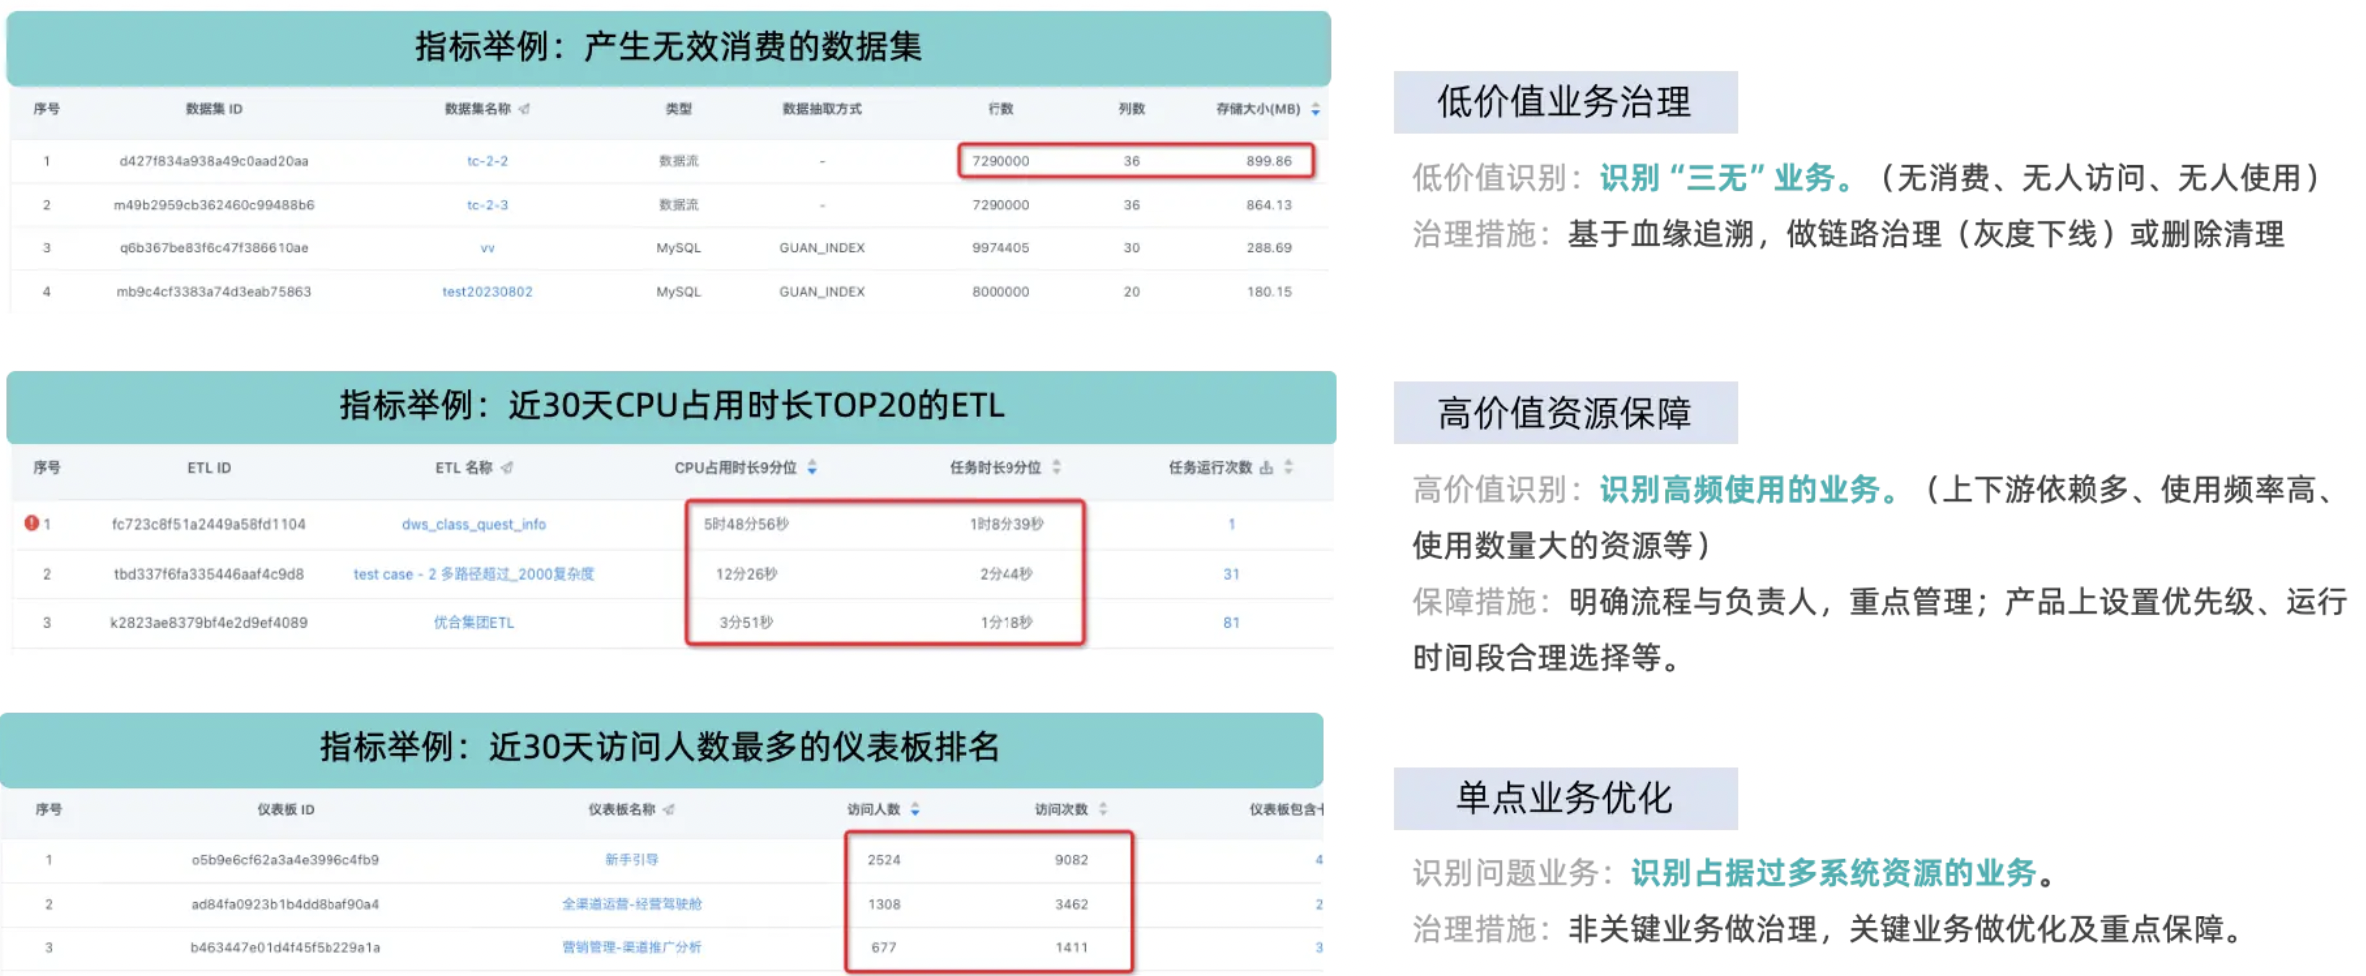
Cloud Inspection is an intelligent O&M service, providing visual inspection, problem diagnosis, and action suggestions for BI systems and business assets. Automatically generated visual reports help enterprises quickly identify and resolve issues, reduce O&M costs, and plan capacity in advance.
- Visual inspection report: Auto-generated visual diagnostic reports based on O&M data, with 100+ indicators, clear and beautiful content, and multiple report interpretation modes and action suggestions.
- System O&M interpretation: Provides cause analysis, troubleshooting, and optimization suggestions for common issues.
- Business governance interpretation: Includes resource usage and data asset management, providing analysis and optimization suggestions for datasets, ETL, dashboards, and cards.
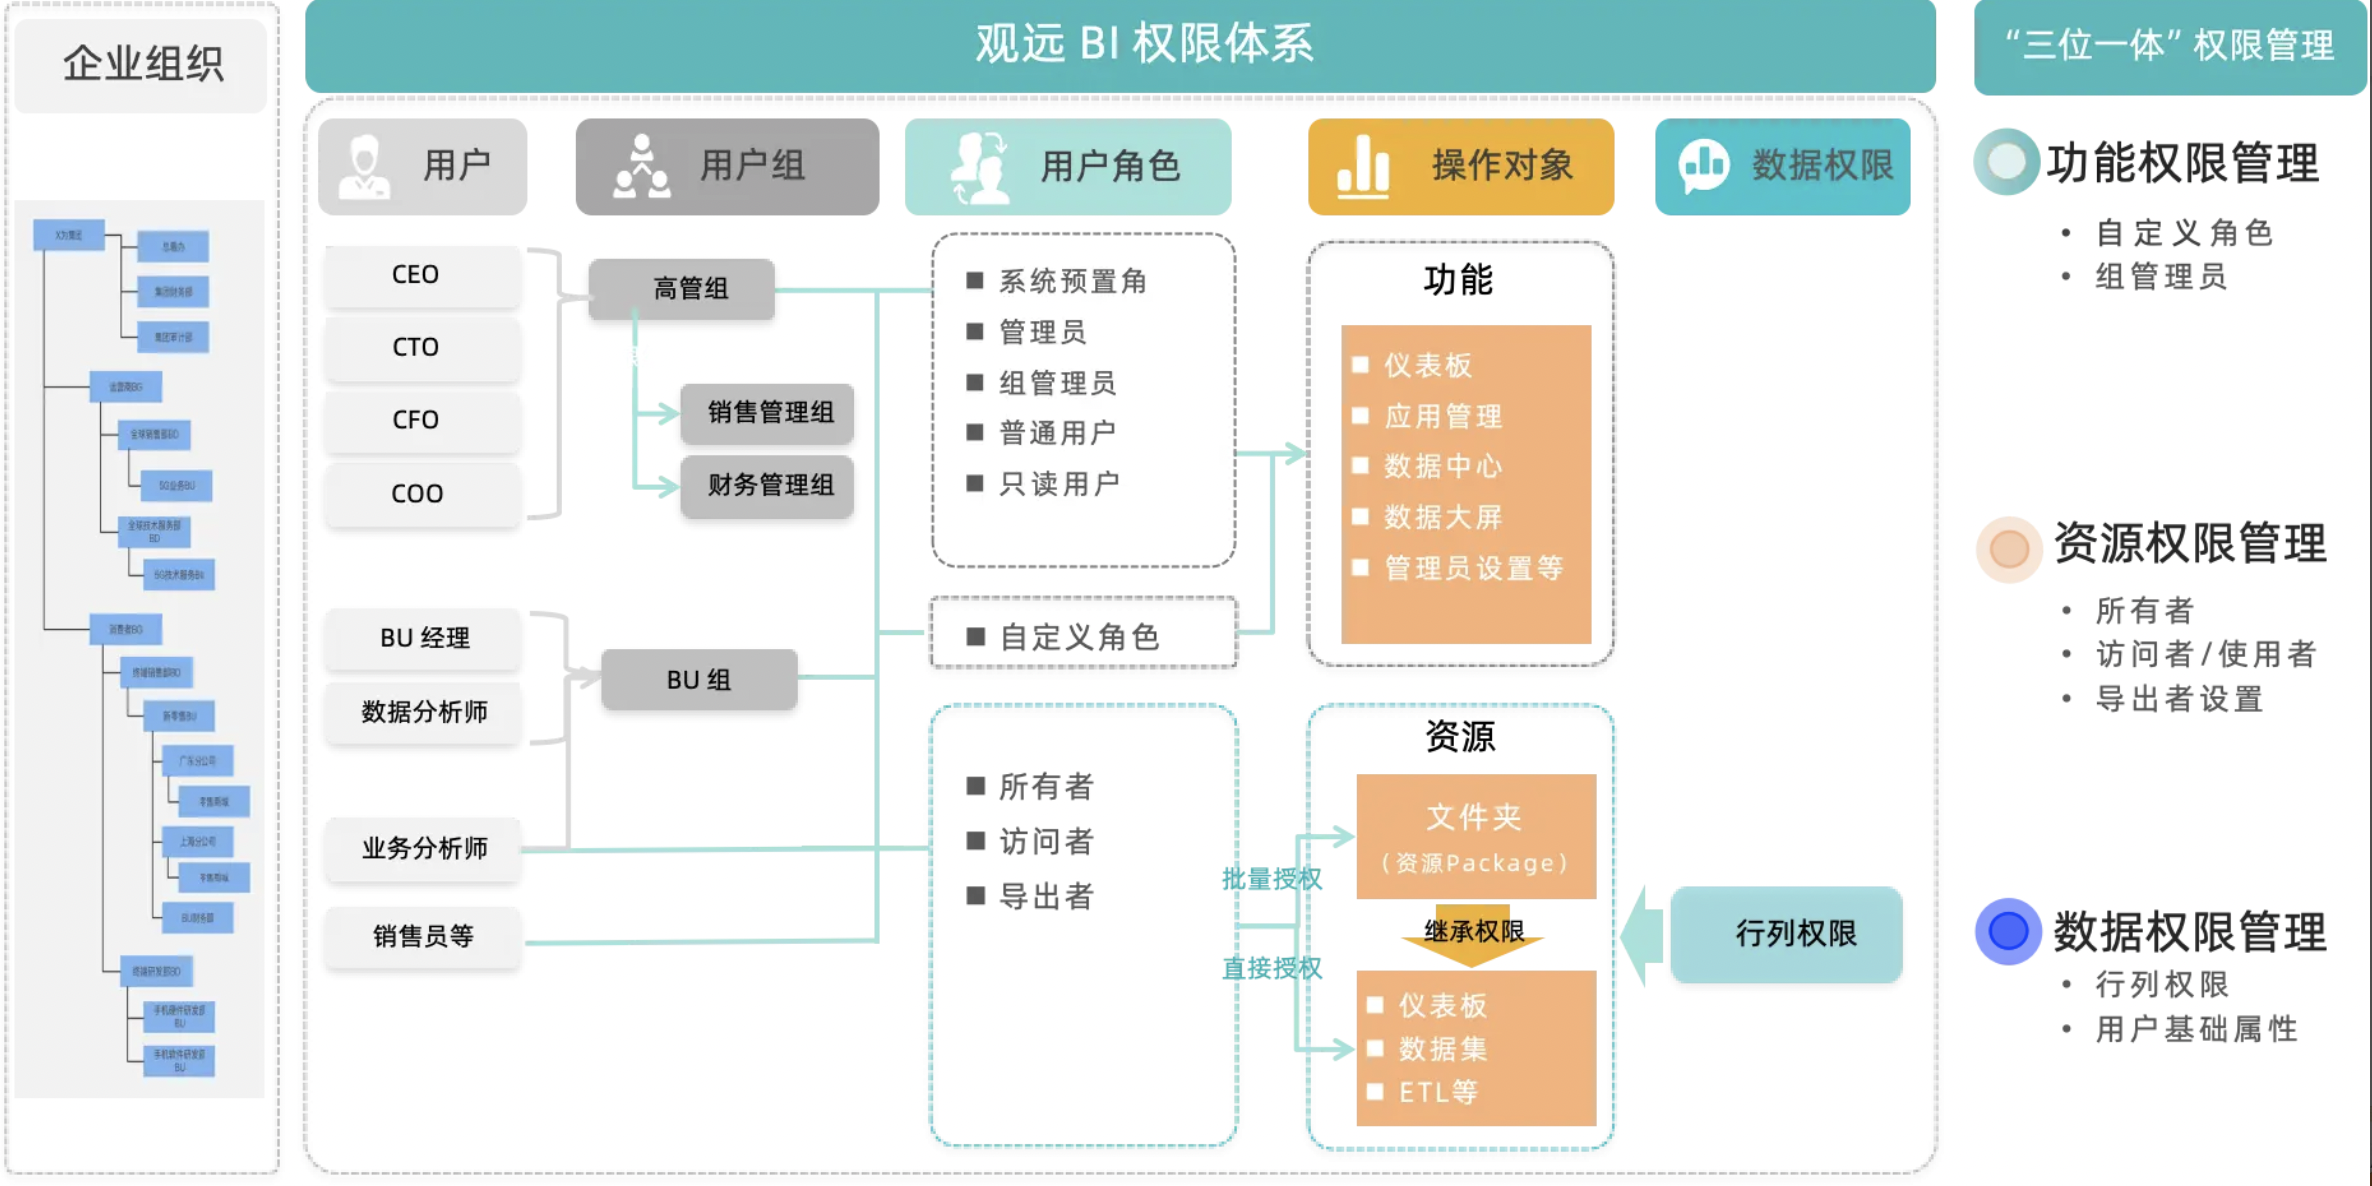
Enterprise-level Permission Management
Guandata BI supports role-based access control (RBAC), with three system roles (admin, user, read-only) and custom roles. Supports fine-grained access control for dashboards, datasets, folders, etc., and function permission control by role.
Platform O&M
Platform O&M refers to monitoring and management functions for overall platform operation, including task monitoring, management, resource monitoring, audit logs, O&M logs, notifications, service management, parameter configuration, and resource migration.
- Task monitoring: Monitors and manages all data processing tasks, including Smart ETL and datasets, and generates visual reports.
- Task management: View all tasks in the enterprise domain, manually cancel/stop abnormal tasks. Gantt chart module shows daily task status and duration for quick identification of peaks and bottlenecks.
- System management: Overall monitoring of system operation and resources, including resource monitoring, audit logs, O&M logs, notifications, etc.
- Parameter configuration: Global configuration of performance parameters for ETL, datasets, databases, etc.
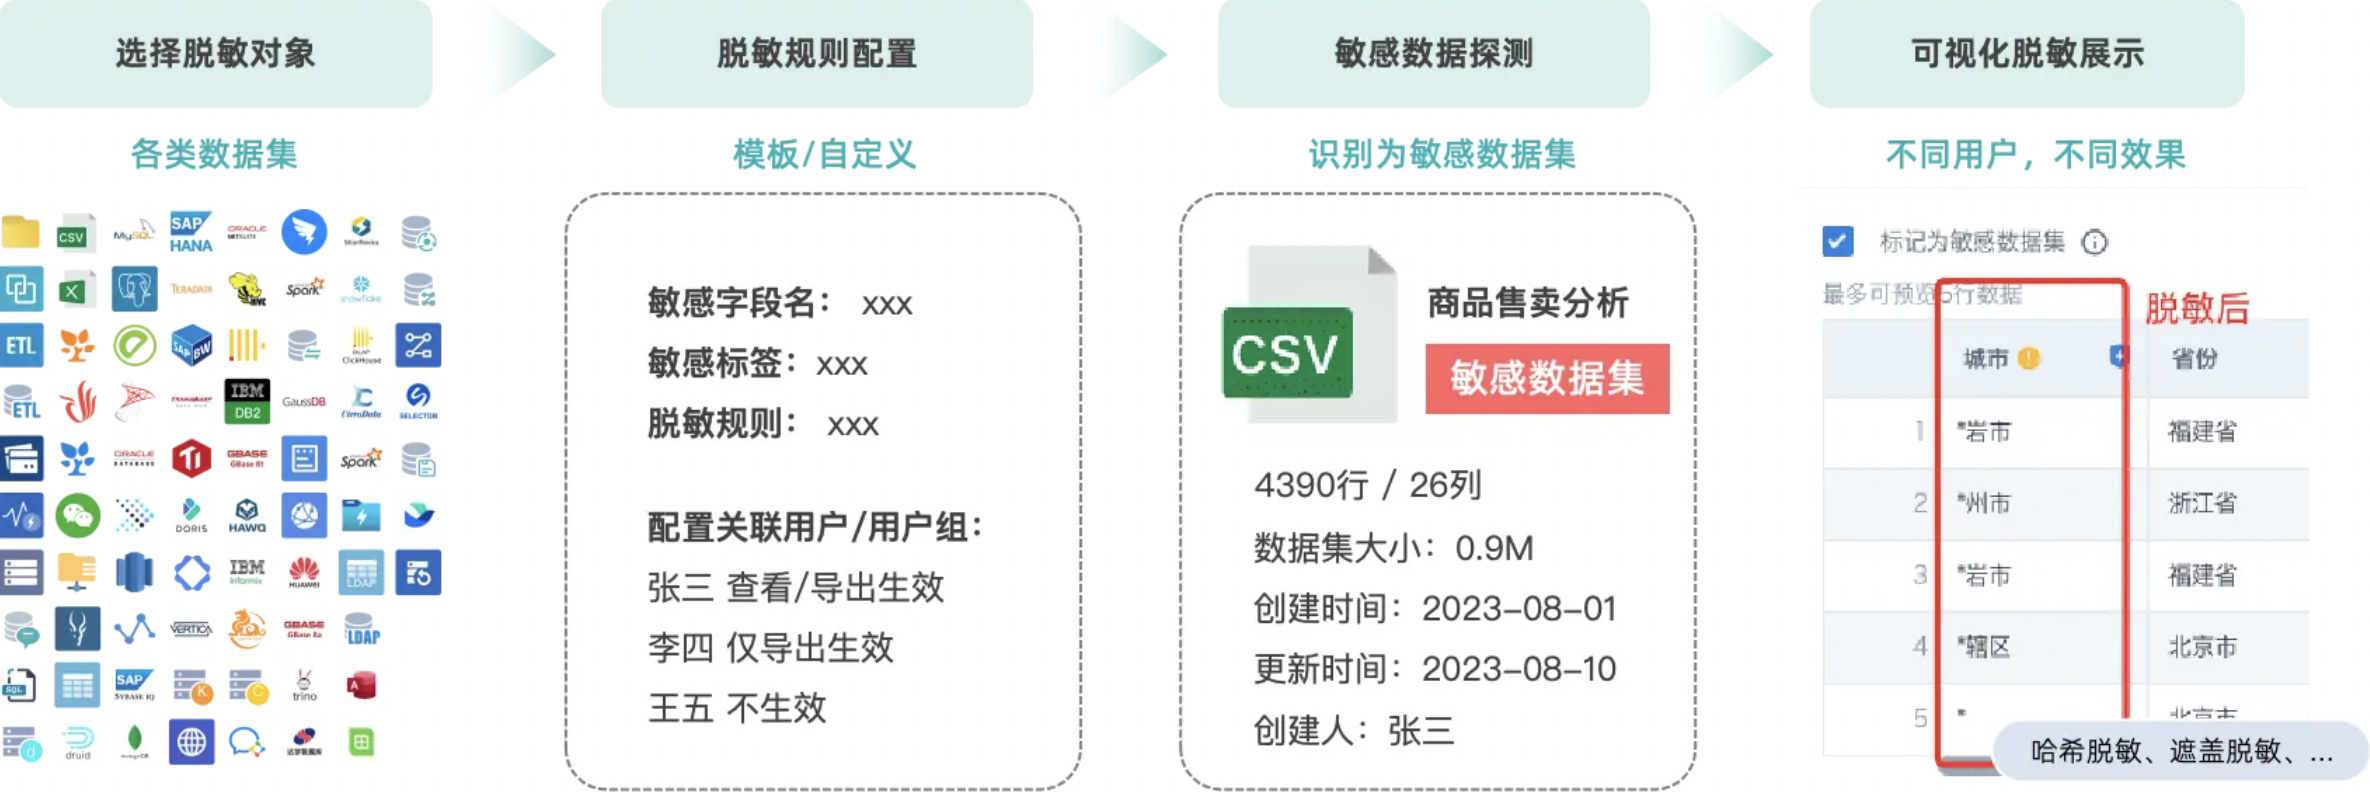
Data Masking
Guandata BI provides mature multi-segment sensitive information control, detecting and masking sensitive data at the field level to ensure privacy and security. Supports detection, rule configuration, and masking display at the visualization layer.
3.5. Enterprise-level Capability Add-ons
Multi-domain/Multi-tenant
Domain (tenant) definition: In Guandata BI, a domain is a logical unit for logical isolation of BI resources and content, improving management efficiency and meeting data/content security requirements.
- Applicable scenarios: For complex organizations (e.g., multiple subsidiaries), purchase multi-domain modules for data/resource isolation.
- Domain independence: Each domain has independent admin, user, permission, dataset, and report systems.
- Domain relationships: Resources are isolated by default; use offline migration for resource reuse.
- Domain quantity: Supported number depends on available resources, generally no more than 10.
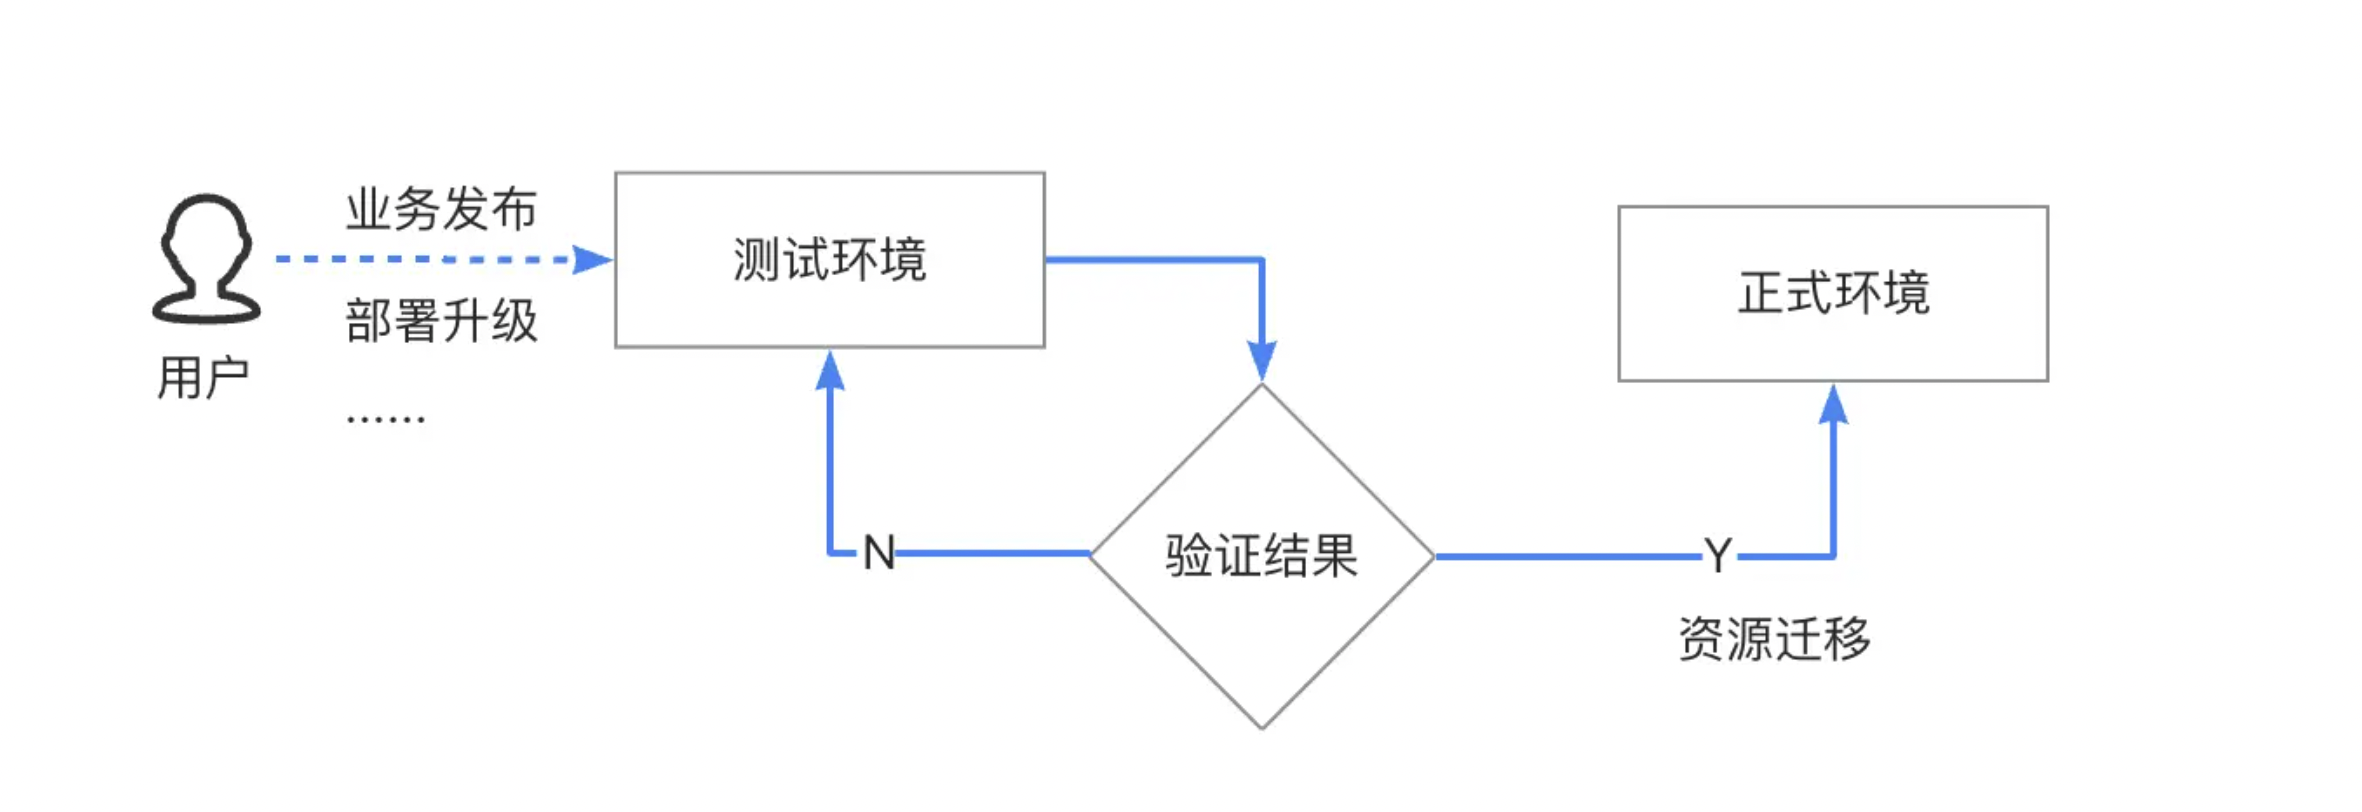
Test Environment
Guandata BI test environment is an independent environment isolated from production, used for quality verification, integration development, parameter modification, data/report/dashboard development and validation, and UAT. Hardware config should match production for performance testing; license and modules are independent; supports cluster/high-availability config; network connectivity recommended for online migration.
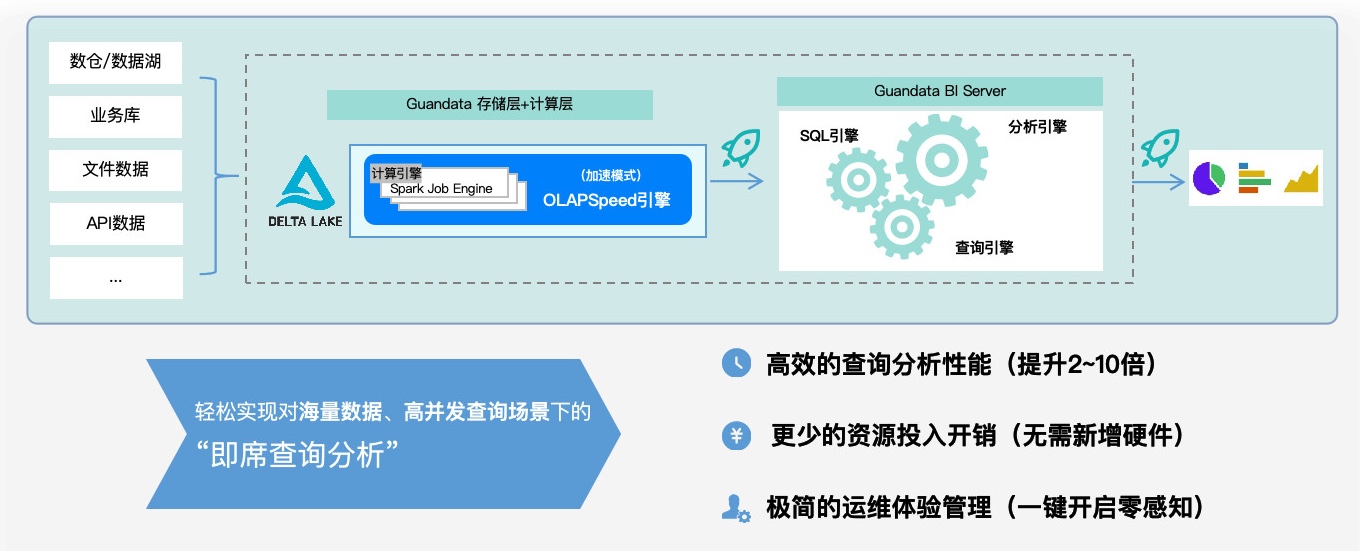
OLAPSpeed Acceleration Engine
Traditional engines are slow with massive data and complex scenarios, affecting decision-making and analysis efficiency. Guandata uses vectorization to upgrade the Spark engine, releasing OLAPSpeed for card query acceleration, improving query efficiency by 2-10x without extra hardware.
Note: OLAPSpeed is supported in version 7.0 and above.
Multi-language
System UI, dashboards, and card data support one-click language switching, including Chinese, English, and other languages, for seamless global collaboration and improved analysis efficiency and user experience. More languages and chart types will be added in the future.
High-performance Cluster Expansion
Guandata BI supports flexible deployment, including single-node and multi-node (clustered) deployment. Cluster expansion improves engine performance and concurrency by adding server nodes.
Three-node High Availability
With growing data, BI must ensure system stability. Guandata uses containerized deployment with self-recovery, all components are non-single-point, core modules support multi-replica, improving stability and availability.
High-availability architecture reduces system crash impact:
Guandata's overall architecture is designed for high availability, using K8s, MySQL, Cassandra, Postgresql, MinIO, Spark, Guandata-Server, etc. on K8s. When a node fails, K8s reschedules pods to other nodes, ensuring normal service and minimizing user impact.
Cluster expansion includes:
- Complex balanced cluster: For high request volume and stability, distributes requests across servers for load balancing.
- Database cluster: For efficient data processing and management, deploys multiple databases for distributed storage and processing.
- File storage cluster: For large-scale storage and high-performance access, distributes files across servers for redundancy and fast I/O.
- Compute cluster: For high compute needs, uses parallel/distributed computing for fast large-scale processing.
Note: These can be deployed via major cloud providers or on-premises.
Data Backup
Guandata BI provides data backup to prevent data loss:
Both cloud and on-premises deployments offer backup. For example, Guandata Cloud provides:
- Scheduled backups: Regular snapshots and backups of business databases, with monitoring to ensure integrity.
- Cloud platform snapshots: Cloud platforms provide scheduled snapshots for data security and recovery.
Hadoop & Databricks Integration
Guandata BI is cloud-native and deeply integrates Hadoop and Databricks. Supports tens of thousands of users and tens of billions of data for enterprise-scale business. Cloud-native + big data enables unlimited expansion at low cost, avoiding frequent reconstruction/migration.
Guandata BI deeply integrates Hadoop for compute/storage management, leveraging Hadoop's high availability, scalability, and fault tolerance for enterprise-level big data analysis. Supports 300+ server clusters and tens of thousands of CPU cores, with unlimited horizontal expansion and massive users.