Use Cases
Guandata BI provides targeted data empowerment for different roles, helping enterprises achieve end-to-end digital management from strategic decision-making to frontline execution.
Decision-Makers: Strategic Insight and Full Visibility
Applicable roles: CEO, general manager, business unit leader, and senior headquarters leaders in strategy, operations, and finance
Scenario value: helps decision-makers gain a full picture of business performance, identify trends and risks, and drive strategic decisions
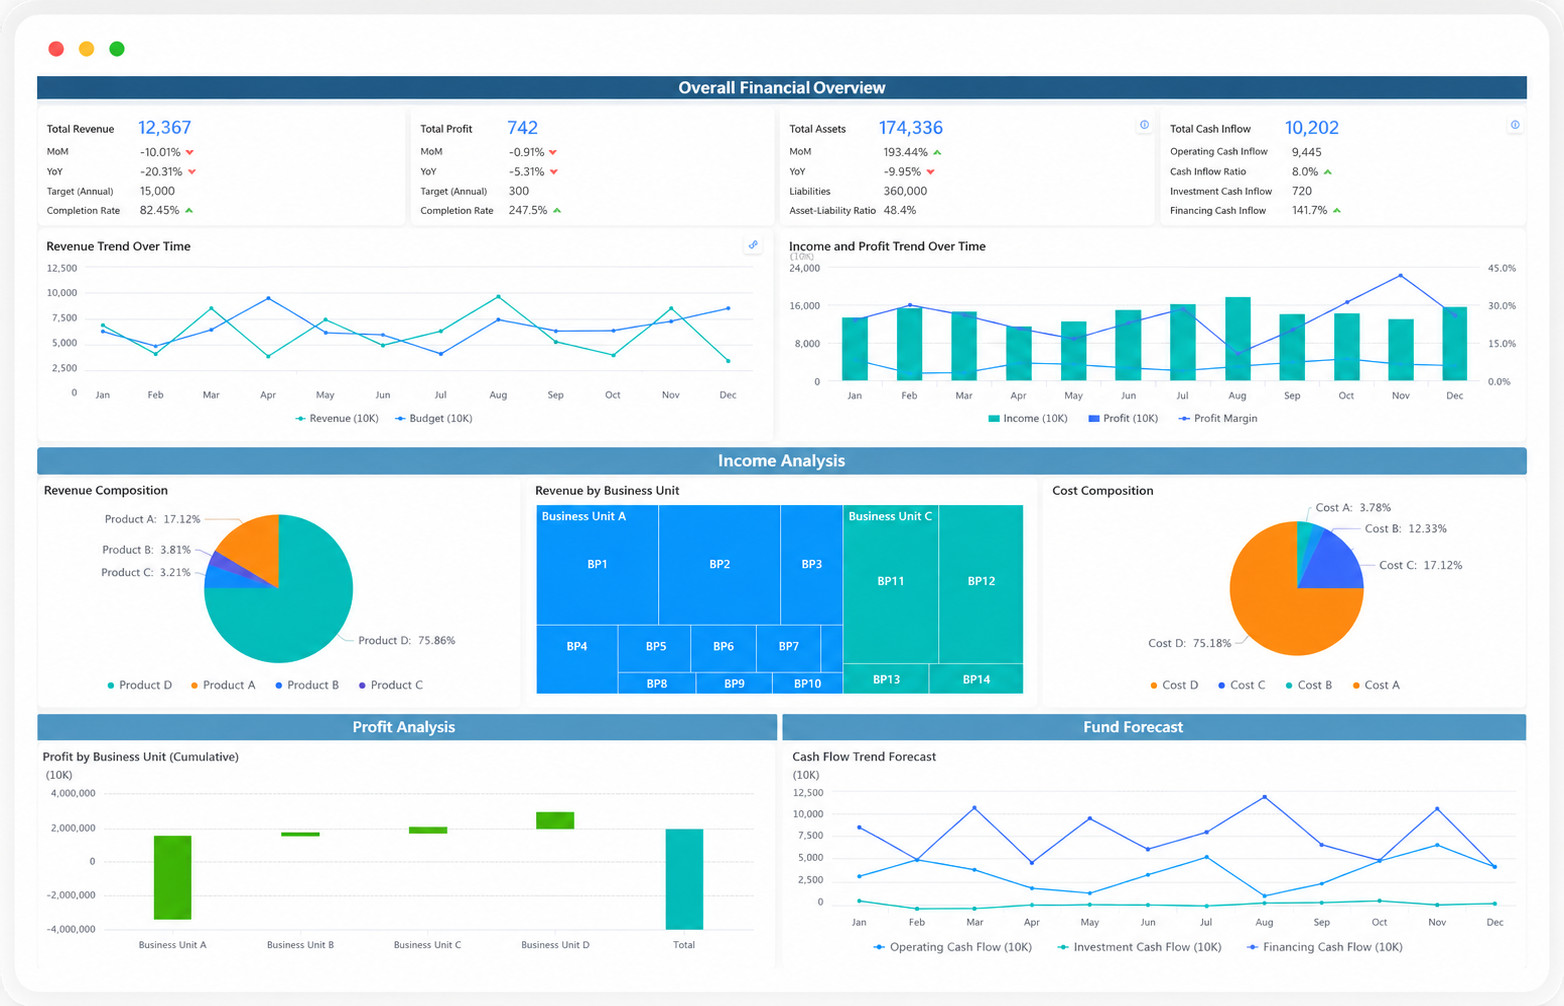
Overall Business Insight
- Scenario description: Through a unified management cockpit, decision-makers can monitor core KPIs across the group and business lines in real time on multiple devices, such as revenue, profit, profit margin, and cash flow. Automatic alerts and tracking of key indicators support "one-board" style management.
- Typical applications:
- Global monitoring: open the cockpit every day and understand the overall health of the business in 10 minutes.
- Performance benchmarking: compare target achievement and growth across business units and subsidiaries.
- Strategic target tracking: visually track progress toward annual strategic goals such as market share and new customer growth.
Operational Analysis and Performance Attribution
- Scenario description: When core indicators fluctuate, preset multi-dimensional, drill-down, and linked analysis models help users quickly locate root causes and move from understanding "what happened" to understanding "why it happened."
- Typical applications:
- Performance fluctuation attribution: analyze whether a national sales decline is caused by weakness in East China or by the decline of a core product line.
- Profit driver analysis: identify whether profit growth is mainly driven by lower costs, higher prices, or product mix optimization.
- Strategic topic analysis: conduct in-depth assessments of topics such as the effectiveness of new retail transformation or channel expansion strategies.
Management: Business and Financial Analysis with Refined Operations
Applicable roles: leaders and managers in sales, marketing, supply chain, finance, HR, product, operations, and similar functions
Scenario value: helps managers dive into business details, operate with greater precision, and achieve departmental goals
Sales and Marketing Analysis
- Scenario description: comprehensively analyze sales performance, customer value, and marketing ROI to guide precise resource allocation and strategy optimization.
- Typical applications:
- Internet and retail: user acquisition, retention, and conversion funnel analysis; channel effectiveness evaluation; GMV and average order value monitoring
- Finance: customer AUM analysis, churn alerts, and customer lifecycle value management
- Manufacturing and consumer goods: distributor performance management, sales forecasting and target achievement analysis, and promotion spending effectiveness analysis
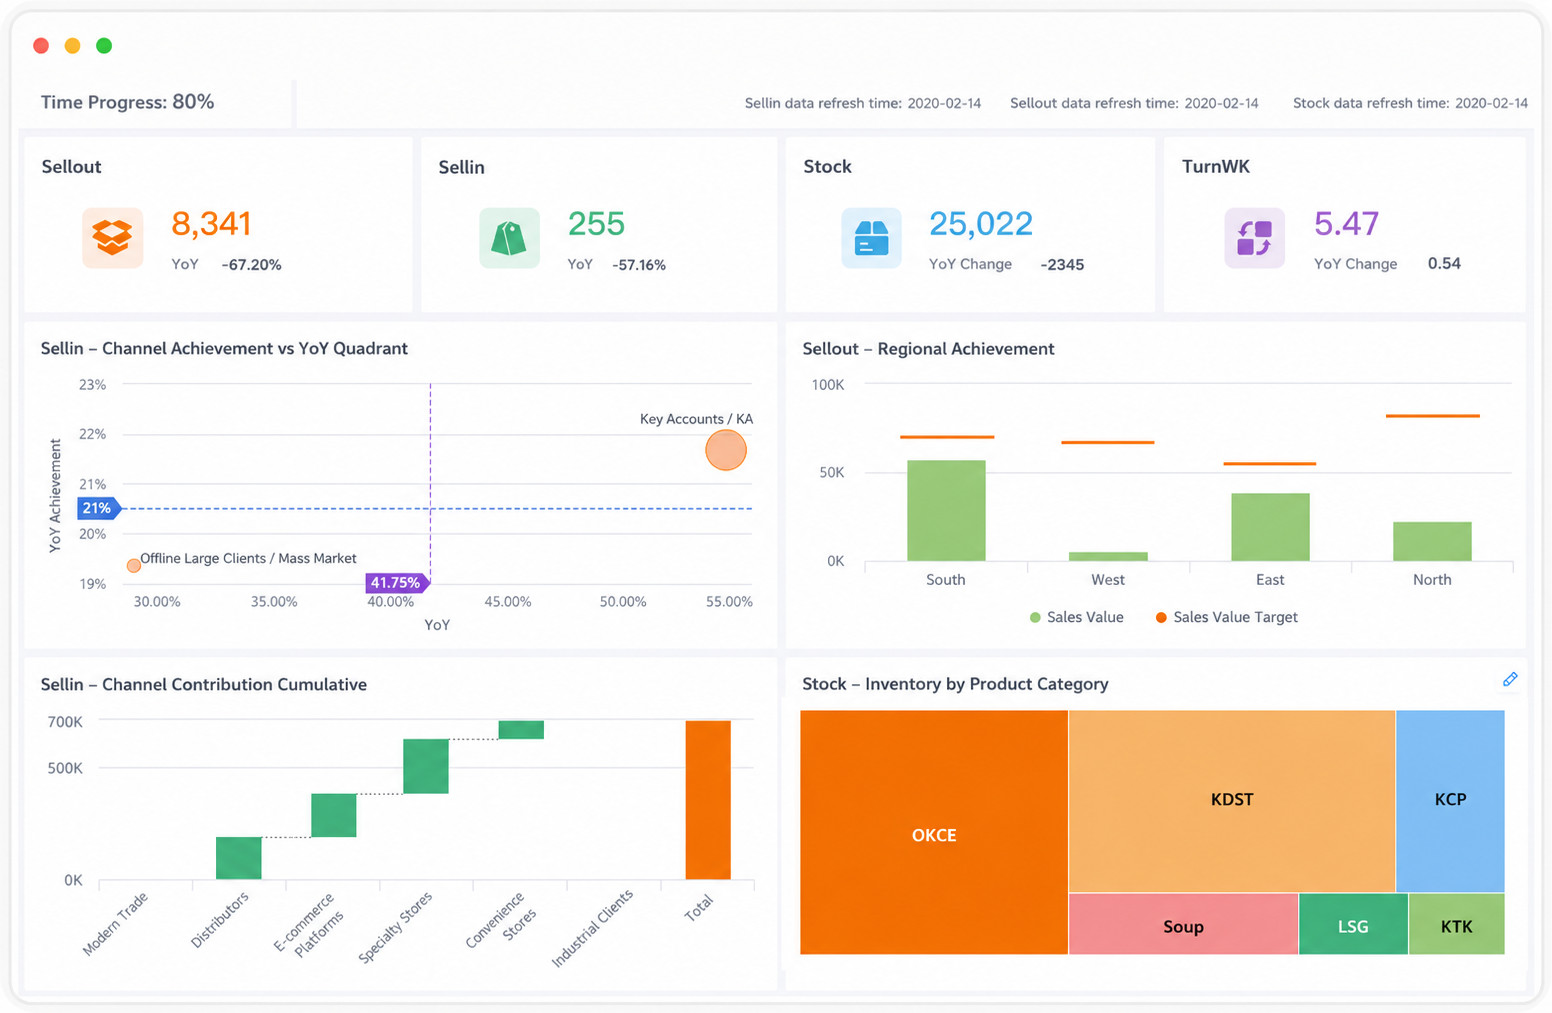
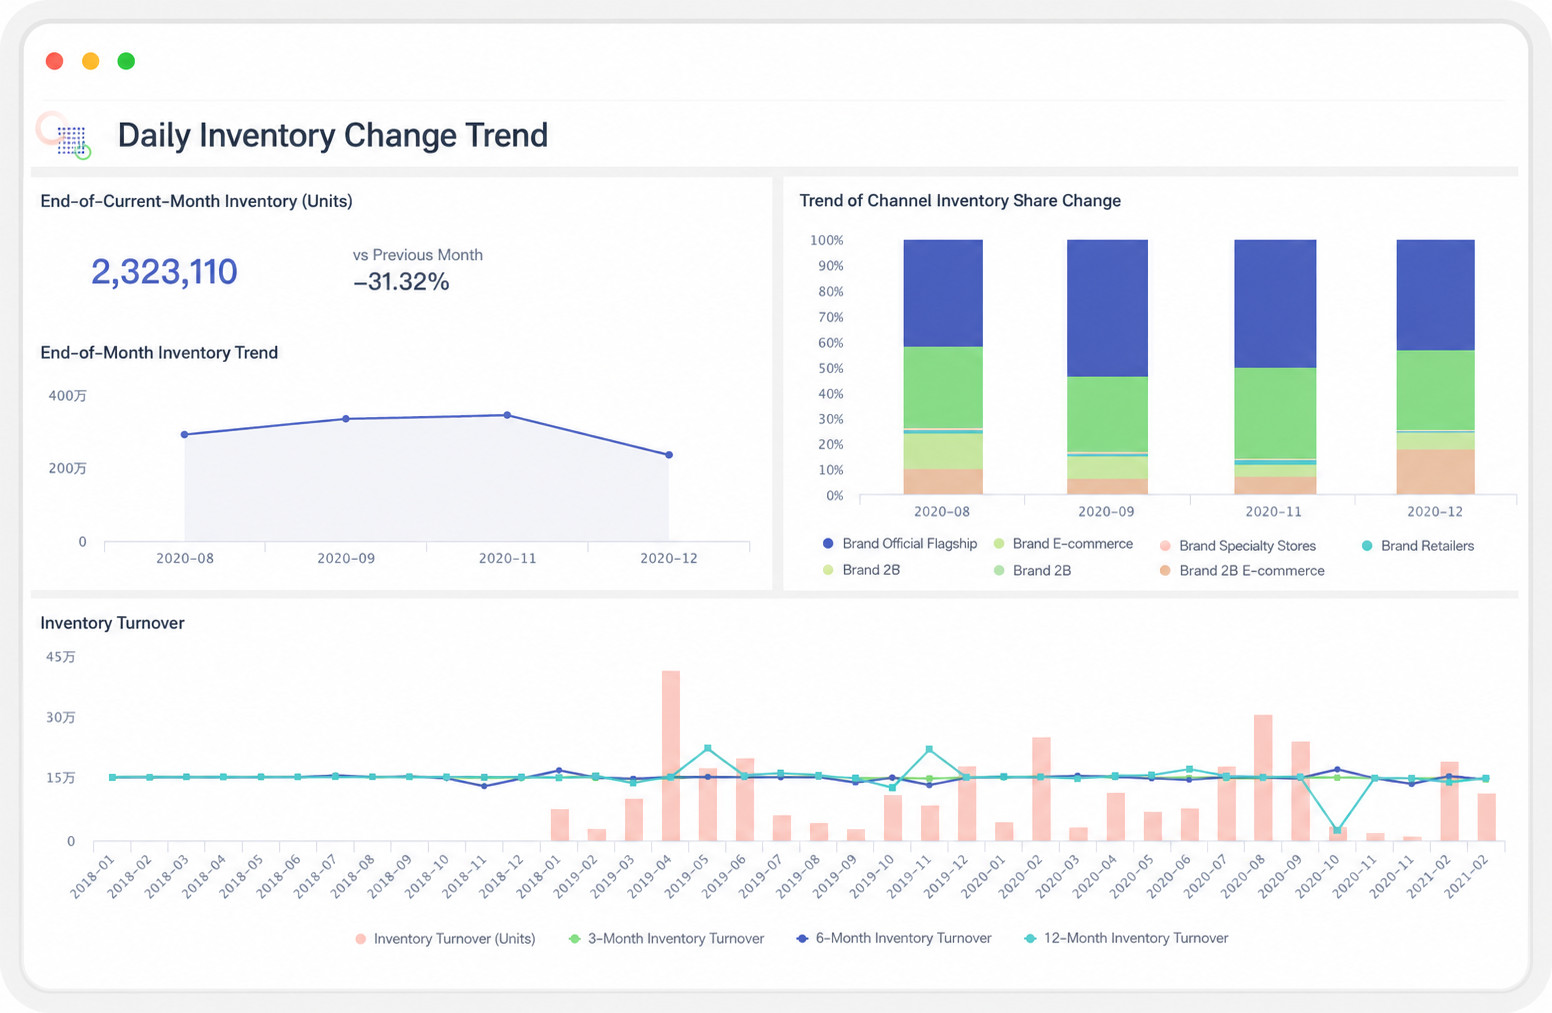
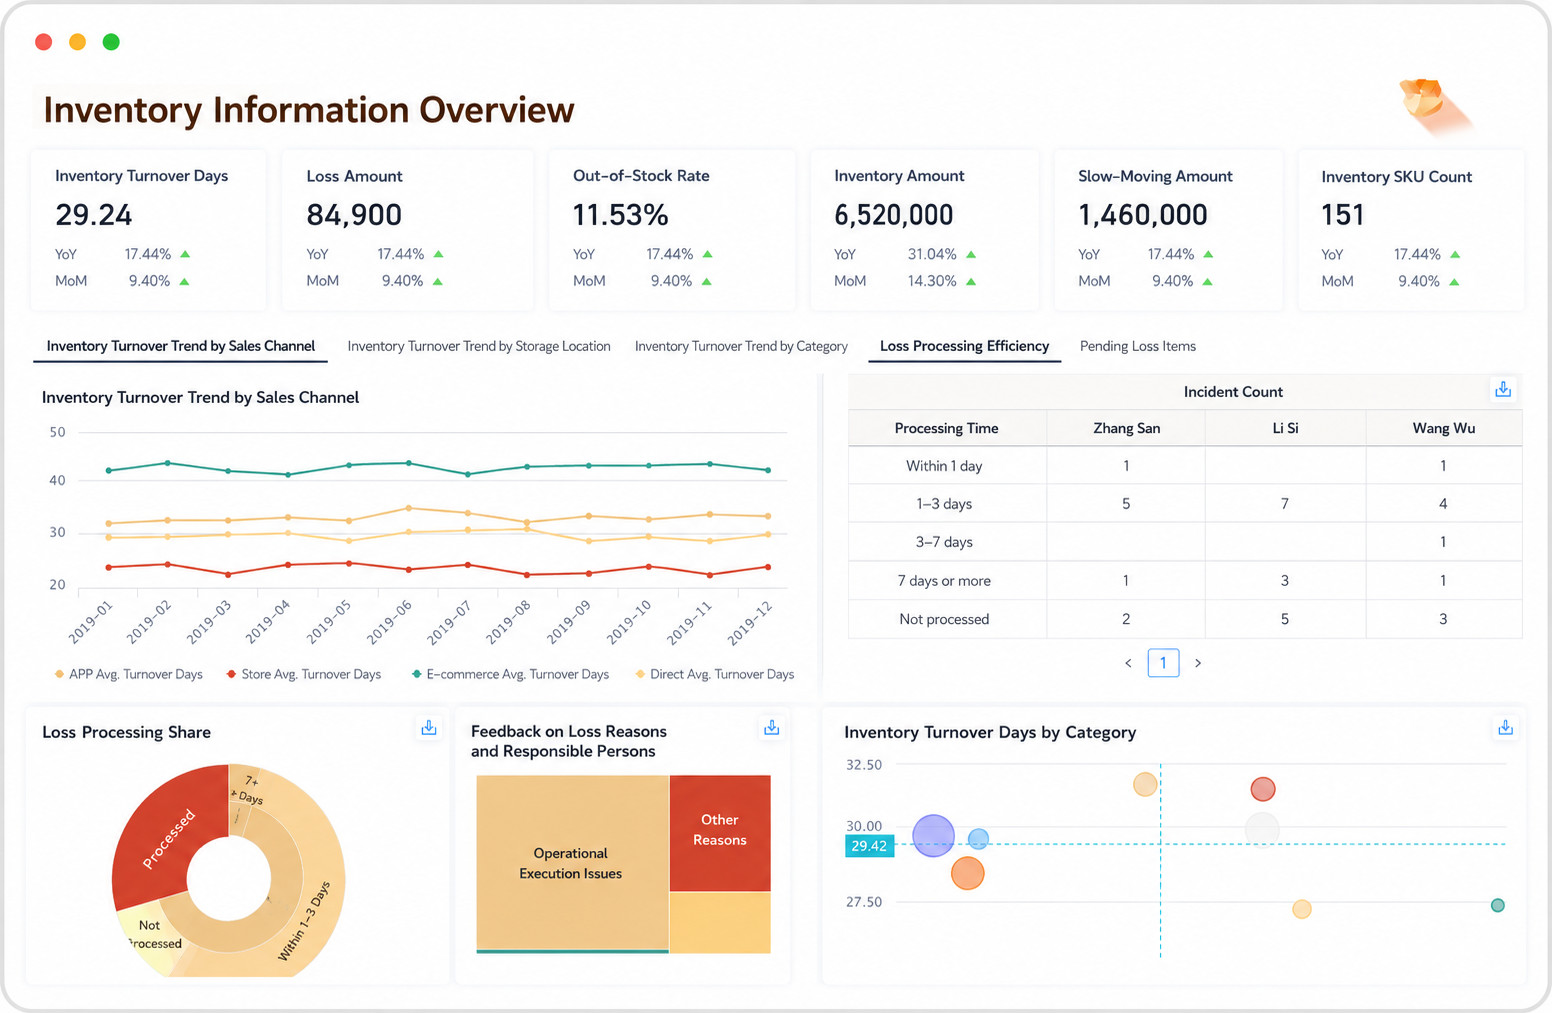
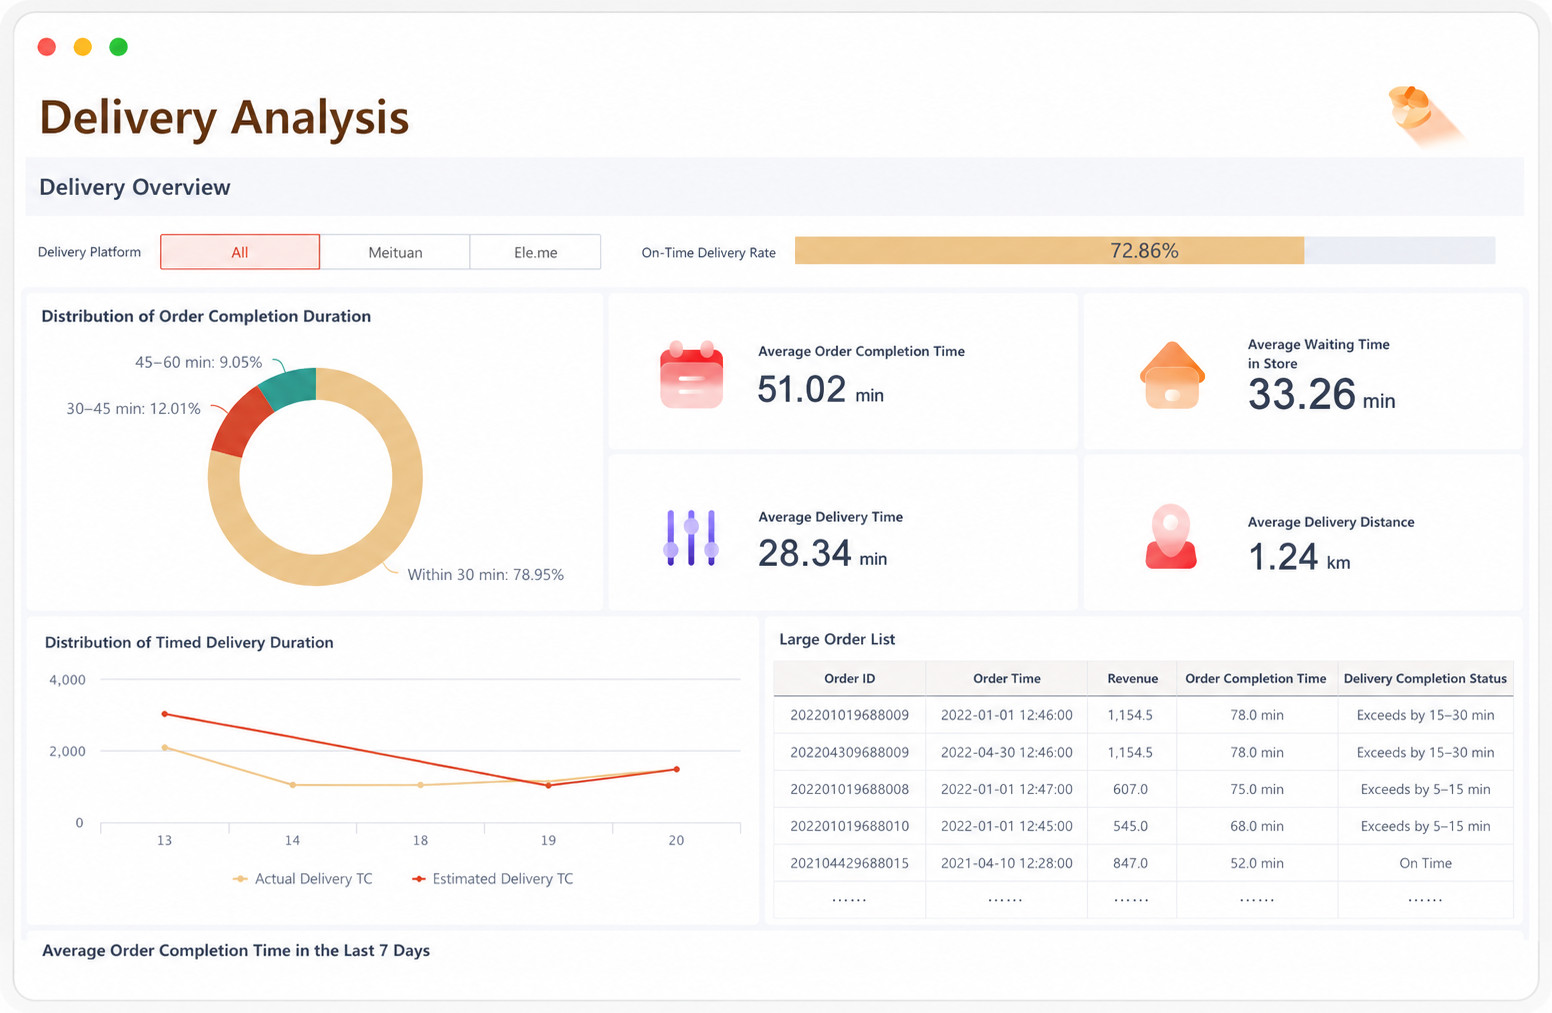
Supply Chain and Inventory Analysis
- Scenario description: monitor efficiency and cost across the entire chain from procurement and production to warehousing and distribution, and maintain optimal inventory levels.
- Typical applications:
- Retail and consumer goods: dynamic safety stock calculation, inventory turnover and aging analysis, and intelligent replenishment recommendations
- Manufacturing: raw material completeness monitoring, work-in-process inventory analysis, and supplier on-time delivery analysis
Integrated Business and Financial Analysis
- Scenario description: connect business data and financial data to create transparent mapping from business drivers to financial outcomes, enabling more accurate budgeting and cost control.
- Typical applications:
- All industries: real-time accounting and alerts for revenue, cost, and expenses; budget execution tracking; profit center contribution analysis
- State-owned enterprises: automatic calculation and reporting of key state-owned asset supervision indicators such as the "two profits and four ratios"
- Internet businesses: project-based or campaign-based cost accounting and ROI analysis
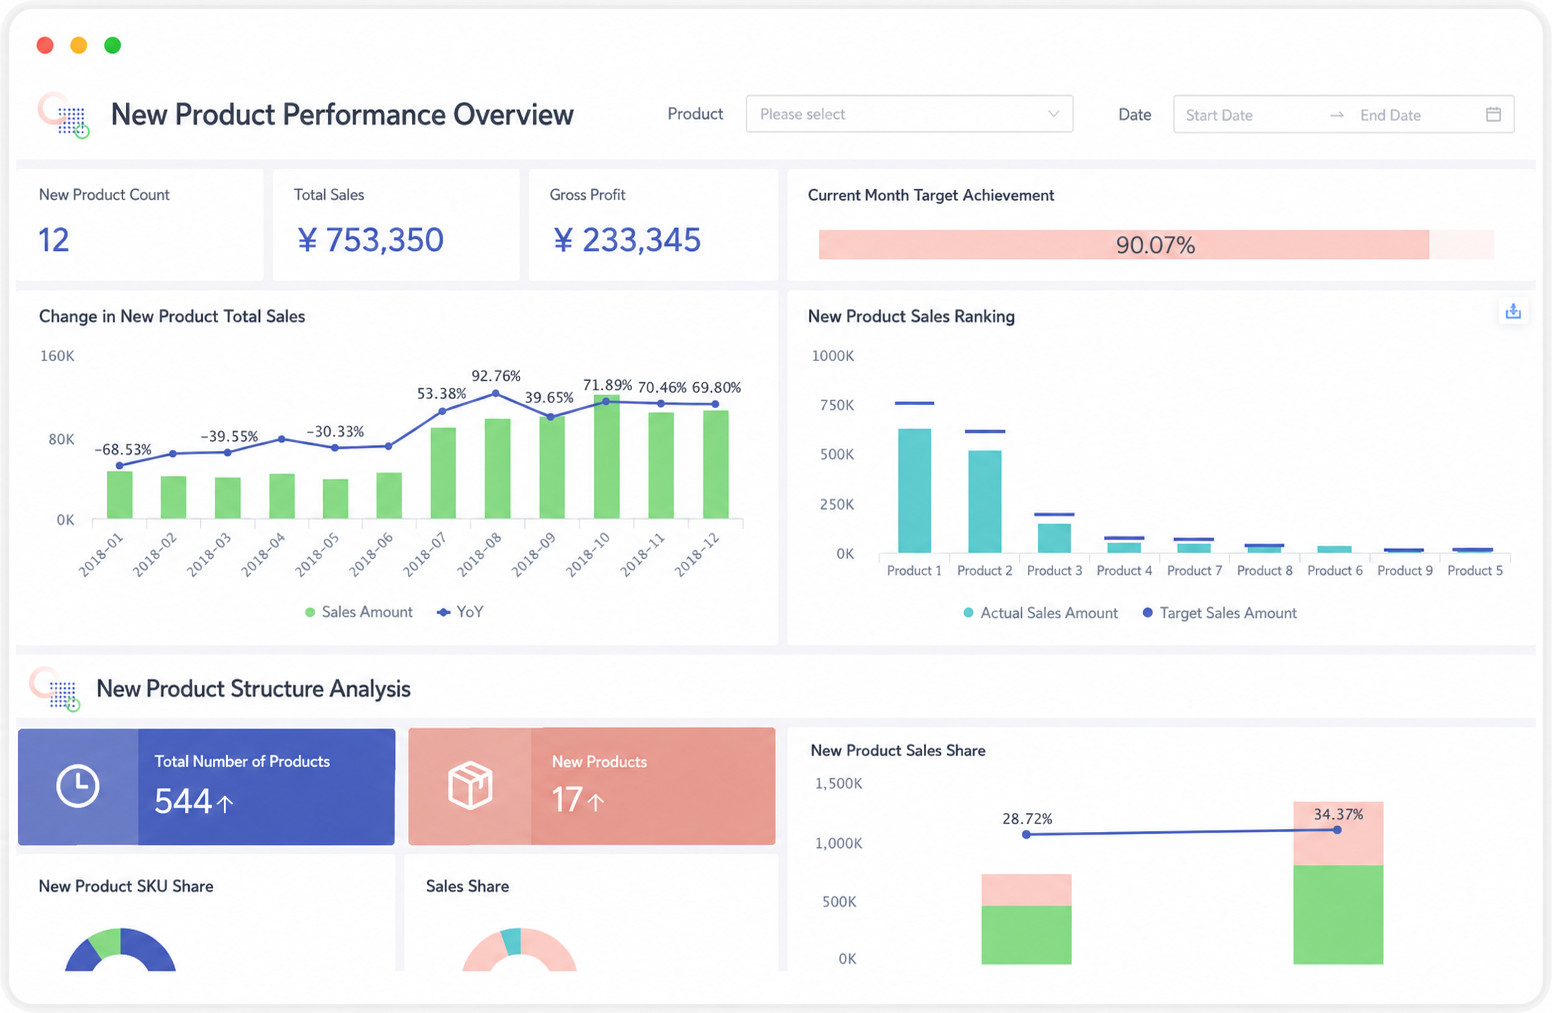
Product and User Analysis
- Scenario description: deeply analyze product performance and user behavior to support product iteration and operational strategy.
- Typical applications:
- Internet businesses: feature usage, user stickiness (DAU/MAU), and user path analysis
- Finance: sales and return analysis of financial products such as wealth management and credit products
- Consumer goods: tracking the launch performance of new products, and analyzing product category and SKU rankings
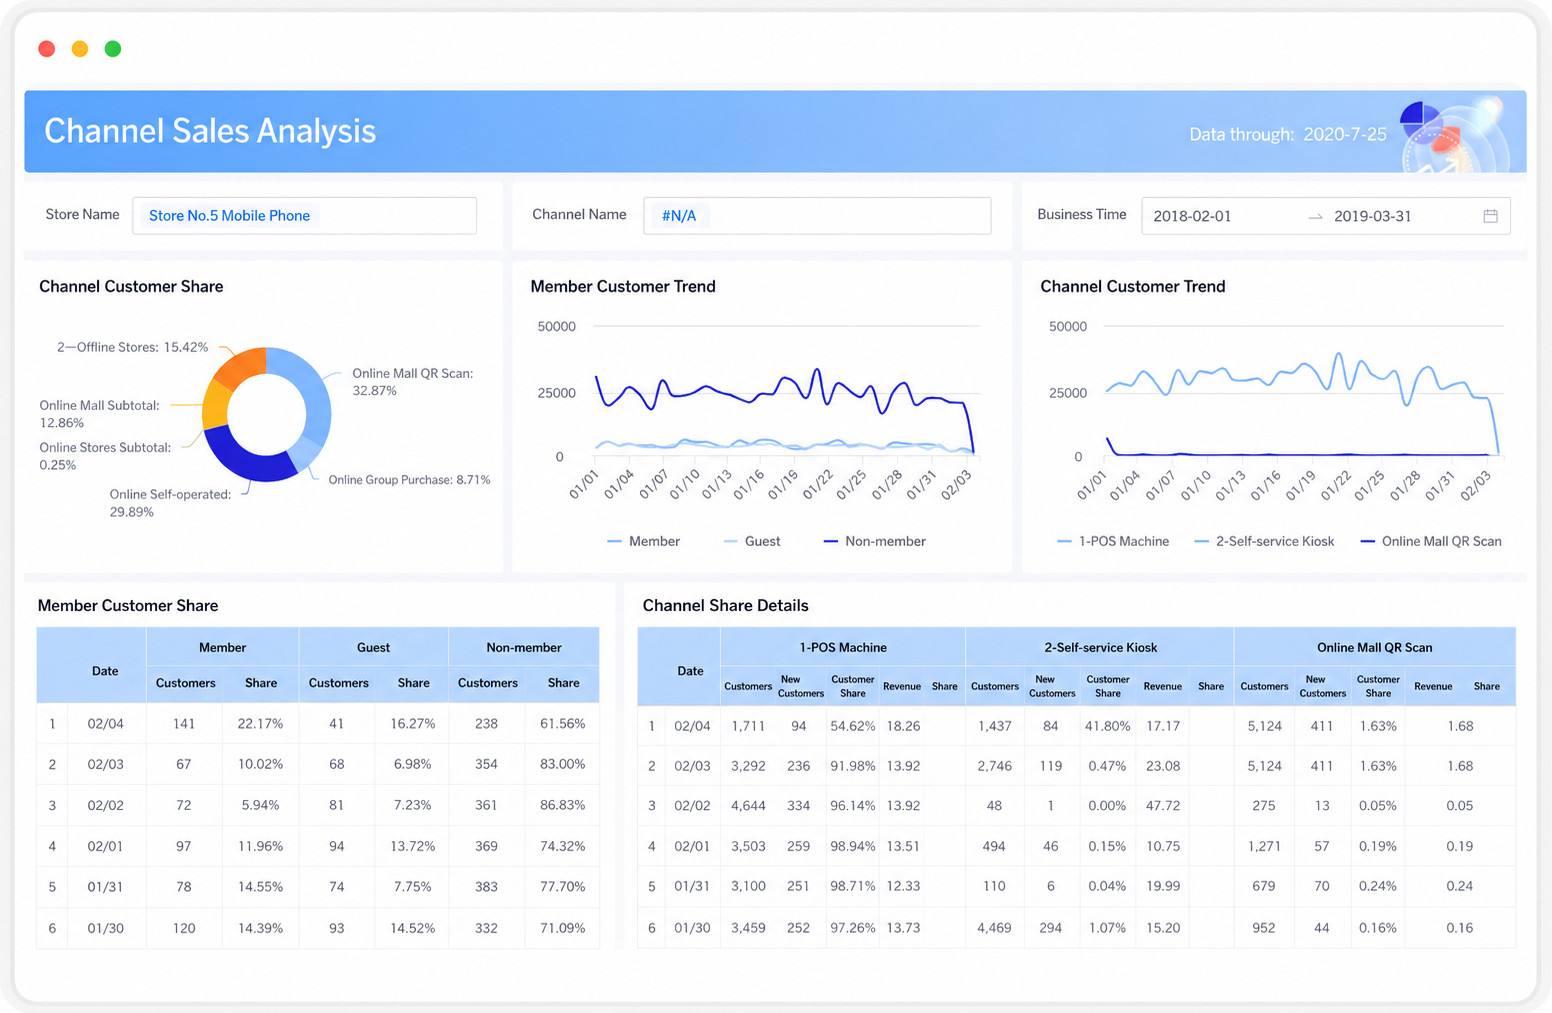
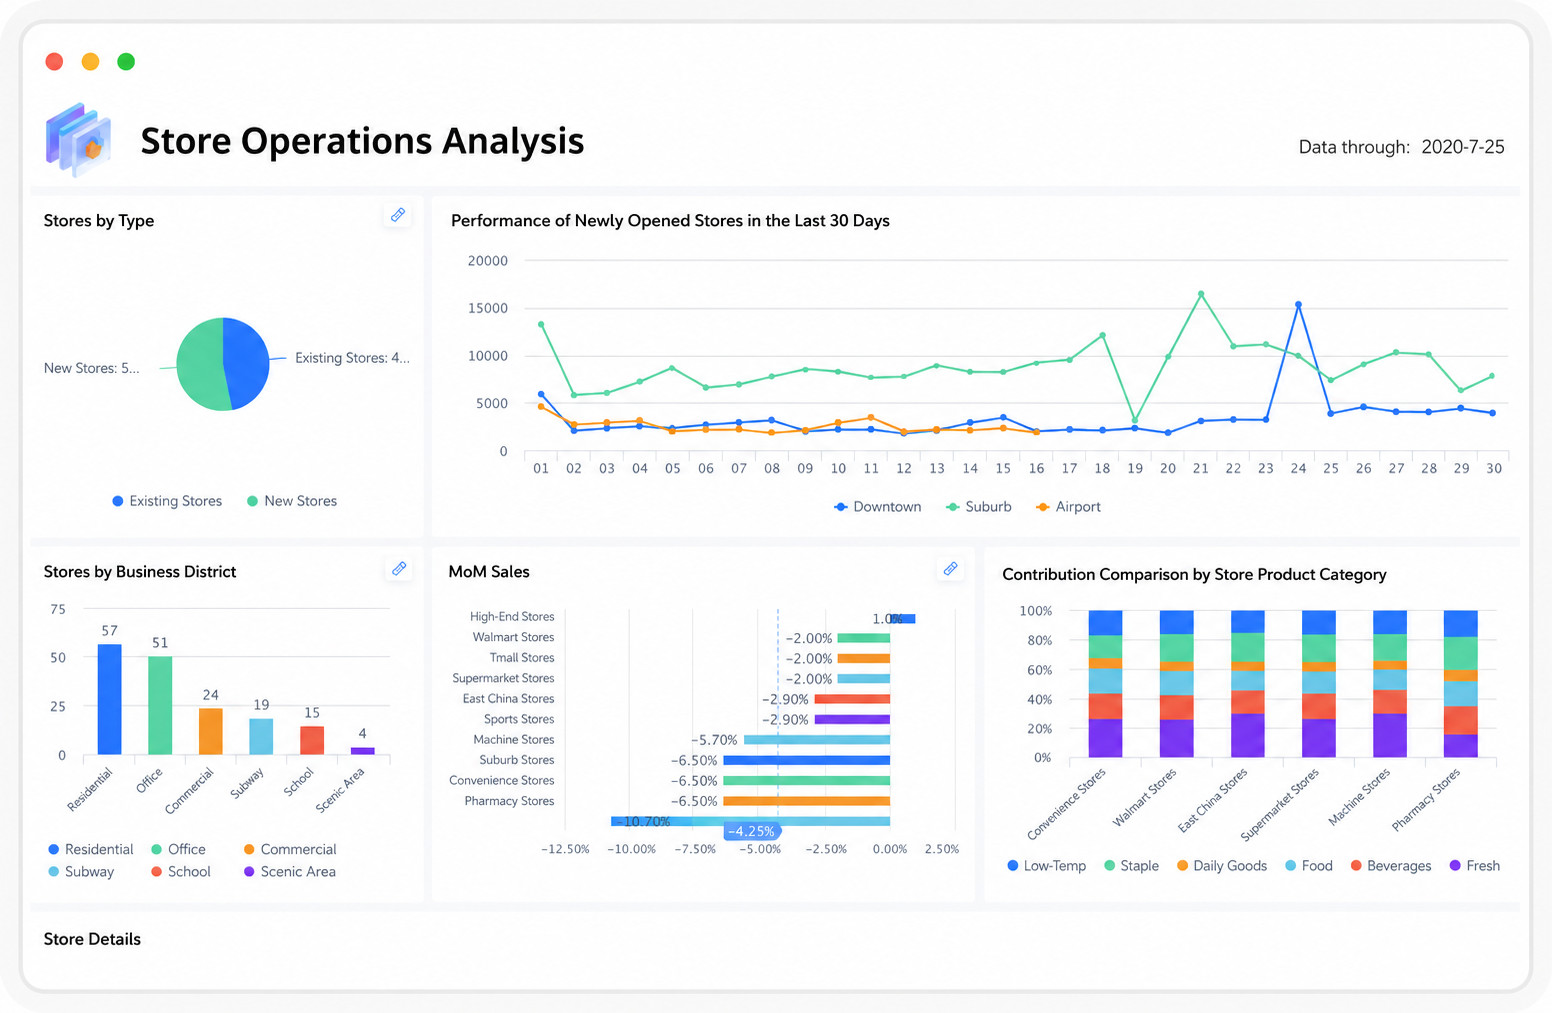
Regional Operations Analysis
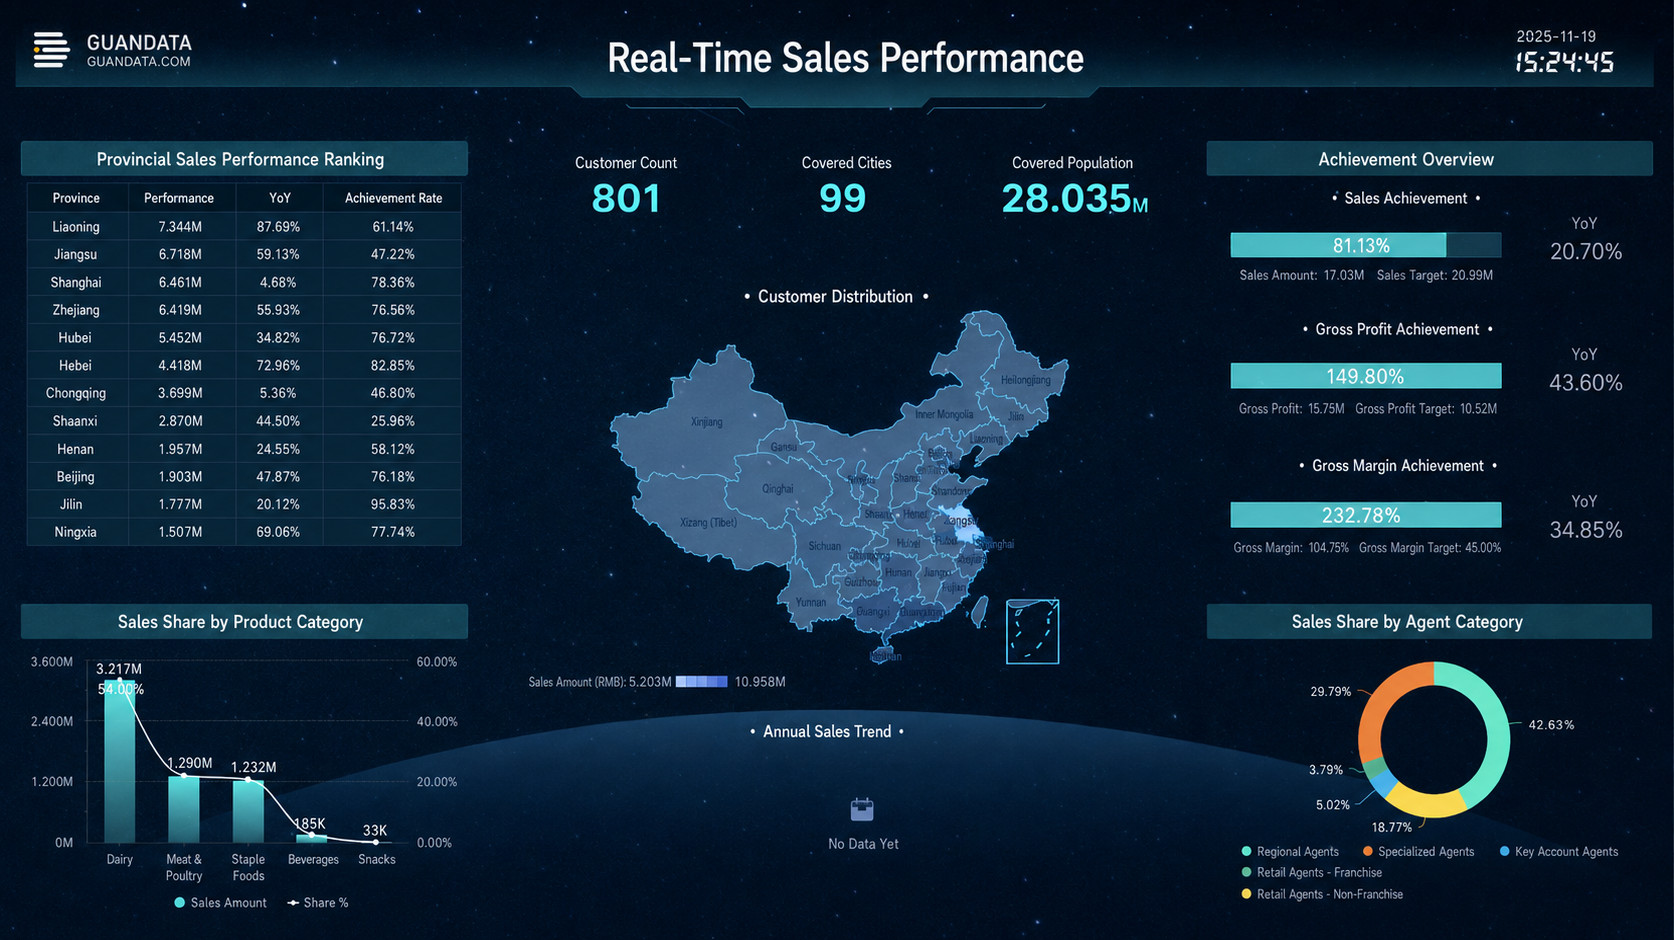
- Scenario description: provide region-specific operating dashboards that integrate core data such as sales, stores, inventory, and staff performance within each territory, enabling refined and visualized regional management.
- Typical applications:
- Performance monitoring and ranking: monitor sales, target achievement rates, and rankings by city and store in real time to quickly identify high-performing and underperforming stores
- Issue drill-down and diagnosis: for stores that fail to meet targets, drill into traffic, average order value, and best-selling or slow-moving products with one click to identify the root cause precisely
- Competitive and market analysis: combine external market data to analyze market share and competitive landscape in a region and support region-specific competitive strategies
- Store visits and task management: record store visit results through mobile devices, assign corrective tasks, and track completion progress to create a closed management loop
Frontline Execution: Real-Time Action and Smart Alerts
Applicable roles: store managers, sales representatives, production line team leaders, customer service staff, and operations specialists
Scenario value: provides lightweight, mobile-friendly data support for frontline employees to drive efficient day-to-day execution
Inventory Exceptions and Alerts
- Scenario description: establish a real-time inventory monitoring mechanism and automatically trigger alerts for exceptions such as stockouts, high inventory, and slow-moving materials.
- Typical applications:
- Retail and consumer goods: store staff receive replenishment reminders when inventory for a best-selling SKU falls below the safety threshold
- Manufacturing: warehouse managers receive alerts when a raw material is about to run short and may affect production schedules
Task Execution and Progress Tracking
- Scenario description: break down high-level goals into executable frontline tasks and track completion progress in real time.
- Typical applications:
- All industries: sales representatives view daily or weekly target completion rates; customer service staff track ticket processing progress and SLAs
- State-owned enterprises: employees track execution progress for key projects or work tasks
More Use Cases
In addition to the scenarios above, Guandata BI supports multiple industries including consumer goods, retail, internet, finance, advanced manufacturing, and state-owned enterprises, and provides customized industry BI solutions. Whether it is equipment status monitoring on the production floor, customer risk assessment in banking, or user behavior analysis on e-commerce platforms, Guandata BI helps enterprises achieve digital transformation and strengthen core competitiveness through powerful data processing and rich analytical capabilities.
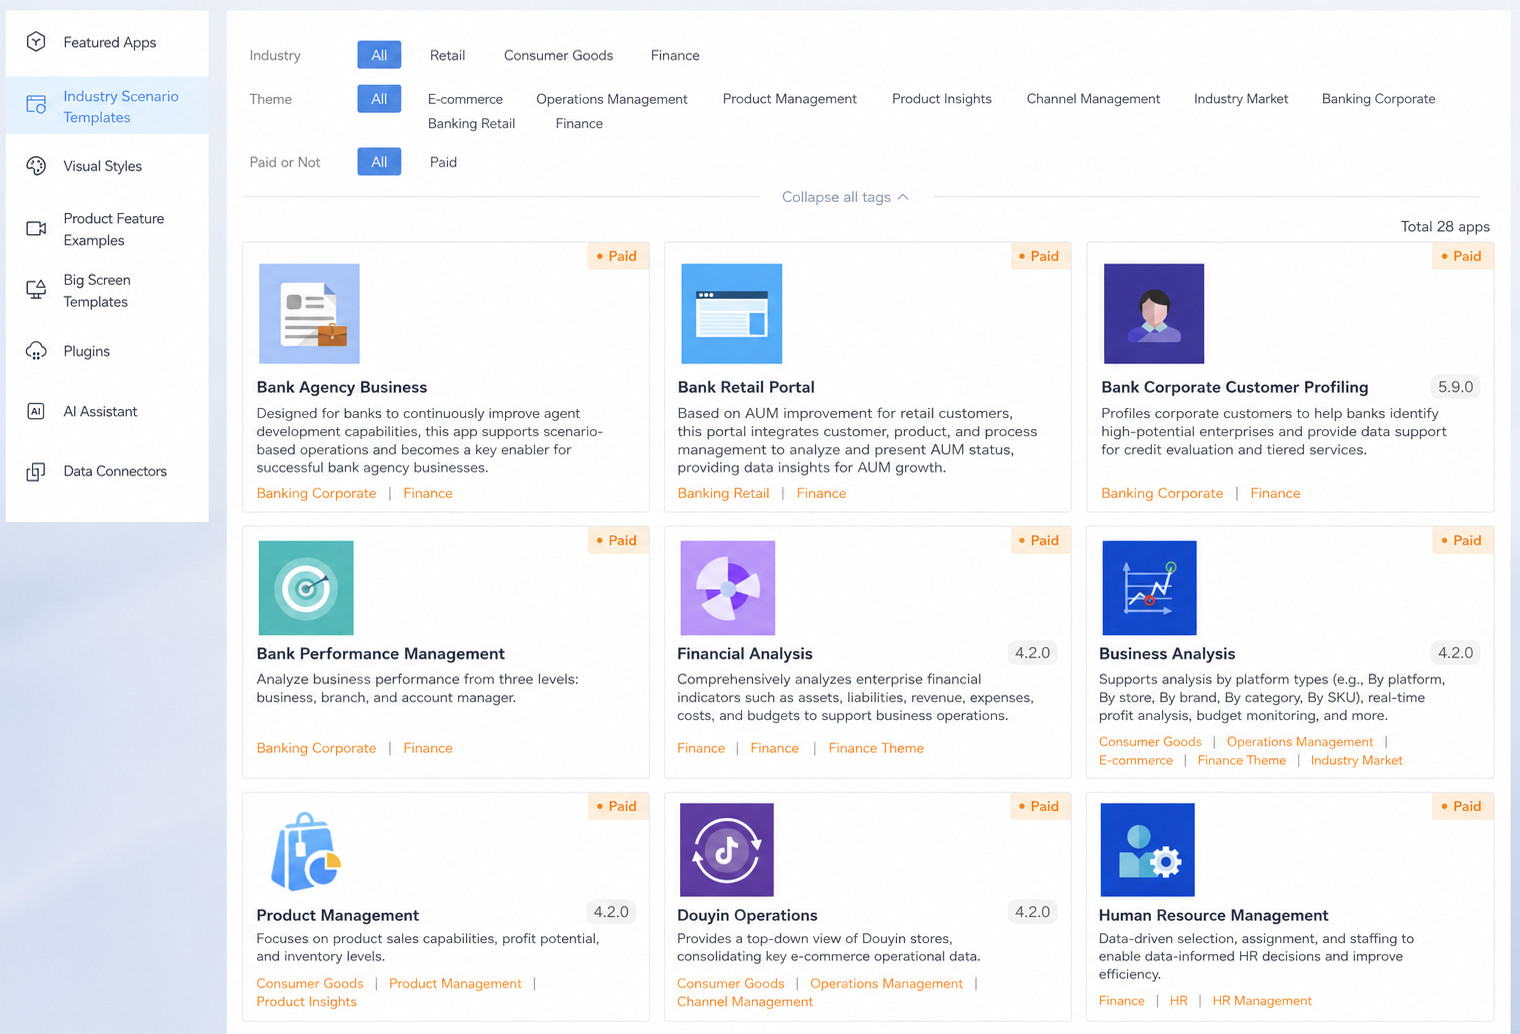
At the same time, Guandata BI also provides scenario-based applications aligned with industry themes and business functions. With prebuilt standard analysis templates, users can quickly deploy industry best practices by replacing the data source with one click. You can explore more use cases in Cloud Marketplace > Industry Scenario Templates.