How to Perform Basket Analysis on the Guandata BI Platform
What Is Basket Analysis?
Basket analysis was first used to discover associations among different products in supermarket sales databases. The often-mentioned beer and diapers example is a classic basket analysis case. The purpose of basket analysis is to mine and analyze user purchase records to identify potential patterns in purchase habits, so businesses can provide users with desired bundles or product combinations. Increased bundle sales usually raise average order value, which can improve company revenue.
How Is Basket Analysis Performed?
Basket analysis is usually performed from the perspective of orders, or shopping receipts. It analyzes the association between purchasing product A and product B in a single purchase. In plain terms: does a user's purchase of product A affect whether they buy product B?
Basket analysis has three key metrics: support, confidence, and lift. To calculate these three metrics, four basic metrics are needed: number of orders for product A, number of orders for product B, number of orders for the product combination, and total number of orders.
The following table explains these seven metrics:
| Metric | Formula | Meaning | Example |
|---|---|---|---|
| Number of orders for product A | num(A) | Distinct count of orders that contain product A | 600 |
| Number of orders for product B | num(B) | Distinct count of orders that contain product B | 400 |
| Number of orders for the product combination | num(A∩B) | Distinct count of orders that contain both product A and product B | 150 |
| Total number of orders | num(I) | Total distinct order count | 10000 |
| Support | num(A∩B)/num(I) | Probability that products A and B are purchased together. It represents the importance of this combination. Only combinations with high support have business value for analysis. | 150/10000=1.5% |
| Confidence | [num(A∩B)/num(I)]/[num(A)/num(I)]=num(A∩B)/num(A) | Given that product A is purchased, the probability that product B is also purchased. In other words, how much purchasing product A affects product B. | 150/600=25% |
| Lift | Confidence of A to B / Support of B = [num(A∩B)/num(A)]/[num(B)/num(I)] | The probability of buying product B after buying product A versus the natural probability of buying product B without considering other products. If the lift of A to B is greater than 1, the probability of buying B after A is greater than the probability of buying B naturally. This means users who bought A are more willing to buy B than they would be naturally, and product combination AB can increase sales of product B. | (150/600)/(400/10000)=6.25 |
Implement Basket Analysis on the Guandata BI Platform
On the Guandata BI platform, you can perform basket analysis by creating cards for ad hoc analysis, or by using Smart ETL to process order data before analysis. Basket analysis performed directly on cards is exploratory and computationally complex, which consumes more system resources. Therefore, calculating it in Smart ETL is recommended. In this case, the data contains more than 40,000 rows, and Smart ETL completes the calculation in 3 seconds. This article explains how to use Smart ETL for basket analysis. If you want to learn about the card-based solution, visit the case library in Guandata Cloud App Marketplace.
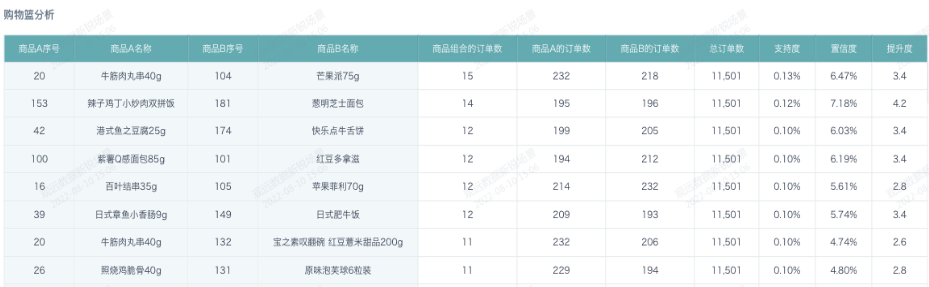
After using Smart ETL to process order data and then visualizing the result, you can obtain the following analysis:
Next, let's look at the steps for performing basket analysis on the Guandata BI platform.
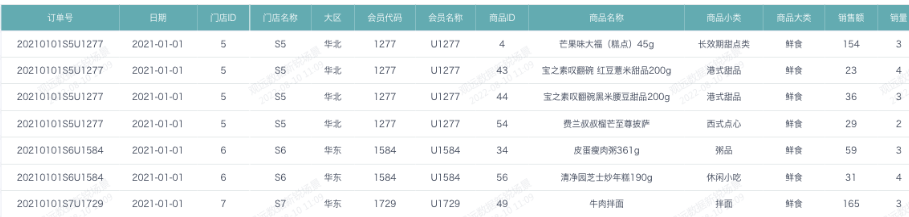
First, the data source we use is the most common transaction detail data, which contains date, store, product, and order number.
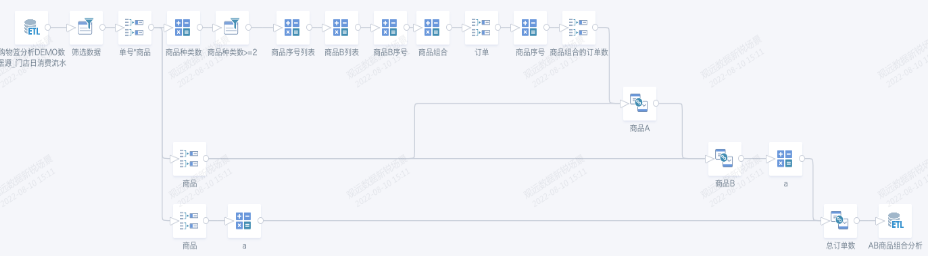
Then, use this transaction detail data as the input data source and process it in ETL. The overall ETL procedure is not complex, as shown below:
Derive the Calculation Logic
Before developing the ETL, first clarify the calculation logic. Among the four basic metrics in basket analysis, the number of orders for the product combination is the only one that is relatively difficult to calculate. It is also the main difficulty in basket analysis.
Use a simple dataset to derive how to calculate the number of orders for product combinations. For example, in the table below, the final goal is to calculate how many orders each product combination has.
| Product Combination | Product 1 | Product 2 | Number of Orders |
|---|---|---|---|
| AB | A | B | 3 |
| AC | A | C | 2 |
| AD | A | D | 1 |
| BC | B | C | 2 |
| BD | B | D | 1 |
| CD | C | D | 1 |
Working backward one step, first calculate which product combinations exist in each order. For example:
| Order No. | Product | Product Combination |
|---|---|---|
| Order 1 | A | |
| Order 2 | A,B | AB |
| Order 3 | A,B,C | AB,AC,BC |
| Order 4 | A,B,C,D | AB,AC,AD,BC,BD,CD |
Therefore, the key to calculating the number of orders for product combinations is enumerating which product combinations exist in each order. This enumeration process is similar to the permutation and combination problems learned in high school.
Using Order 4 in the table above as an example, there are four products: A, B, C, and D.
- First, place two products into two boxes: Box 1 contains product 1, and Box 2 contains product 2. Product 2 can be any product except product 1. This produces 12 possible permutations.
- Then place the products from the two boxes into one large box and deduplicate them, keeping only one large box that contains the same products. After deduplication, six product combinations remain.
Through the logic derivation above, a seemingly complex product combination calculation is reduced to a mathematical problem: first permute, then deduplicate to calculate combinations. This method enumerates pairwise product combinations, and the same idea can also solve combinations of three products or four products.
| Box 1 | Box 2 | Large Box |
|---|---|---|
| A | B | AB |
| A | C | AC |
| A | D | AD |
| B | A | BA |
| B | C | BC |
| B | D | BD |
| C | A | CA |
| C | B | CB |
| C | D | CD |
| D | A | DA |
| D | B | DB |
| D | C | DC |
ETL Implementation
Next, implement this calculation logic on the Guandata BI platform.
Step 1: Deduplicate and filter data
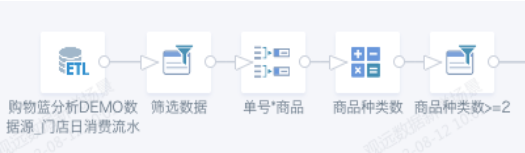
- Add filter conditions to filter the data source, such as date greater than or equal to 2021-01-01.
- Use group aggregation to deduplicate order numbers and products. Drag Order No., Product ID, and Product Name into the dimension field well.
- Add a calculated field: Number of Product Types.
COUNT([Product ID]) OVER(PARTITION BY [Order No.]) - Add a filter condition to keep records where Number of Product Types is greater than or equal to 2.
Step 2: Calculate the number of orders for pairwise product combinations.

- Add a calculated field: Product ID List.
array_sort(collect_list([Product ID]) over(partition by [Order No.]))-- List all product IDs in an order and sort them. - Add a calculated field: Product B List.
filter([Product ID List], x -> x<>[Product ID])-- Filter out the ID of product A to obtain the product B list. - Add a calculated field: Product B ID.
explode([Product B List])-- Expand Product B IDs. - Add a calculated field: Product Combination.
array_sort(array([Product ID],[Product B ID]))-- Use the array function to create an array for the product combination, meaning the products in the two boxes are placed into one large box, and use thearray_sortfunction to sort the array. - Use group aggregation to deduplicate order numbers and product combinations. Drag Order No. and Product Combination into the dimension field well.
- Add a calculated field: Product A ID.
[Product Combination][0] - Add a calculated field: Product B ID.
[Product Combination][1] - Use group aggregation to calculate the number of orders for product combinations. Drag Product A ID and Product B ID into the dimension field well. Drag Order No. into the value field well, set the aggregation method to distinct count, and set the alias to Number of Orders for Product Combination.
Step 3: Join to obtain Product A Name, Number of Orders for Product A, Product B Name, Number of Orders for Product B, and Total Number of Orders.
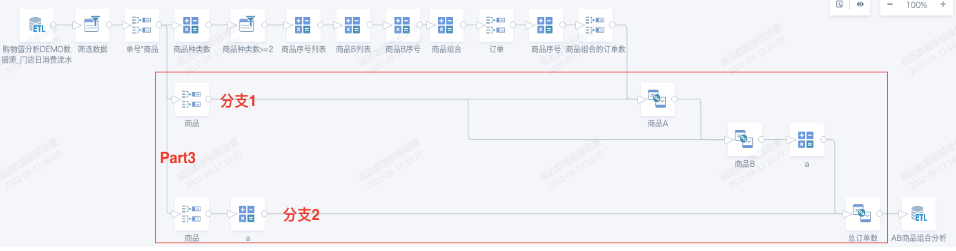
Branch 1:
- Use group aggregation to calculate the number of orders for each product. Drag Product ID and Product Name into the dimension field well. Drag Order No. into the value field well, set the aggregation method to distinct count, and set the alias to Number of Orders.
- Add joined data: join Product A ID from the product combination to Product ID. Rename fields to obtain Product A Name and Number of Orders for Product A.
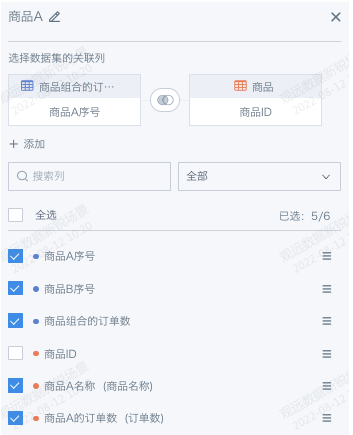
- Add joined data: join Product B ID from the product combination to Product ID. Rename fields to obtain Product B Name and Number of Orders for Product B.
Branch 2:
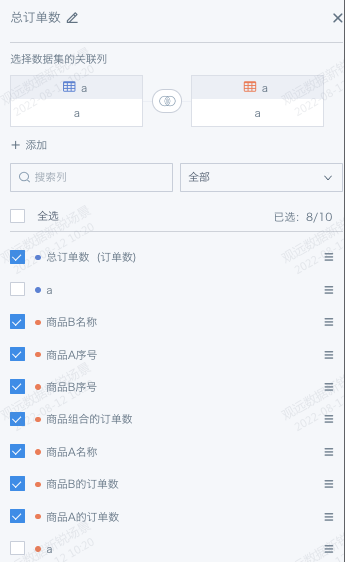
- Use group aggregation to calculate the number of product orders. Set the aggregation method to distinct count and the alias to Number of Orders.
- Add joined data: join constant field
ato constant fielda. Rename the field to obtain Total Number of Orders.
Finally, save and run the ETL. You have now calculated the four basic metrics: number of orders for product A, number of orders for product B, number of orders for the product combination, and total number of orders. Then create a new card from the dataset output by ETL, calculate support, confidence, and lift for product combinations, and you can obtain the desired analysis result.
After reading this, you may want to try it immediately. You can also contact Guandata to obtain sample data sources and ETL program files for basket analysis.