View Dataset Usage and Case Sharing
A view dataset is a dynamic dataset based on Spark SQL that supports parameterized execution. It can dynamically associate and calculate non-direct datasets, providing a more flexible data analysis method and solving complex analysis problems in ad hoc analysis scenarios. A typical application scenario is retail activation PSD calculation.
Purpose
A view dataset adds a calculation layer between cards and datasets, similar to a subquery. A view dataset first calculates an intermediate result based on its definition and source datasets, and then uses the result for card display. Its specific purposes include:
- Add global parameters to a view dataset to perform dynamic calculations under different filter conditions based on parameter values.
- Through a view dataset, the same source dataset can be aggregated at different granularities, allowing one source dataset to be used as multiple source tables.
- Multiple source datasets can be associated in a view dataset to implement multi-table fusion without occupying storage space.
Applicable Scenarios
Dynamic filtering: member tags, sales ranking
Multi-table fusion: store coverage rate, out-of-stock rate
Date completion needed, such as zipper tables: sell-through rate, sales activation rate, digestion rate
Prerequisites
- This is a free embedded product feature. It is disabled by default and must be enabled by Guandata staff.
- It uses Spark SQL syntax to query non-direct datasets. Users need basic knowledge of Spark SQL.
Usage Steps
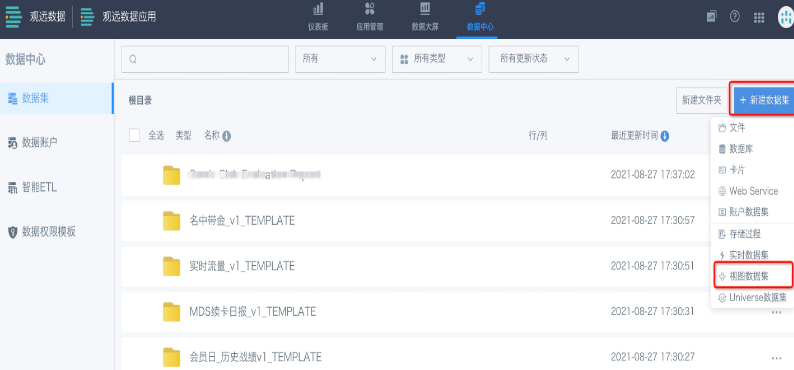
- Go to the dataset page in Data Center, click Create Dataset in the upper-right corner, and select View Dataset.
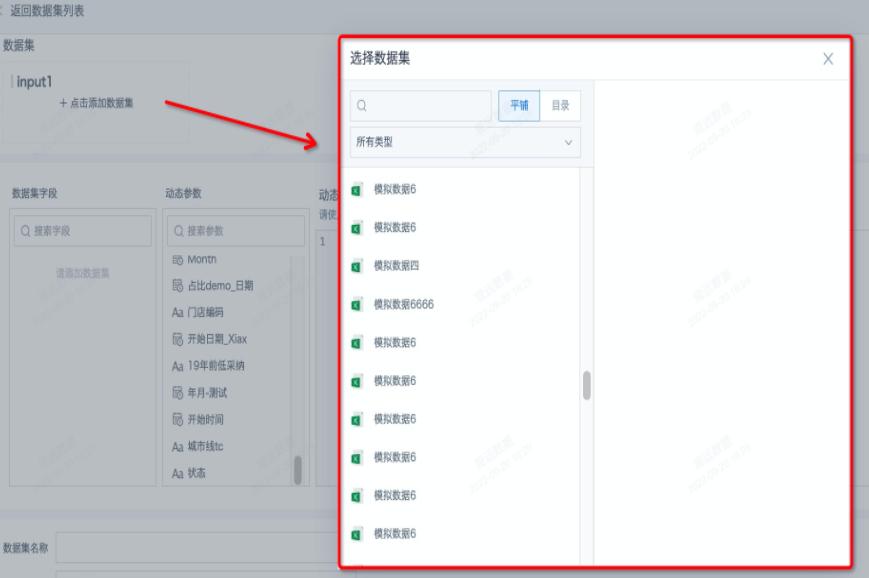
- Go to the dataset details page, click Add Dataset, and add one or more non-direct datasets. It is recommended to use no more than 2 when possible.
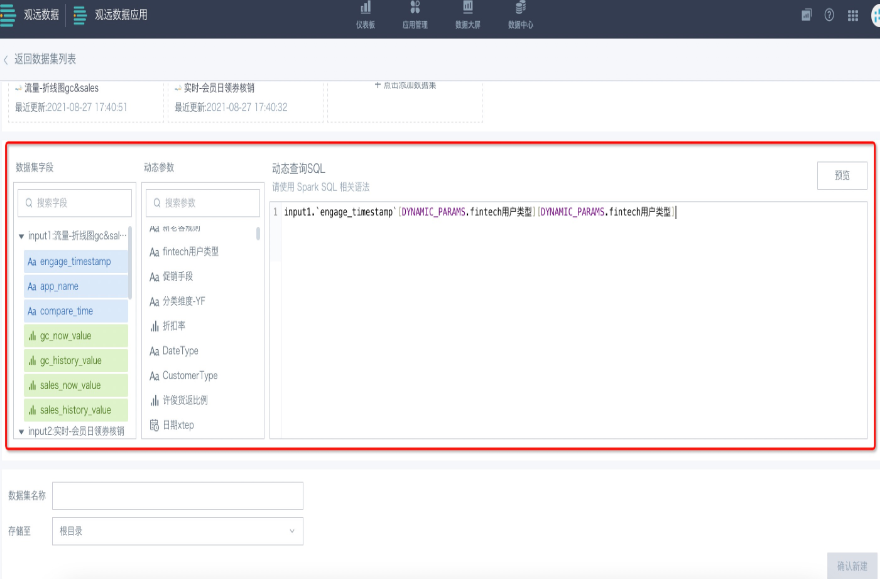
- Enter dynamic query SQL. You can select Dataset Fields and Dynamic Parameters from the left side to complete the Dynamic Query SQL and preview it. Dynamic parameters are global parameters and must be added in Admin Settings in advance.
- Specify the dataset name and save location. Click Confirm Creation. After the dataset is created, you can find it in the corresponding folder directory.
Notes
View datasets and frontend cards are both based on Guandata's built-in calculation engine. When performing the same calculation, the required time is the same. The following points help ensure view dataset performance:
1. Smart ETL provides convenient backend calculation capabilities, so view datasets should be used only for necessary calculations.
2. Frontend filters take effect after the view dataset calculation. Unless this behavior is required, move filtering into the view dataset through parameters whenever possible.
Case
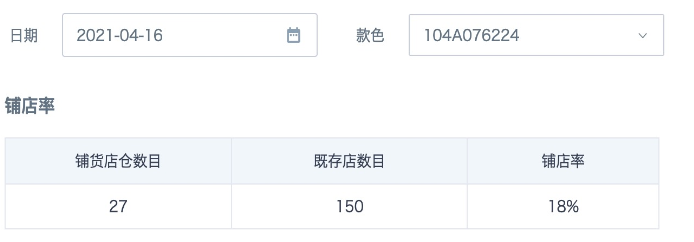
Case 1: Calculate the store coverage rate of a style-color in the month of the selected date by filtering date and style-color
Store coverage rate = cumulative number of stocked stores / number of existing stores.
Scenario Analysis
The cumulative number of stocked stores comes from the purchase table and the retail table, while the number of existing stores needs to be calculated from the store-warehouse dimension table.
Without a view dataset, the store-warehouse dimension table must be used as the primary table to left-join the purchase table and retail table, causing the data to expand sharply. Using a view dataset to fuse multiple data sources is a more reasonable data organization method.
Implementation:
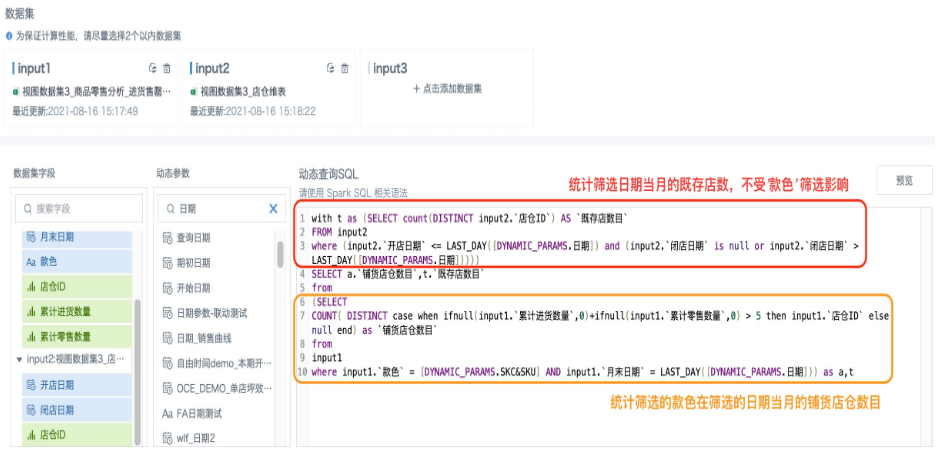
- Create a view dataset. The model structure is as follows.
This scenario uses a common table expression (CTE) to define a temporary result set t, which stores the calculated number of existing stores in the month of the selected date. The later SQL statement references this result set. Here, the number of existing stores is affected only by the date filter, while the number of stocked stores is affected by both the date filter and the style-color filter.
with t as (SELECT count(DISTINCT input2.`店仓ID`) AS `既存店数目`
FROM input2
where (input2.`开店日期`  LAST_DAY([DYNAMIC_PARAMS.日期]))))
SELECT a.`铺货店仓数目`,t.`既存店数目`
from
(SELECT
COUNT( DISTINCT case when ifnull(input1.`累计进货数量`,0)+ifnull(input1.`累计零售数量`,0) > 5 then input1.`店仓ID` else null end) as `铺货店仓数目`
from
input1
where input1.`款色` = [DYNAMIC_PARAMS.SKC&SKU] AND input1.`月末日期` = LAST_DAY([DYNAMIC_PARAMS.日期])) as a,
t
- Create a card. Create a calculated field named Store Coverage Rate, drag it into the measure area, and save the card. If no data appears in the preview, temporarily enter valid parameters in Parameter Default Values on the right side of the card editing page to ensure data is available for preview during creation.

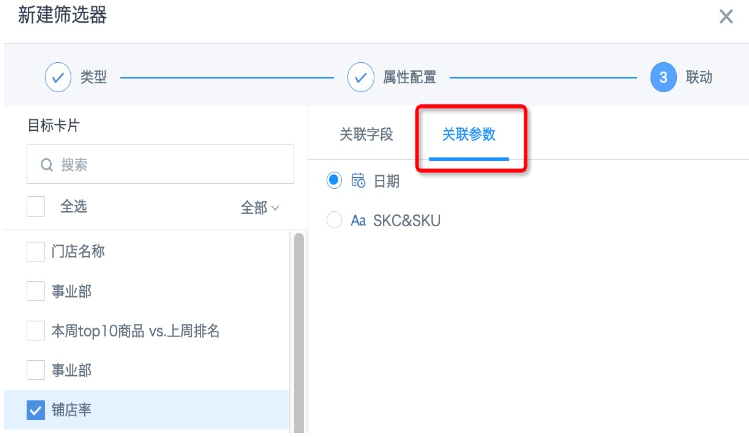
- Return to the page. Create a parameter filter, select the date-type parameter used in the view dataset, and save it. It can automatically associate with the card created in the previous step. Alternatively, create a date filter and select the date-type parameter used in the dataset on the linkage page. Similarly, create a parameter filter or select filter for Style-Color and configure linkage.
- The final effect is shown below: