Dynamic Text Report Case Study
Requirement Background: In addition to using various visualization charts to analyze data, users sometimes need to create text-based summary reports, such as monthly summaries. The traditional approach requires users to manually write them, and the analysis data referenced in them needs to be manually extracted and input. Next month's analysis report requires similar repetitive work, consuming manpower and taking a long time. Guandata BI supports creating dynamic text reports that can be reused after creation, and the content will automatically update following metadata changes.
Implementation Method: Put fixed text templates in text cards, set formats, and reference metric cards to display dynamic content.
Case Study 1: Text displays product categories with daily sales decline compared to the previous period
Since metric cards can only display one field, other content that needs to be calculated must be calculated through new calculated fields. And since dimension fields cannot be specified, window functions may need to be borrowed to divide granularity for grouped calculations.
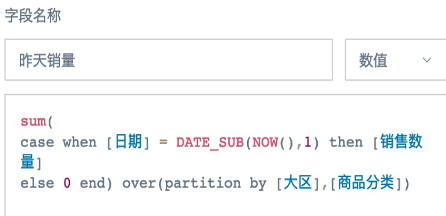
1. Create a new calculated field: Yesterday's Sales. Over(partition by [Region],[Product Category]) means grouping by region and calculating the sales of each product category in each region. If you need to use filters to filter date and time, you need to use global parameters to replace the current time functions.
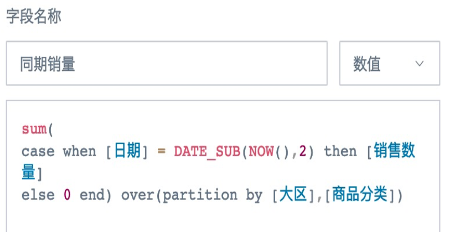
2. Create a new calculated field: Same Period Sales. If you need to calculate week-over-week, month-over-month comparisons, etc., you need to use functions to specify the dates to compare.
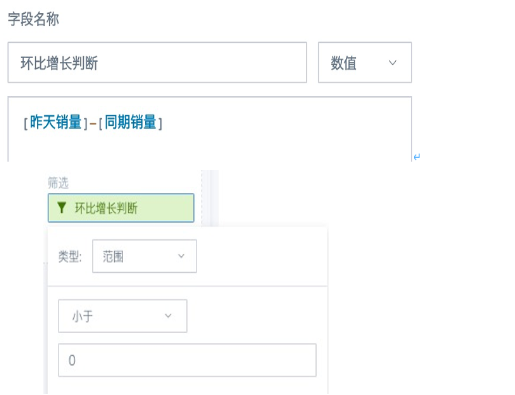
3. Create a new calculated field: Growth Rate Judgment. Drag this field to the filter column and set the range to less than 0 to filter out data with declining sales.
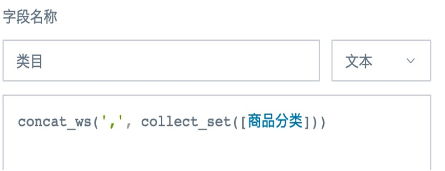
4. Create a new calculated field: Category. Field type is text, drag to the value column, aggregation method select no processing.
5. Drag the fields to be filtered to the filter column and set filter conditions, or create filters on the page and link them to this text card. The final text card display effect is as follows.

Case Study 2: In Case Study 1, product categories with declining sales not only need to list the product categories, but also need to list the corresponding year-over-year and month-over-month growth rates for each product category.
Method:
1. Same as steps 1 and 2 above, calculate current period and same period sales respectively.
2. Step 3, change the new field to calculate year-over-year and month-over-month growth rate.

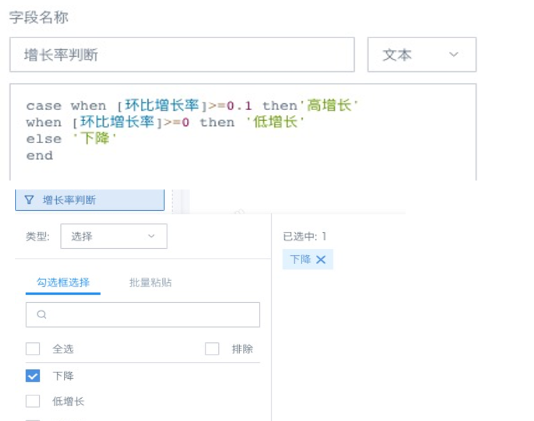
3. Create a new calculated field: Category Growth Rate Concatenation. Numeric fields need to use functions to specify format and precision, then concatenate with the product category field according to the required format.

4. Create a new calculated field: Growth Rate Judgment, text type, drag to the filter column, filter "Decline". By setting this field, other filtering effects can also be achieved, such as filtering out product categories with growth rates exceeding 10%.
5. Create a new calculated field: Category. Field type is text, drag to the value column, aggregation method select no processing.
Note: If you continue to use the function concat_ws(',', collect_set([Category Growth Rate Concatenation])) as in Case Study 1 and then drag it to the value column, you will find that the system will pop up an error "Query contains illegal fields". This is because in Case Study 1, the original dimension fields were concatenated after filtering based on the calculation results, which is an aggregated measure, but in this usage, aggregated calculation results need to be concatenated, the nature changes, and window functions need to be used. over(partition by [Growth Rate Judgment])) Group by the new field [Growth Rate Judgment] created in the previous step.

6. Drag the region field to be filtered to the filter column and set filter conditions, or create filters on the page and link them to this text card. The final text card display effect is as follows.

Note:
1. Try not to write formulas too complex, don't put all calculation logic in one calculated field, as it has low calculation efficiency and is prone to errors and difficult to troubleshoot. It is recommended to split into multiple simple fields.
2. Because the calculation results of each step in metric cards cannot be directly verified for accuracy, slight carelessness may cause the final calculation results to be inaccurate. It is recommended to simultaneously create a regular table to verify the calculation results using different methods until the results are ensured to be accurate.
3. For linked filters, when the filter items have no data in the dataset causing the calculation results to display as null, you can reference global parameters in metric cards and add a layer of judgment logic to the numeric fields to be displayed, showing 0 when there is no data. For example, the filter option is product SKU, which depends on a separate product SKU dataset, and the linked metric card depends on other datasets, and the metric card calculates inventory quantity. You need to use the newly created calculated field case when [Product SKU] =[DYNAMIC_PARAMS. Product SKU] then [Inventory Quantity] else 0 end* drag to the value column, aggregation method select sum, then the page filter links to the global parameter [DYNAMIC_PARAMS. Product SKU] in the metric card.**
4. The functions used above are Spark SQL functions. For direct connection datasets and high-performance datasets, please use the corresponding database functions.