Free Time Comparison Case
Requirement Background: Sometimes users need to manually select a time range and compare it with another custom time range. For example, comparing this year's Spring Festival holiday with last year's Spring Festival holiday, or comparing last year's Double 11 promotion with the year before when the promotion durations differ. In similar cases, the system's built-in period-over-period or year-over-year feature cannot be used, so the comparison date range must be specified manually.
Feature Used: Global Parameters
Implementation:
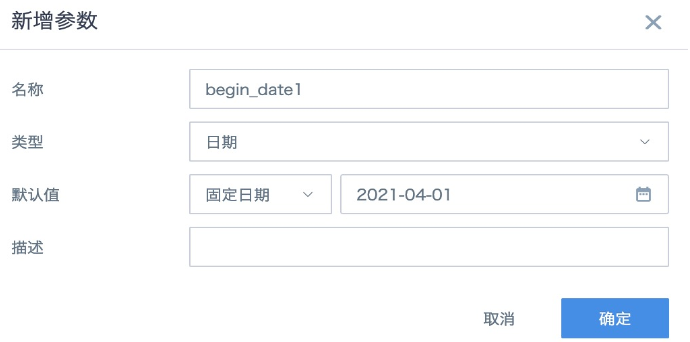
- Create four time-type global parameters to obtain the start and end dates of the current period and comparison period. Use paired names for convenience, such as
begin_date1,end_date1,begin_date2, andend_date2.
- In the table card, create a calculated field. Use
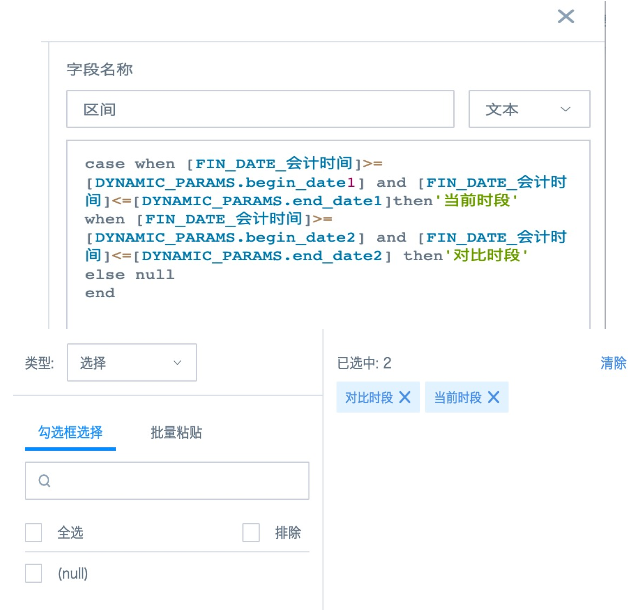
case whenorifto identify dates betweenbegin_date1andend_date1as "Current Period", and dates betweenbegin_date2andend_date2as "Comparison Period". Then drag the field to the dimension field well or comparison field well as needed. Also drag it to the filter field well and select "Current Period" and "Comparison Period".
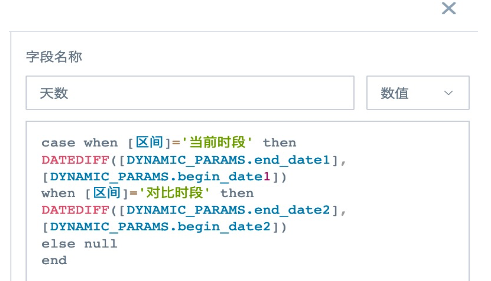
- Create a calculated field "Days" to calculate the number of days in the "Current Period" and "Comparison Period". Drag it to the dimension field well or value field well as needed. If it is placed in the value field well, set the aggregation method to No Processing.
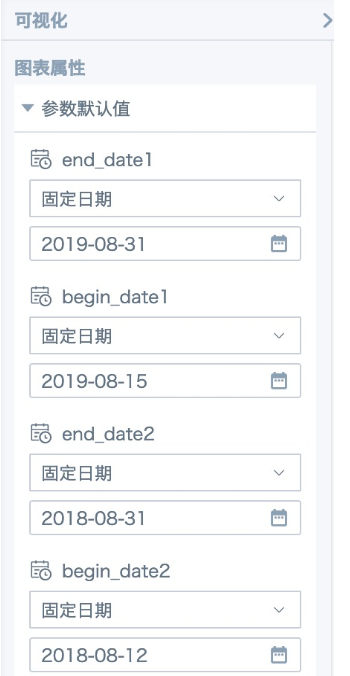
- Create and save the report. If the editing page shows no data, temporarily set default values in Chart Properties -- Parameter Default Values on the right side of the page to ensure data is available for preview and validation.
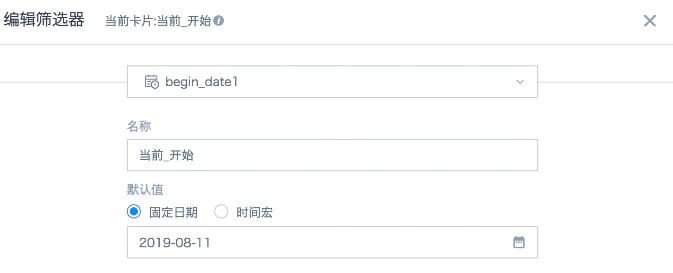
- Create four parameter filters on the page, using the four time parameters referenced in the card. After saving, they automatically link to all cards on the current page that use the same parameters.
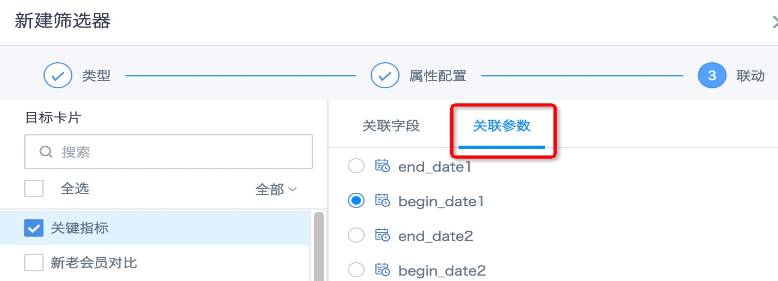
If you need to link other cards on the page that do not use global parameters, use date filters instead, and manually select the corresponding time parameters in the card on the linkage page.
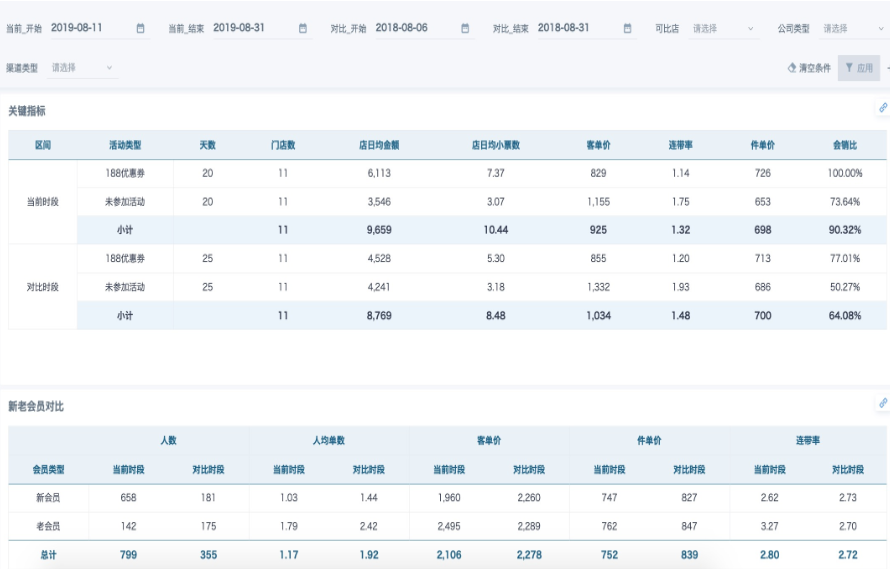
- The completed result is shown below. If the functions above need to be reused across multiple cards, save the card as a copy, then modify the chart type to create other visualization effects.