Using View Dataset to Implement Dynamic Display of Front and Back N Rankings
Scenario
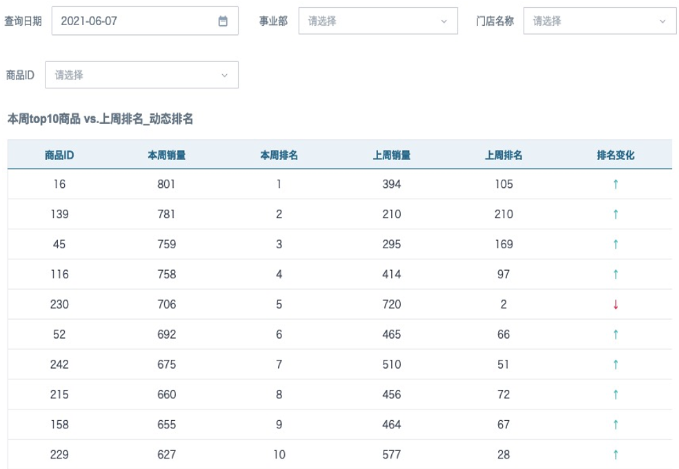
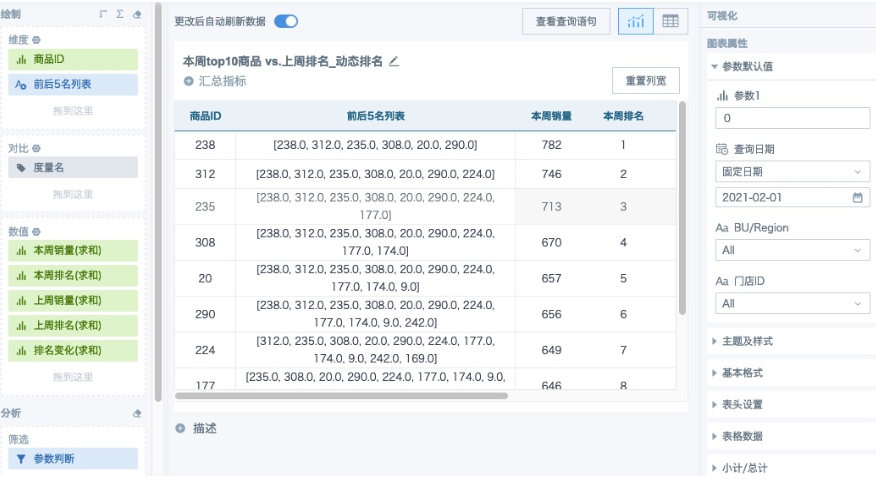
Based on the selected values from the page filters, calculate the ranking of this week's top 10 products by sales in the previous week, and the ranking changes. When filtering product ID from the filter, the chart changes to display the product information of the N rankings before and after this product's current week ranking. The effect is shown in the figure below.
Implementation Key Points
View dataset, global parameters, window functions.
Approach
This scenario is divided into two parts. Part 1: Based on the selected values from the page filters, calculate the ranking of this week's top 10 products by sales in the previous week, and the ranking changes. If only implementing this requirement, it can also be achieved by directly using window functions to create fields in cards, or using view datasets.
The difficulty mainly lies in Part 2: When filtering product ID from the filter, the chart changes to display the product information of the N rankings before and after this product's current week ranking. When page filters link to cards, they will filter the dataset data. After filtering product ID, it will first filter out the data of that product ID from the dataset, then perform ranking calculations, so the resulting rankings are incorrect, and the number of rows in the dataset and the number of rows after aggregation in the card are inconsistent, making it impossible to use window functions to control the display of front and back rows. That is, all ranking information is controlled by the first 3 filters "Query Date", "Business Unit" and "Store Name", but not controlled by "Product ID"; "Product ID" is mainly used to display the ranking of the selected product and locate the front N and back N products. This scenario requires using view datasets to implement.
Implementation Steps
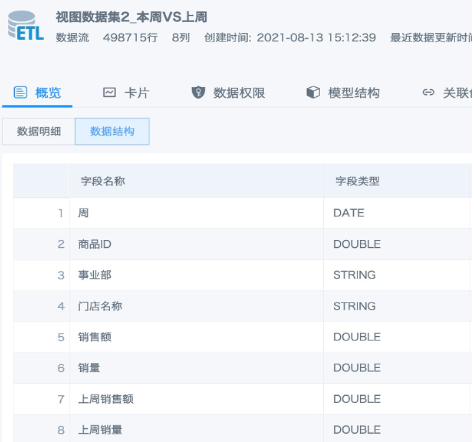
1. Prepare the data aggregated to the required granularity in ETL in advance. In the current case, ETL aggregation obtained sales and quantity for each business unit-each store-each product-each week and the previous week. Since the page filter needs to filter dates, ETL outputs the date of each Monday to identify each week. The data structure is shown in the figure below.
2. Use the dataset fields to create selection filters "Business Unit", "Store Name" and "Product ID" on the page, and create a date filter. Don't set linkage yet.
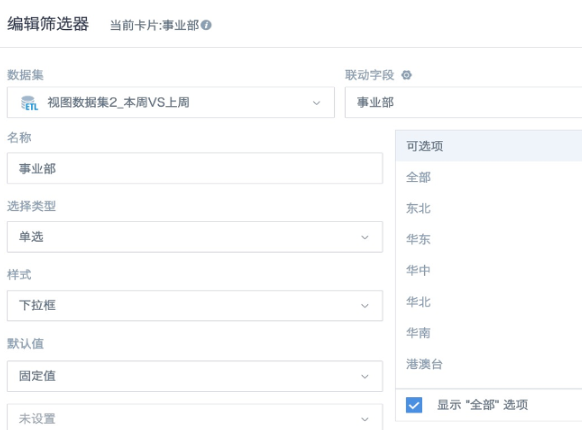
3. Prepare 1 global parameter of the same type for each filter field from the previous step (create new or use existing parameters). Text fields "Business Unit", "Store Name" use text parameters [DYNAMIC_PARAMS.BU/Region] and [DYNAMIC_PARAMS.Store ID] (default value recommended to be "All"), "Product ID" uses numeric parameter [DYNAMIC_PARAMS.Parameter1] (default value recommended to be 0), query date uses date parameter [DYNAMIC_PARAMS.Query Date]. For parameter introduction, please refer to Global Parameters.
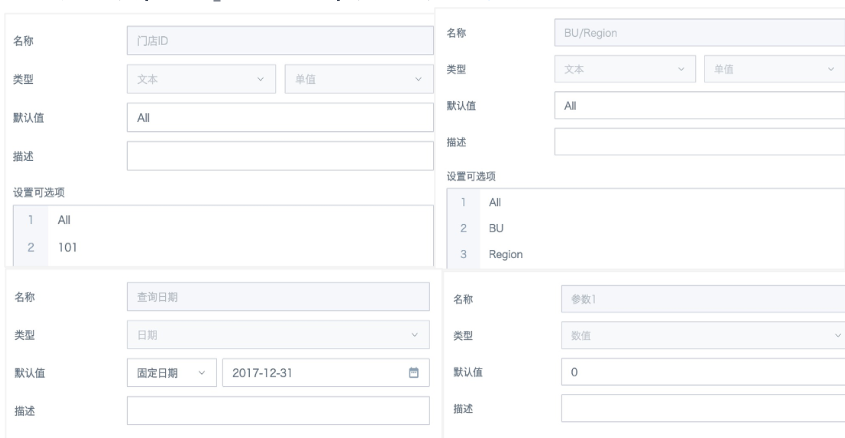
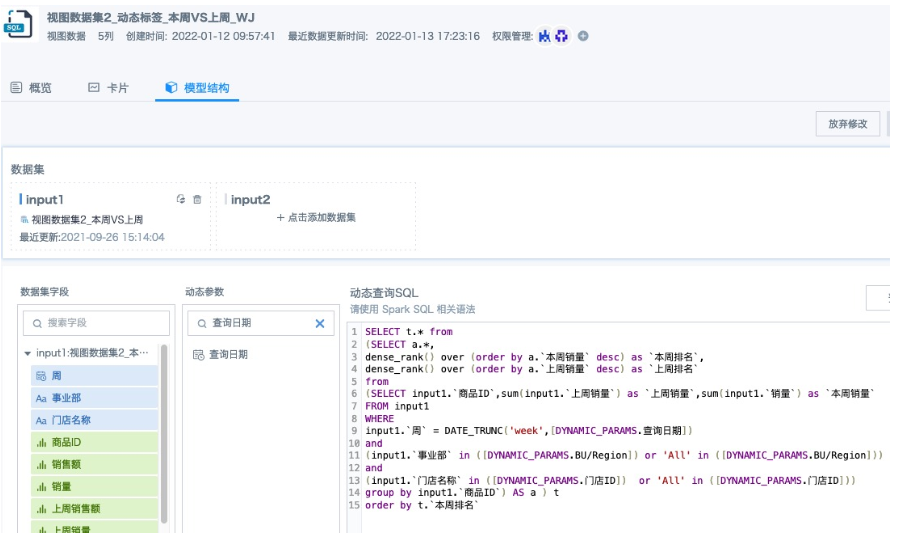
4. Use the ETL dataset from step 1 to create a view dataset, reference global parameters in the SQL statement (except product ID parameter), further aggregate the data, directly calculate each product ID's current week sales, previous week sales, current week ranking and previous week ranking, only retain fields that must be displayed in the chart card. Since "Query Date", "Business Unit" and "Store Name" don't need to be displayed in the chart card and come directly from the ETL dataset, these three fields don't need to be retained in the view dataset. The SQL statement is as follows.
SELECT t.* from
(SELECT a.*,
 dense_rank() over (order by a.`Current Week Sales` desc) as `Current Week Ranking`,
 dense_rank() over (order by a.`Previous Week Sales` desc) as `Previous Week Ranking`
 from
 (SELECT input1.`Product ID`,sum(input1.`Previous Week Sales`) as `Previous Week Sales`,sum(input1.`Sales`) as `Current Week Sales`
  FROM input1
  WHERE
  input1.`Week` = DATE_TRUNC('week',[DYNAMIC_PARAMS.Query Date])
  and
  (input1.`Business Unit` in ([DYNAMIC_PARAMS.BU/Region]) or 'All' in ([DYNAMIC_PARAMS.BU/Region]))
  and
  (input1.`Store Name` in ([DYNAMIC_PARAMS.Store ID])  or 'All' in ([DYNAMIC_PARAMS.Store ID]))
  group by input1.`Product ID`) AS a ) t
order by t.`Current Week Ranking`
Note:
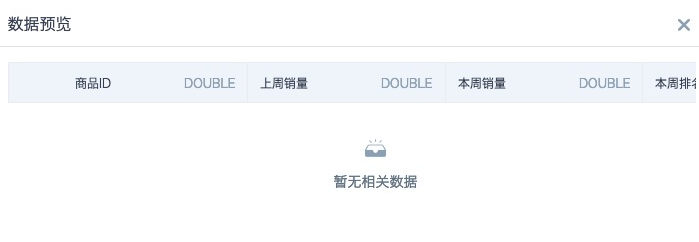
-
'All' in ([DYNAMIC_PARAMS.BU/Region])/ 'All' in ([DYNAMIC_PARAMS.Store ID]) 'All' can be replaced with the default value of that parameter. Adding this condition to judge the parameter default value is to achieve that when the filter is empty, this field does not participate in calculation. Otherwise, even when the filter is empty, the parameter default value will participate in calculation, but generally there won't be an "All" option in the field, which will cause the card to not calculate any data when the filter is empty.
-
Because parameter default values basically don't exist in the dataset field value range, it's normal for the view dataset preview to show no data.
5. Return to the dashboard and create the card. Each product ID has already been aggregated to only one row of data in the view dataset, so numeric fields can be dragged to the value column without selecting or modifying the aggregation method. Create new calculated field 1 "Front and Back 5 Rankings List" (text type) and field 2 "Parameter Judgment" (boolean type). Drag "Parameter Judgment" to the filter column, keep the default option True unchanged. If the table doesn't display data, modify "Query Date" in the "Parameter Default Values" on the right until there is data display, then check if the calculation results are correct.
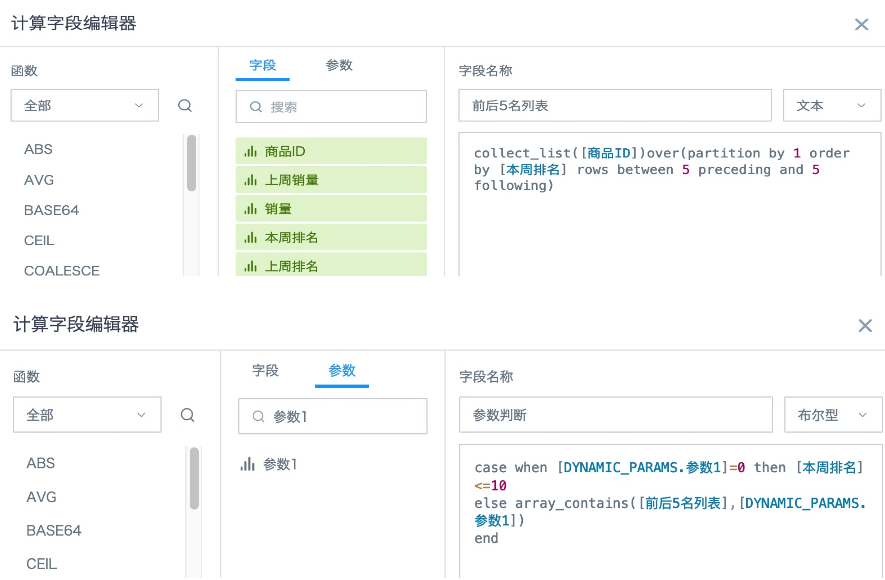
"Front and Back 5 Rankings List" formula:
| 1 | collect_list([Product ID])over(partition by 1 order by [Current Week Ranking] rows between 5 preceding and 5 following) |
Explanation: collect_list is used to merge multiple product IDs in the same column into an array; in the window function, partition by 1 order by [Current Week Ranking] means product IDs are not grouped and arranged in ascending order by ranking; rows between 5 preceding and 5 following means the data range is from 5 rows before the current row to 5 rows after. You can drag this new field to the dimension column to verify the results (remember to remove from the dimension column when saving the card).
"Parameter Judgment" formula:
| 123 | case when [DYNAMIC_PARAMS.Parameter1]=0 then [Current Week Ranking]<=10 |
else array_contains([Front and Back 5 Rankings List],[DYNAMIC_PARAMS.Parameter1])
end
Explanation: case when [DYNAMIC_PARAMS.Parameter1]=0 then [Current Week Ranking]<=10 When the parameter is the default value, set to display the top 10. You can directly modify the parameter default value on the right side of the card, the modified new default value only takes effect for the current card, 0 needs to be consistent with the default value of the parameter on the right. array_contains([Front and Back 5 Rankings List],[DYNAMIC_PARAMS.Parameter1]) can judge whether the parameter value exists in the array of the new field "Front and Back 5 Rankings List".
For window function usage, please refer to [Window Function Usage Introduction](../5-Functions/1-Spark Functions/4-Spark Window Functions and Applications.md).
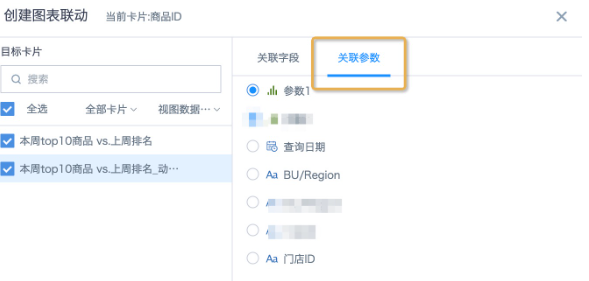
6. After saving the card, return to the page. Set linkage for the 4 filters respectively, select the corresponding parameters and save.
- Highlighting the row of the filtered product ID implementation method:
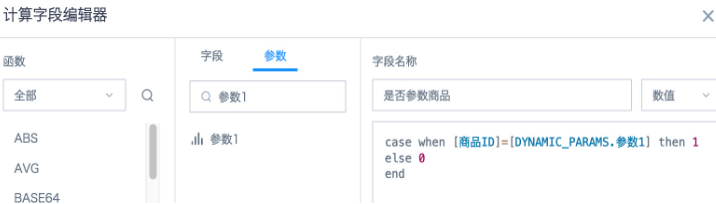
A. Create a new field "Is Parameter Product", reference the parameter corresponding to product ID [DYNAMIC_PARAMS.Parameter1] to judge which product ID is the filtered value.
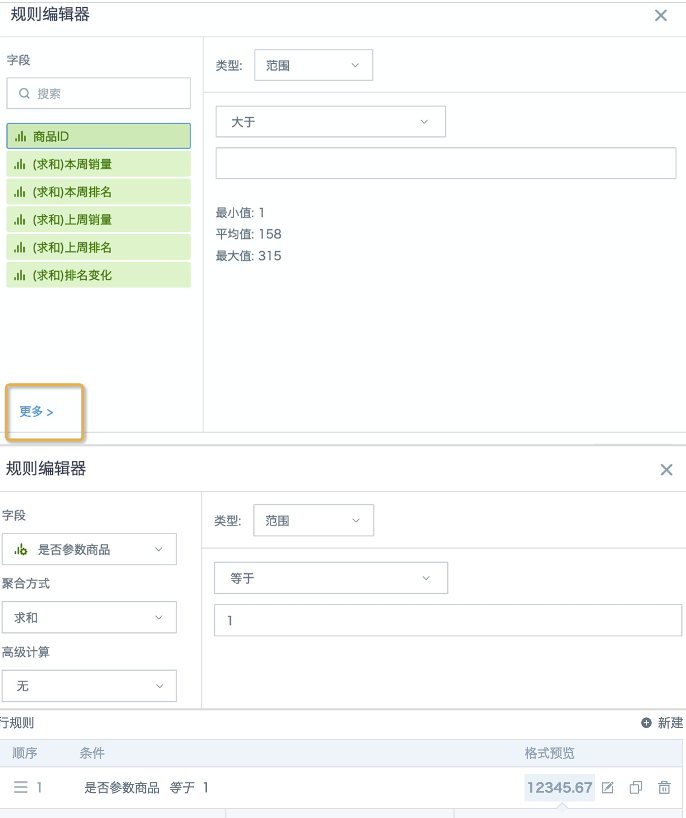
B. Arbitrarily select a field from the dimension column or value column, set conditional formatting, create a new row rule. Since only the fields displayed in the chart are in the list, click the bottom right to enter "More", select "Is Parameter Product", value range equals 1, then set the highlighted format and save.
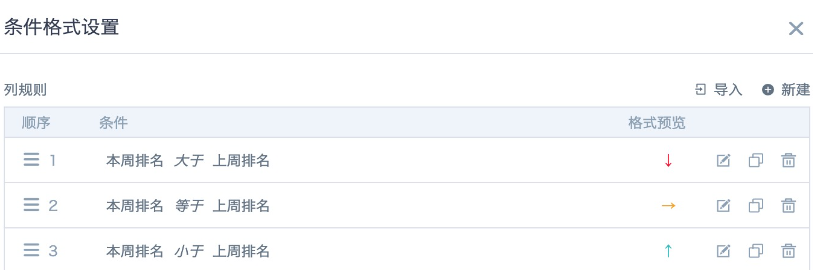
- "Ranking Change" arrow implementation method: Drag "Current Week Ranking" to the value column, set alias as "Ranking Change", click to select "Set Conditional Formatting", set according to the figure below.