Use Window Functions for Cumulative Calculation
Case 1: Monthly Cumulative Sales Amount Calculation
Requirement Background
The user has a sales detail table and wants to calculate monthly cumulative sales amount to measure annual target completion.
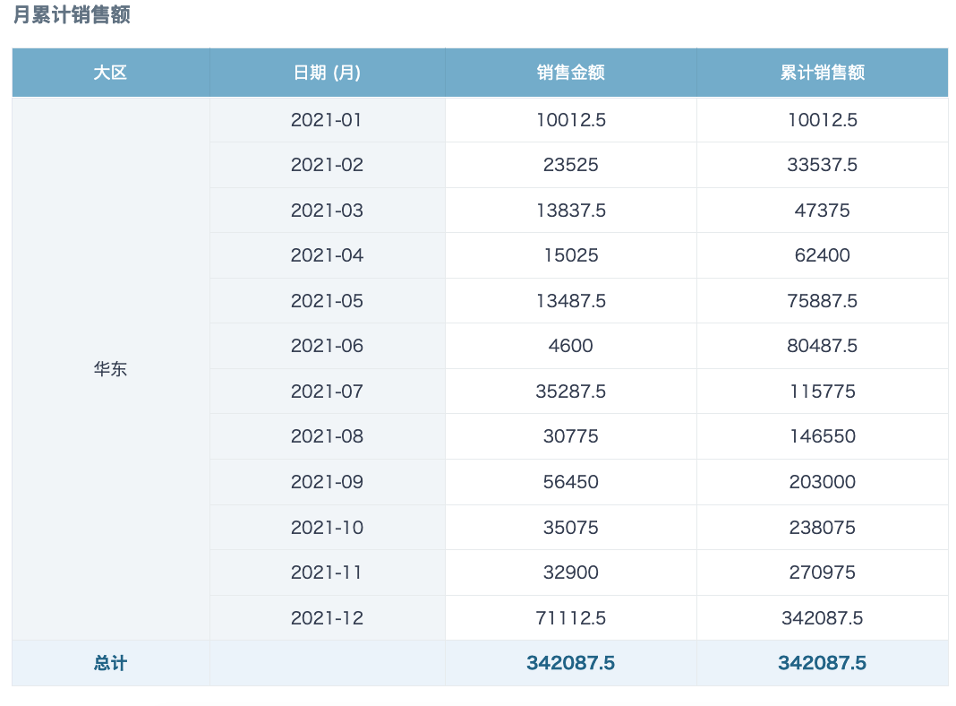
Implementation
This can be implemented in both ETL and cards. The following uses card implementation as an example.
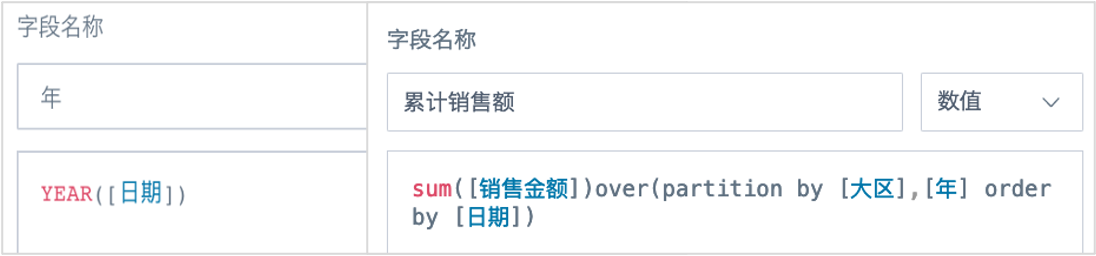
1. Create calculated fields in the card:
Year: year([Date])
     -- To accumulate by year, extract Year. To calculate daily cumulative values grouped by month, extract YearMonth.
Cumulative Sales Amount: sum([Sales Amount]) over(partition by [Region], [Year] order by [Date])
     -- Use a window function to calculate cumulative sales amount by specific dimensions.
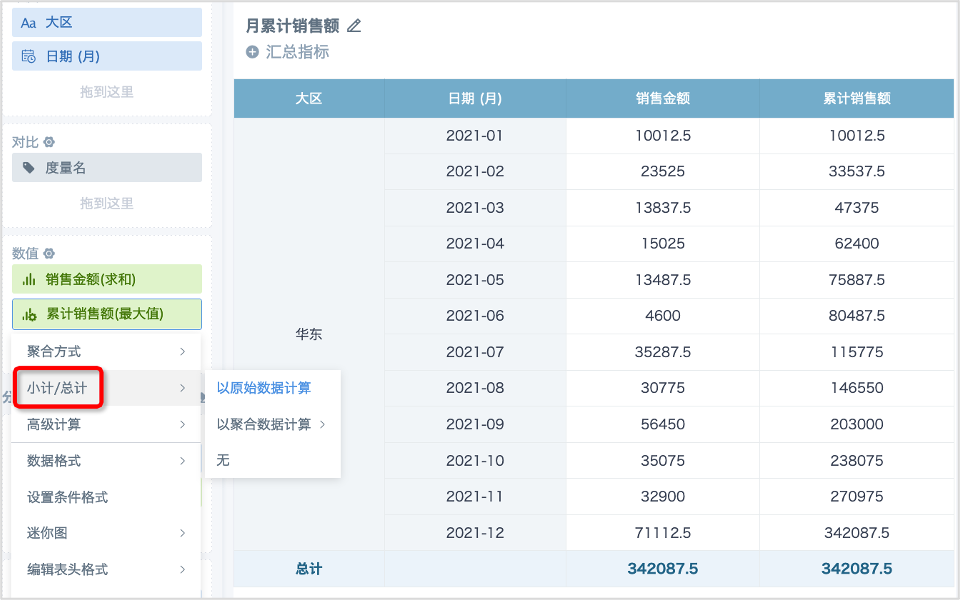
2. Add the dimension fields after partition by in the window function to the dimension area in order. Use the required date granularity for the date field. Add Cumulative Sales Amount to the value area, change the aggregation method to Maximum, and set ascending sort on the date field. If there is a total row, configure Subtotal/Total for this field separately as Calculate Based on Raw Data or Calculate Based on Aggregated Data - Maximum, as shown below.
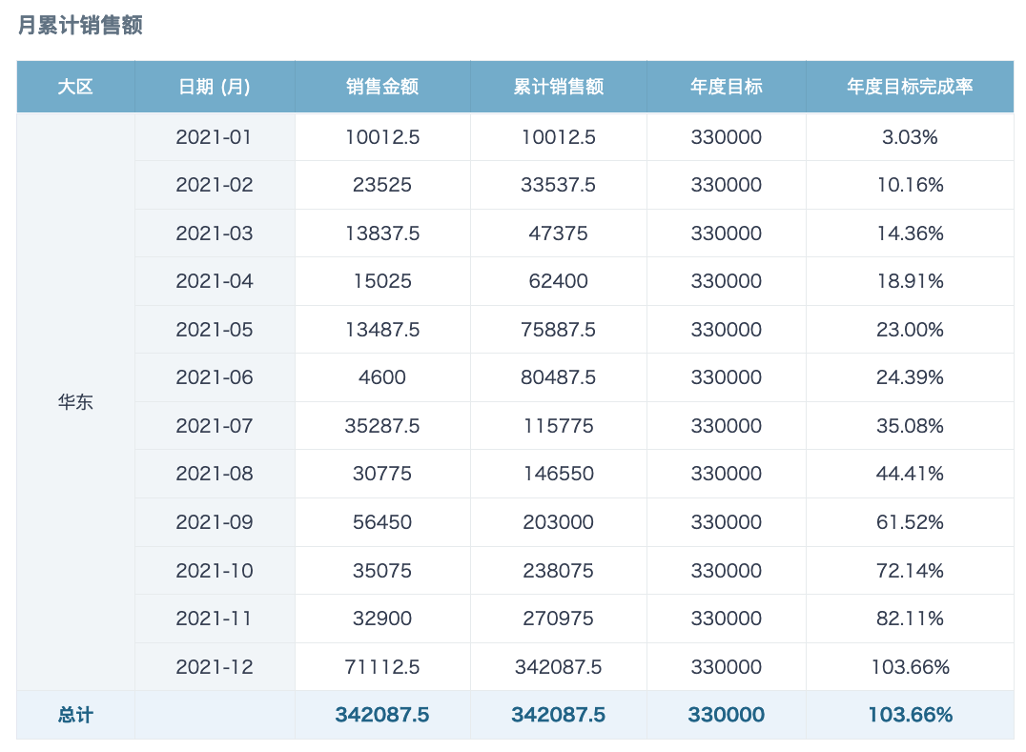
Extended Scenario: Use Cumulative Sales Amount to Calculate Annual Target Completion Rate
- Create the following fields in order:
Month: month([Date])
Monthly Cumulative Sales Amount: max([Cumulative Sales Amount]) over(partition by [Region], [Year], [Month])
Annual Target Completion Rate: [Monthly Cumulative Sales Amount] / [Annual Target]
2. Add Annual Target Completion Rate to the value area, set the aggregation method to Maximum, and set Subtotal/Total to Calculate Based on Raw Data or Calculate Based on Aggregated Data - Maximum. The final effect is shown below.
Case 2: Calculate Cumulative Sales Share of Product Subcategories by Sales Ranking
Requirement Background
Use a store daily transaction detail table to calculate the cumulative sales share of product subcategories. Cumulative sales share = cumulative sales volume / total sales volume.
Cumulative sales volume is obtained by sorting product subcategories by sales volume from high to low and then accumulating them in order. For example, product subcategory C1 has sales volume of 4081 this year and ranks first among all subcategories, so its cumulative sales volume is the sales volume of C1. Product subcategory A3 ranks second among all subcategories by sales volume this year, so its cumulative sales volume is C1 + A3. The rest are calculated in the same way.
Total sales volume is the sum of sales volume for all products.
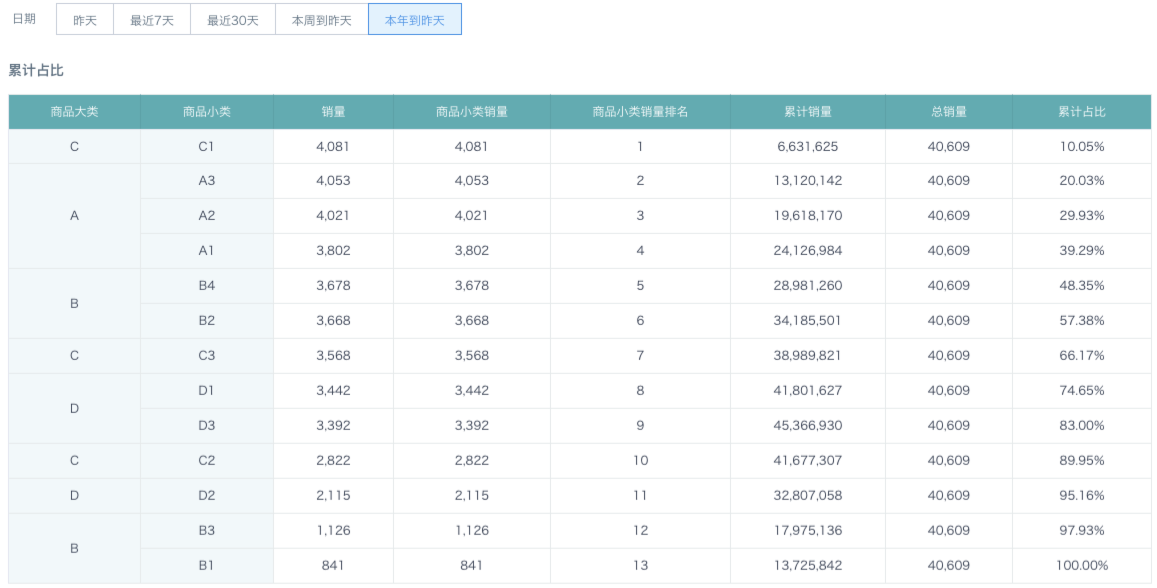
Business Meaning
After calculating cumulative sales share, products can be classified. For example, based on the 80/20 rule, products in the first 80% of cumulative share can be classified into one category.
Implementation
1. Create the following calculated fields in the card:
Product Subcategory Sales Volume: sum([Sales Volume]) over(partition by [Product Category], [Product Subcategory])
    -- Because the dataset also contains dimensions such as product, date, and member, use a window function to calculate product subcategory sales volume for the next step of sorting the aggregated subcategory sales volume.
Product Subcategory Sales Volume Ranking: dense_rank() over(partition by 1 order by [Product Subcategory Sales Volume] desc)
    -- Because the dataset also contains dimensions such as product, date, and member, the actual calculation level is not only the product category and product subcategory displayed on the card, so dense_rank is used for ranking.
Cumulative Sales Volume: sum([Sales Volume]) over(partition by 1 order by [Product Subcategory Sales Volume Ranking])
Total Sales Volume: sum([Sales Volume]) over(partition by 1)
Cumulative Share: [Cumulative Sales Volume] / [Total Sales Volume]
2. Add the fields that need to be displayed from the newly created fields to the value area and set the aggregation method to Maximum. Drag Sales Volume into the sort area and sort in descending order.