Calculate Average Daily Active Users for the Last 7 Days
Scenario: Calculate the average number of active users within 7 days of the selected date, namely Daily Active Users.
Solution: Calculating the 7-day average DAU requires two levels of aggregation. First, calculate the distinct number of users for each day. Then average the numbers from these seven days.
Implementation:
A. ETL: When the logic is fixed, such as aggregating data to day granularity without considering other factors, use group aggregation in ETL to obtain average daily active users, then calculate the average DAU for the last 7 days in ETL or in a card. Disadvantage: this is not flexible. Once more dimension filters need to be added, ETL must be modified frequently, which may also affect other cards that depend on the same dataset.
B. Card/View Dataset: Suitable for scenarios that require flexible filter dimensions. Report creators must be familiar with SQL functions. Disadvantage: when the data calculation volume is large, card loading becomes slower.
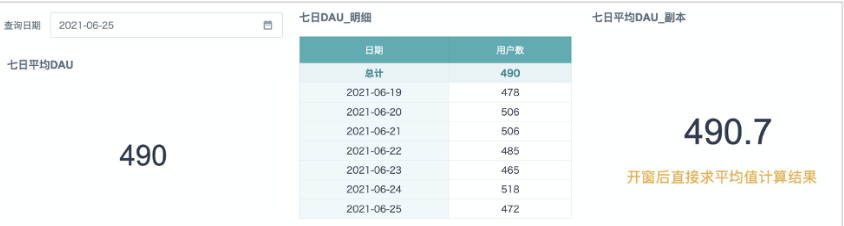
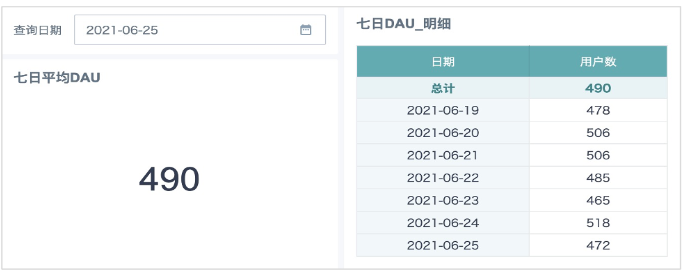
Expected Result: Select a date. One metric card directly displays the 7-day average DAU, and another table shows the daily active users and 7-day average DAU for each day within the 7-day range. This case calculates directly in the card. The result is shown below.
Detail Card Implementation Steps
-
Create a card and place the date field into the dimension field well. If the User ID field used for distinct counting is numeric, drag it directly into the value field well and select Distinct Count as the aggregation method. If the User ID field is text, subtotal/total cannot be set after dragging it into the value field well. In this case, create a numeric field User Count: *count(distinct[*User ID]) and drag it into the value field well to obtain the distinct user count for each day.
-
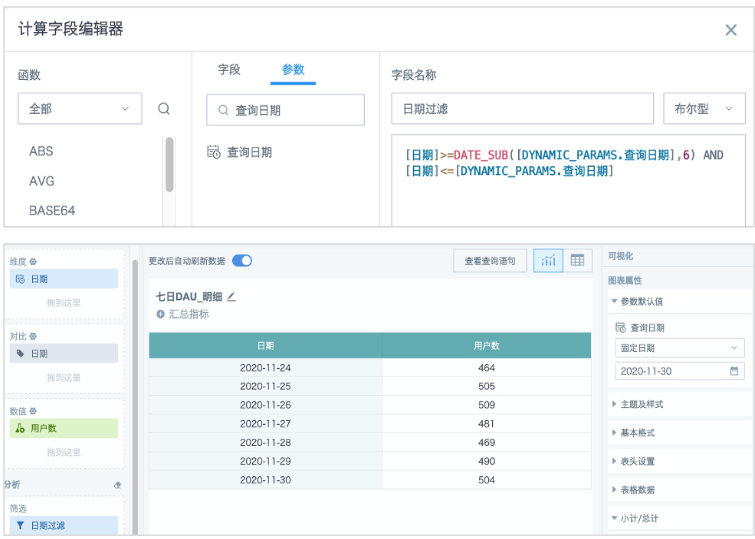
Create a second field Date Filter with Boolean type. Reference a date-type global parameter from the parameter list, then drag this field into the filter field well. Keep the default value TRUE. This filters out 7 days in total, including the parameter date and the previous 6 days.
Formula: *[**日期]>=DATE_SUB([DYNAMIC_PARAMS.**查询日期],6) AND [**日期]<=[DYNAMIC_PARAMS.*查询日期]
Note: If the table shows no data, temporarily modify Parameter Default Value on the right to ensure data is displayed and to verify data accuracy.
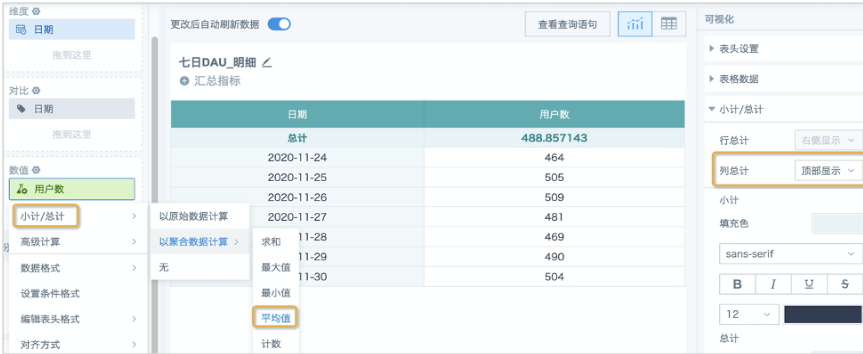
- On the right, find Visualization -- Subtotal/Total, set the display position of the column total, then click the value field User Count and set the subtotal/total calculation method to Calculate Based on Aggregated Data -- Average. At this point, the Total row displays the 7-day average active users.
- Return to the page, create a date filter, and link it to the global parameter in the card.
Metric Card Implementation Steps
- Refer to the Boolean field Date Filter in the detail table and create the same field in the metric card. Drag this field into the filter field well. Keep the default value TRUE. This filters out 7 days in total, including the parameter date and the previous 6 days.
Formula: *[****日期]>=DATE_SUB([DYNAMIC_PARAMS.**查询日期],6) AND [**日期]<=[DYNAMIC_PARAMS.*查询日期]
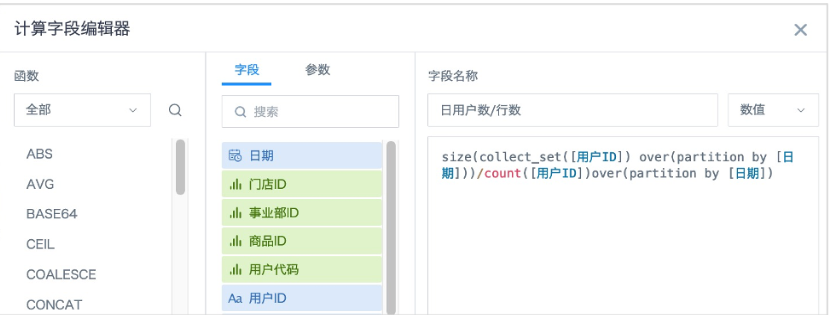
- Create a numeric field Daily Users / Row Count.
Formula: size(collect_set([用户 ID]) over(partition by [日期]))/count([用户 ID])over(partition by [日期])
Logic: First use a window function to calculate the distinct user count for each day. Because window functions do not reduce the number of rows in the original table, divide by the number of rows for each day's data and distribute the daily distinct user count evenly across each row. This makes the next calculation correct.
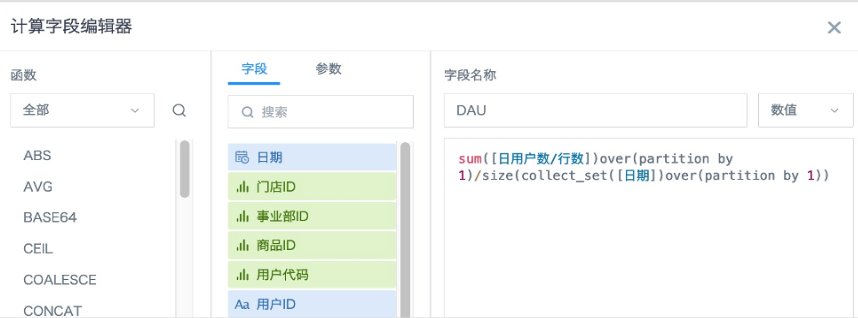
- Create another numeric field DAU, drag it into the value field well, set the aggregation method to No Processing, and save the card.
Formula: sum([日用户数/行数])over(partition by 1)/7
Logic: Sum Daily Users / Row Count from the previous step to obtain the total daily active users within the date range, then divide by the number of days to obtain the average active users within 7 days. If dates may be discontinuous or fewer than 7 days and you only need the average of valid days, use the formula sum([日用户数/行数])over(partition by 1)/size(collect_set([日期])over(partition by 1)).
- Return to the page, create a date filter, and link it to the global parameter in the card. After selecting a date, the metric card and table card calculate the same result. You can also add other filters as needed.
Q&A:
Q: In the metric card, why not use size(collect_set([用户 ID]) over(partition by [日期])) to calculate daily active users and then directly use Average as the aggregation method?
A: The card's built-in Average aggregation method calculates by adding each row of data and dividing by the number of rows in the original table. Even if 7 days are filtered in the card, it does not mean the number of data rows is aggregated into 7 rows. If you directly calculate the average with size(collect_set([用户 ID]) over(partition by [日期])), the logic is equivalent to (Day1a + Day2b + ... + Day7g)/(a+b+c+d+e+f+g), which produces an inaccurate average. The calculation logic above is (Day1/aa + Day2/bb + ... + Day7/gg)/7. It first reduces the data and then expands it through summation, which is equivalent to adding daily active users and dividing by the number of days. The comparison of the two calculation results is shown below.