Holiday Data Distinction and Comparison
Scenario
Many industries (such as retail) have significant differences between holiday and working day sales data, and when doing data analysis, it's necessary to distinguish between holiday and working day data. However, databases generally only save dates and don't specifically save holiday dates and lunar dates, making it difficult to identify Chinese lunar holidays; and Chinese holidays are accompanied by weekend adjustments, so simply judging Monday to Friday as working days is not rigorous enough. For example, it's very inconvenient for users to compare sales data from two Spring Festivals in Guandata BI. This article introduces how to quickly and simply annotate statutory holiday information and use it for year-over-year and month-over-month calculations.
Implementation Steps
1. Prepare Holiday Manual Table
-
Create an Excel document, manually input the first day of the year, then drag down to fill to the last day of the year.
-
According to the annual holiday arrangements announced by the State Council (2021 Holidays), manually supplement holiday and adjustment information in the second and third columns. Non-statutory holidays can be supplemented as needed.
-
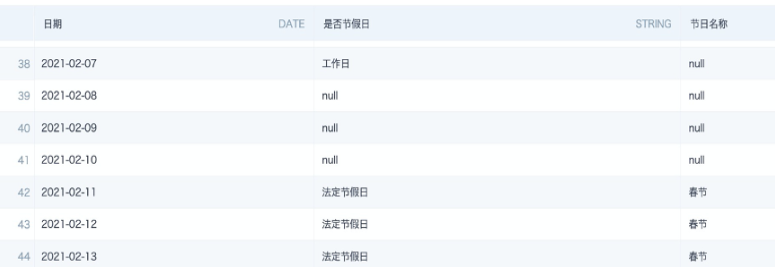
Upload the file to BI, and append new year's holidays to this table once at the end of each year. The figure below is for reference only.
2. Use ETL to Process Files
-
Use the holiday table as input dataset in ETL.
-
Add calculated columns, use the function weekday() +1 to get which day of the week each day is.
The return result is an integer between 1 and 7, where in the WEEKDAY function 0=Monday, 1=Tuesday, ..., 6=Sunday.

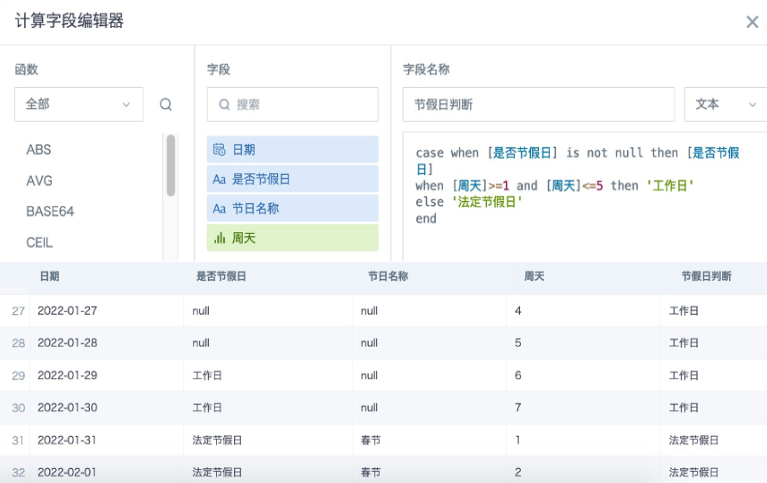
- Add another calculated column, based on the original holiday information and the weekday information obtained in the previous step, re-judge whether each date is a holiday or working day. This article's case study doesn't distinguish between holidays and weekends separately, using the formula and preview effect as follows:
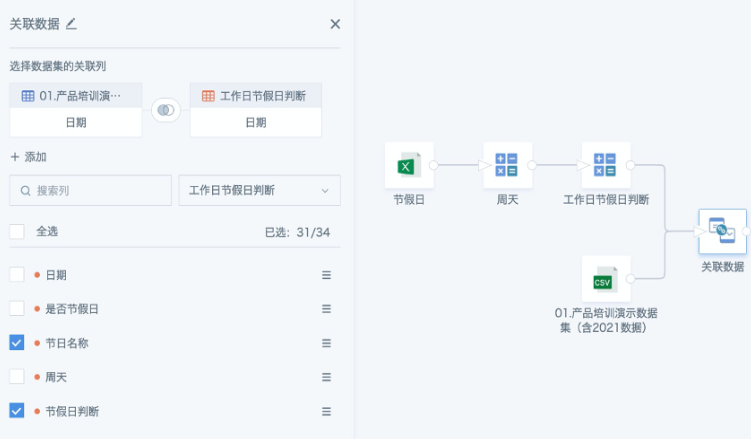
- Use the join node to associate the business dataset containing date fields with the holiday dataset processed above. Process the data according to your needs, save and run ETL.
3. Create Cards
-
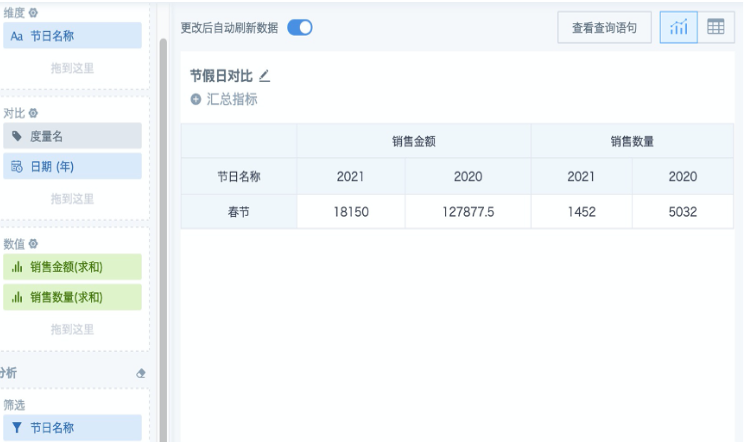
Put the "Holiday Name" field in the dimension column, "Date (Year)" in the dimension column or comparison column,
-
Add the required filter conditions, so you can compare data from the same holiday in two years.
4. Final Effect
- When only comparing values, "Date (Year)" can be placed in either the comparison column or dimension column, demonstration creation as shown in the figure below:
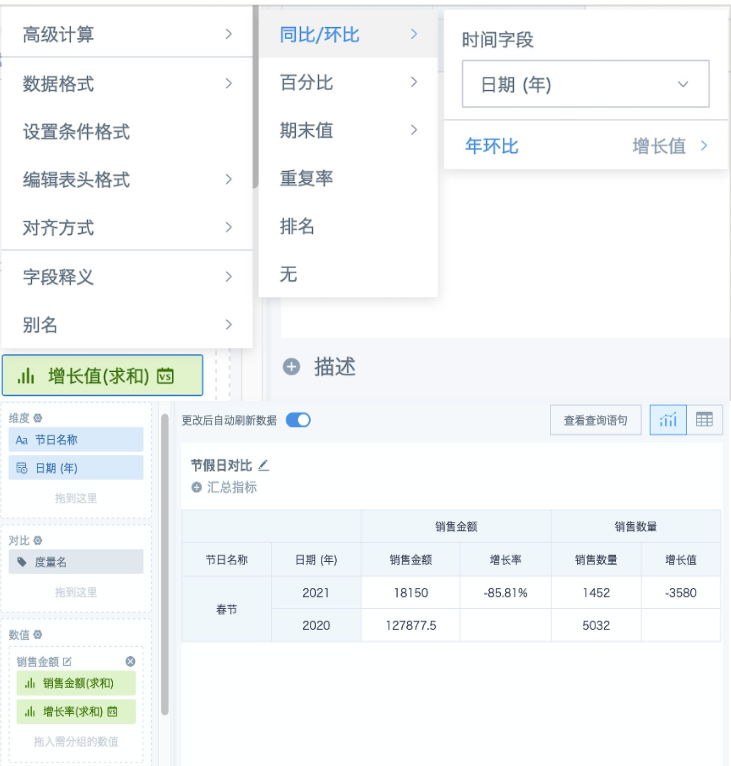
- When growth values or growth rates need to be calculated, you need to put "Date (Year)" in the dimension column, then use numeric fields with "Advanced Calculation -> Year-over-Year/Month-over-Year -> Year-over-Year", demonstration creation as shown in the figure below:
