Chinese-style Report, Formerly Complex Report, FAQ
Why does the G_LOOKUP function return 0 for matched data when data actually exists?
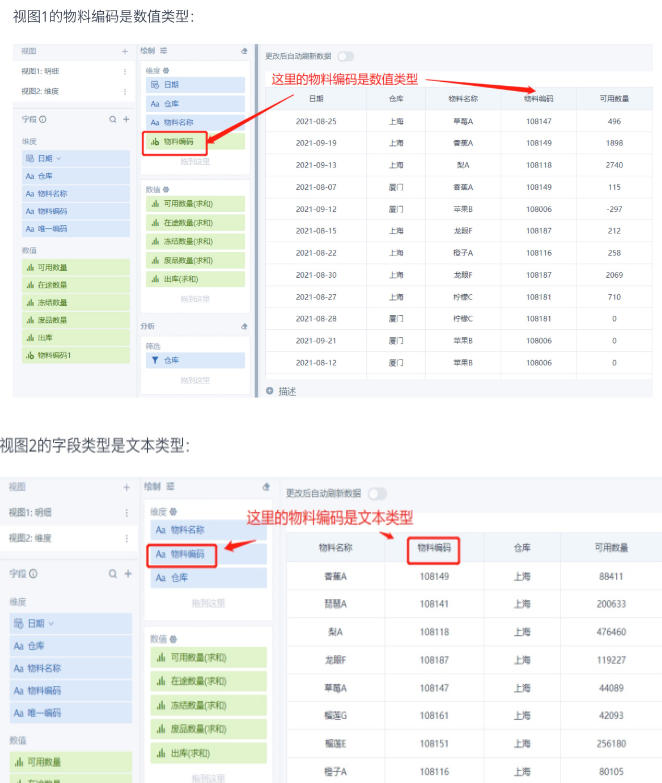
Cause 1: When data in View 2 is matched by a field from View 1, the matching fields in the two views may have inconsistent field types.
Solution: Keep the same field type consistent across different views. To convert a type effectively, create a calculated field and use a function to convert it.
? Case 1. Click to expand.
Formula: =G_LOOKUP(9,Details,Available Quantity,Material Code
,Warehouse)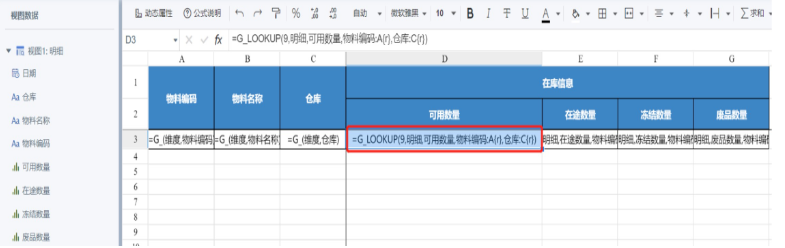
Solution:
Use a function to convert the Material Code field in View 1 into a text field. The data can then be matched normally.

Cause 2: The query condition in the G_LOOKUP formula uses a value in double/float format.
Solution: Do not use values in double/float format as dimensions or query conditions, because precision issues may prevent correct matching. If the scenario requires this, use a function to limit the number of decimal places and convert the value to text format.
Cause 3: The query condition in the LOOKUP formula uses an aggregate calculation result from the measure area. In G_LOOKUP/G_LOOKUPEXP functions, query conditions currently support only fields from the dimension area.
Solution: Put the measure field used as the query condition into the dimension area. If the value needs calculation, calculate it in ETL or use a window function in the card.
? Case 2. Click to expand.
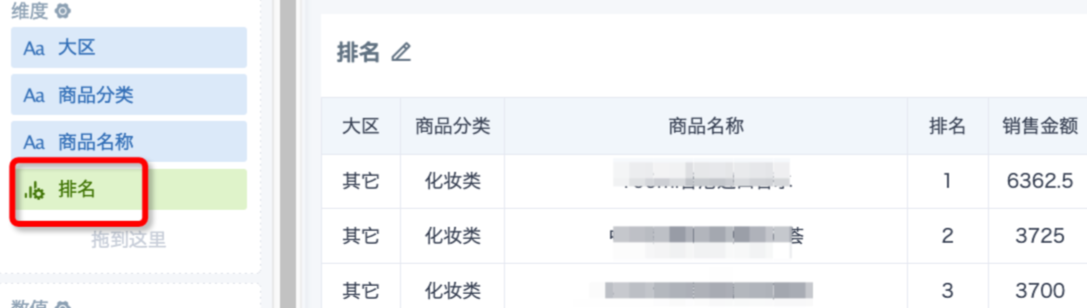
Use Advanced Calculation - Ranking to calculate the top 10 sales quantities for each region and each product category, and then use Ranking as one of the query conditions in the template.
Formula: =G_LOOKUPEXP(9,view1,Region,view1,Product Name,Product Category
,Ranking,Region:C1)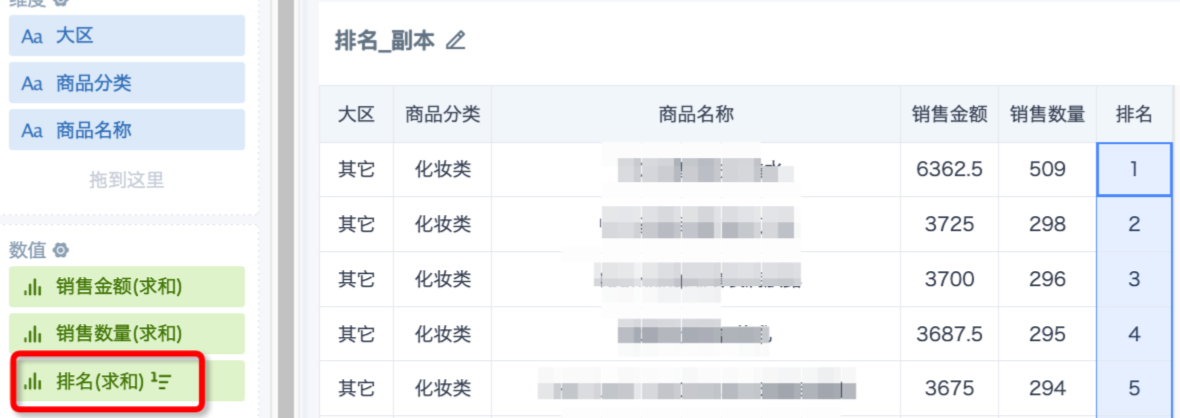
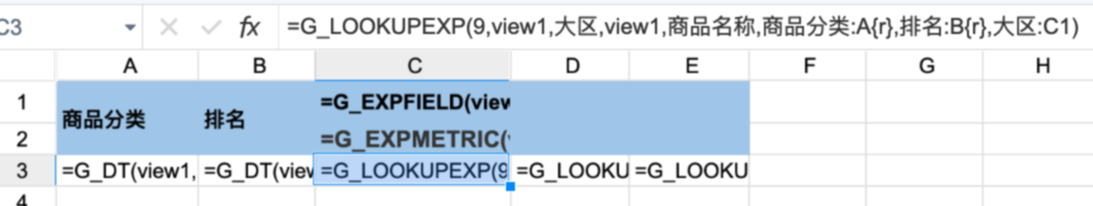
Solution: In the data preparation stage, use a window function to calculate ranking, and put Ranking into the dimension area.
When using sum() to calculate a column total, why does the result show 0 even though data exists?
Cause: The field referenced by the current column may not be numeric, such as a text field, so it cannot be summed.
Solution: In the view, use a function to convert the field to a numeric type and place it in the measure area.
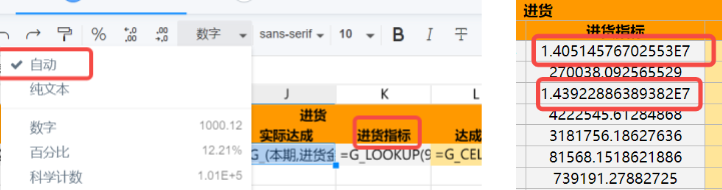
Why does a column changed to number format become automatic format after saving, with numbers displayed in scientific notation?
Cause: The field being summed in the G_LOOKUP formula is in text format. Summing text and setting a format leads to inaccurate calculation results, and the format does not take effect. When the numeric length is too long, the Excel component automatically displays it in scientific notation.
Solution: Use a function in the view to convert the field format. For example: cast([Field] as double)
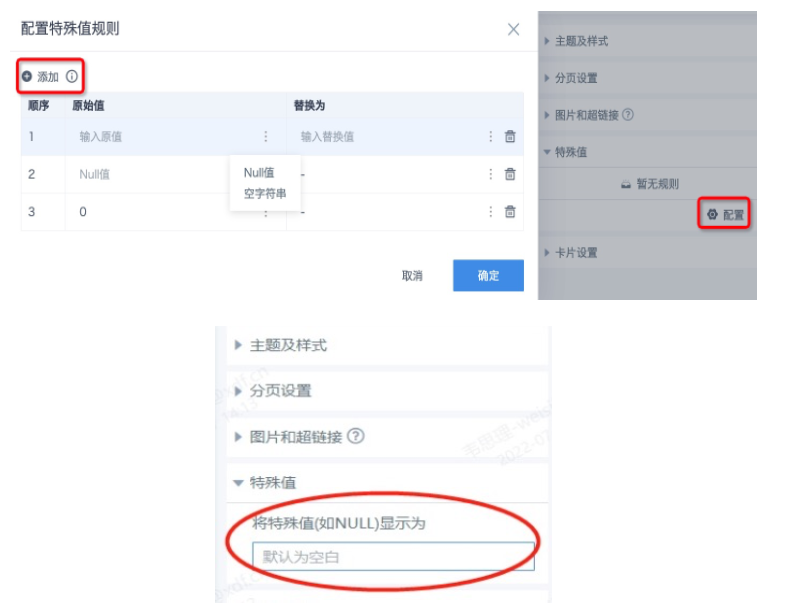
Can 0 or null values in a complex report be replaced with other symbols?
Answer: In version 4.8 and later, open the report preview page and expand Special Values on the right to configure multiple replacement rules. Pay attention to the replacement rules, which you can view by clicking the icon after adding a rule. Versions earlier than 4.8 support only null value replacement.
? Example. Click to expand.
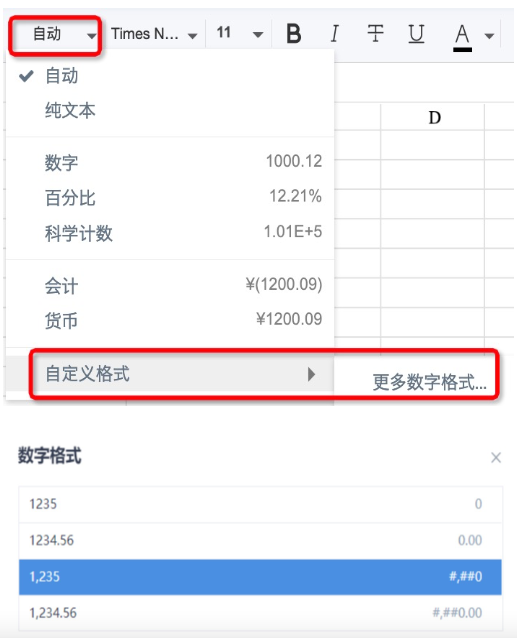
How do I set thousands separators for data?
Local editing mode: Set the format in Excel and then upload the template.
Online editing mode:\
- Select the cell or formula to configure.\
- In the header, select Custom Format - More Number Formats, choose the required number format, and click OK.
? Step example
Tip: 1. In online editing mode, values with thousands separator format currently cannot be displayed as currency format "¥..." at the same time.
2. Thousands separators are available in version 4.2.0 and later.
Why does complex report data show #DIV/0?
Cause: When the denominator is 0, an error occurs and #DIV/0! is returned. Solution: Use Excel's built-in if(iserror()) function to replace it. Example: =G_CELLCALCEXP(if(iserror((B{r}-C{r})/B{r}),"--",(B{r}-C{r})/B{r}))
Why does increasing or decreasing decimal places from the toolbar not take effect?
Cause: The default cell format is Automatic, which does not support decimal place adjustment.
Solution: Manually change the format to one with decimal places, such as number, percentage, or currency, and then adjust the decimal places.
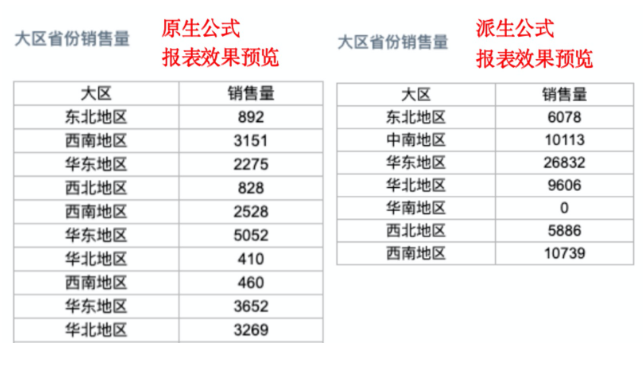
What is a derived table?
Answer: A derived table, or Dynamic Table, derives a new table from fields selected from the original table for vertical expansion, and automatically sorts and deduplicates the data. It is sorted in ascending order by default, and the sorting method cannot be adjusted. This is equivalent to placing fields in the dimension area of a card.
Comparison of report previews generated by native formulas and derived formulas:
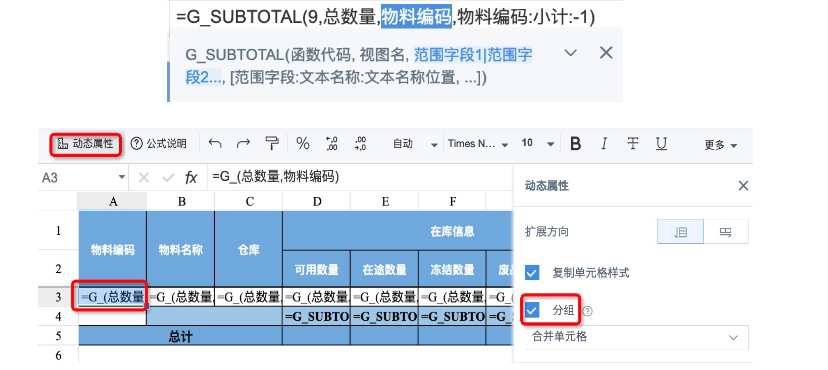
Why does the subtotal formula not take effect?
Possible cause 1: The cell that contains the range field referenced by the subtotal does not have a Grouping method set in dynamic properties.
Solution: Set a grouping method for the cell containing the subtotal range field. There are three grouping methods. Merge Cells is commonly used.
Actual scenario:
Here, the subtotal range field is Material Code, which means the data is grouped and summed by Material Code. Therefore, the dynamic properties of Material Code in cell A3 must have Grouping selected.
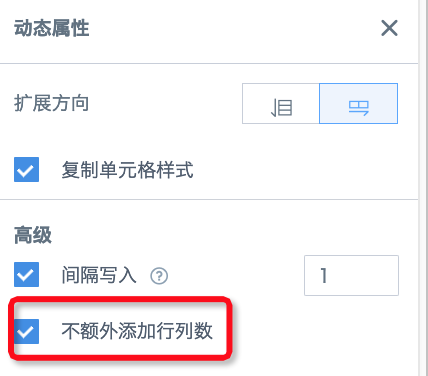
Why are there more columns than expected after horizontal expansion?
Cause 1: When multi-row headers expand at the same time, or multiple columns of data expand alternately, Do not add extra rows or columns is not selected in dynamic properties. This causes multiple cell formulas to expand repeatedly.
Solution: Except for the last horizontal expansion formula, select Do not add extra rows or columns in the dynamic properties of other formulas. For details, see Explanation and Use Cases for Not Adding Extra Rows or Columns.
Cause 2: The derived table is used incorrectly in derived formulas. This mainly includes two cases: 1. formulas in different cells of the same column do not use the same derived table, causing each formula to expand to a different number of columns; 2. double values, timestamp date-time fields, or similar fields are incorrectly used as derived table fields, causing too many columns to expand.
Solution: 1. Use the same derived table for all formulas in the same column. 2. In derived formulas, use text string or integer int fields as derived tables.
Cause 3: A derived formula is used where horizontal expansion is not needed.
Solution: Use a formula without a derived table, or manually create and use a derived table with only one value.
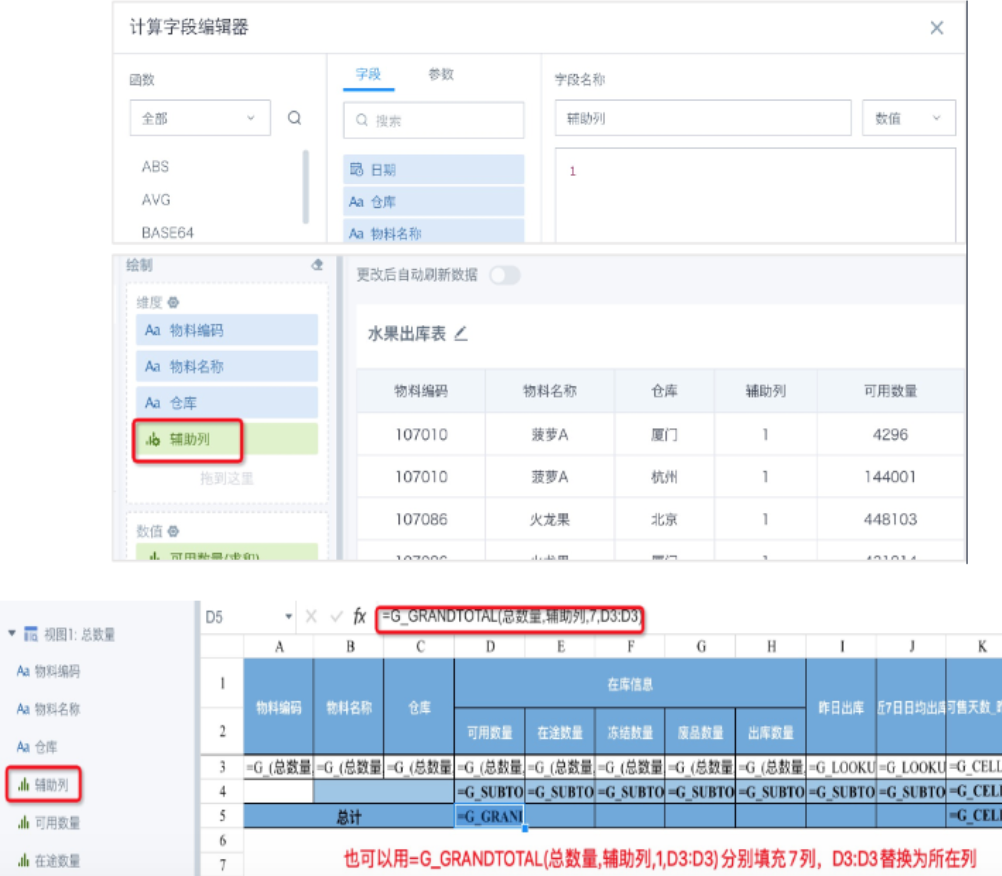
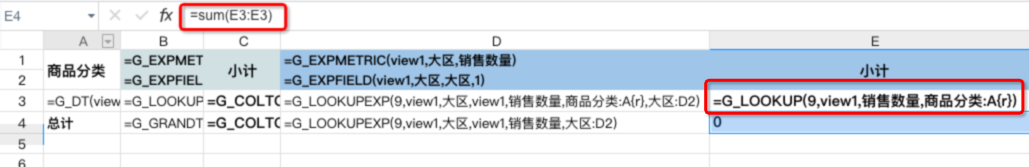
How do I prevent row totals (G_COLTOTAL) and column totals (G_GRANDTOTAL) from expanding horizontally?
Solution 1: Row total (G_COLTOTAL) and column total (G_GRANDTOTAL) formulas must reference a derived table. If horizontal expansion is not needed, create a fixed field in any view, with any content, and drag it into the dimension area. Then use this view and field as the derived table in the total formula. See the following figure. This method applies to all derived formulas, such as G_LOOKUPEXP.
Solution 2: Do not use total formulas. Use other formulas such as sum() instead. See Different Calculation Methods for Complex Report Column Totals.
In a complex report, why can't frozen panes freeze expanded rows and columns?
Cause: Frozen panes and frozen rows/columns are physical freezes. The freeze range is fixed and cannot change dynamically as rows and columns expand.
Solution: Freeze only the header section.
After page filtering, why do some cells in a complex report show the error value #NAME, while they are normal without filtering and in preview?
Case:
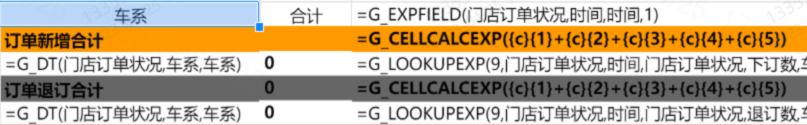
Cause: The left-side dimension expands vertically and dynamically. As filter conditions change, the number of rows is not fixed. However, in this case, the inter-cell calculation formula =G_CELLCALCEXP({c}{1}+{c}{2}+{c}{3}+{c}{4}+{c}{5}) requires exactly 5 vertically expanded rows for accurate calculation. Once the row count differs, the calculation result becomes inaccurate or cannot be calculated and displayed.
Solution: If dimensions are fixed, use a fixed header. If dimensions are not fixed, change the summation method or the display style. For more summation methods, see Different Calculation Methods for Complex Report Column Totals.
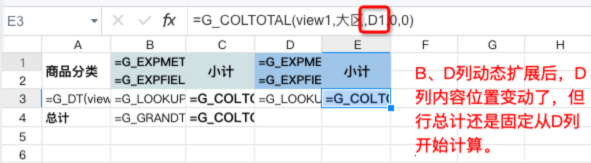
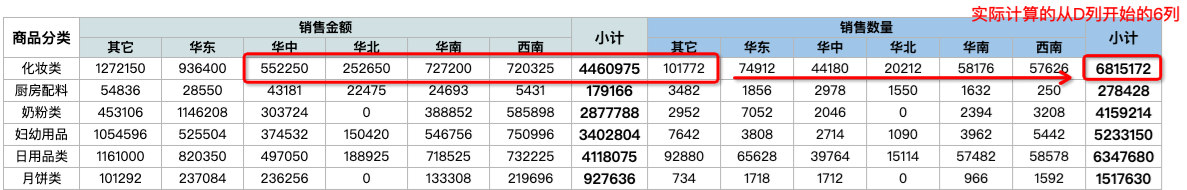
Why is the row total (G_COLTOTAL) calculation incorrect after multiple horizontal expansions?
Cause: Row total (G_COLTOTAL) and column total (G_GRANDTOTAL) formulas need a specified calculation range. During the first dynamic expansion, the initial position of the calculation range is correct, and the range after expansion is also accurate. Starting from the second expansion, the range to be calculated has changed dynamically, but the system cannot identify the changed range and still calculates according to the range in the formula, causing incorrect results.
Solution:
1) Merge multiple similar expansions into one expansion and place all row totals at the end. For details, see Complex Report Row Total Implementation Methods.
Case 1. Click to expand.
2) If row totals need to follow each expansion separately, or if multiple expansions have inconsistent column counts, then starting from the second expansion, do not use row total (G_COLTOTAL) or column total (G_GRANDTOTAL) formulas. Use G_LOOKUP/G_LOOKUPEXP/SUM() to calculate row totals and column totals.
Case 2. Click to expand.
Solution:
How can a complex report jump to another dashboard page with parameters?
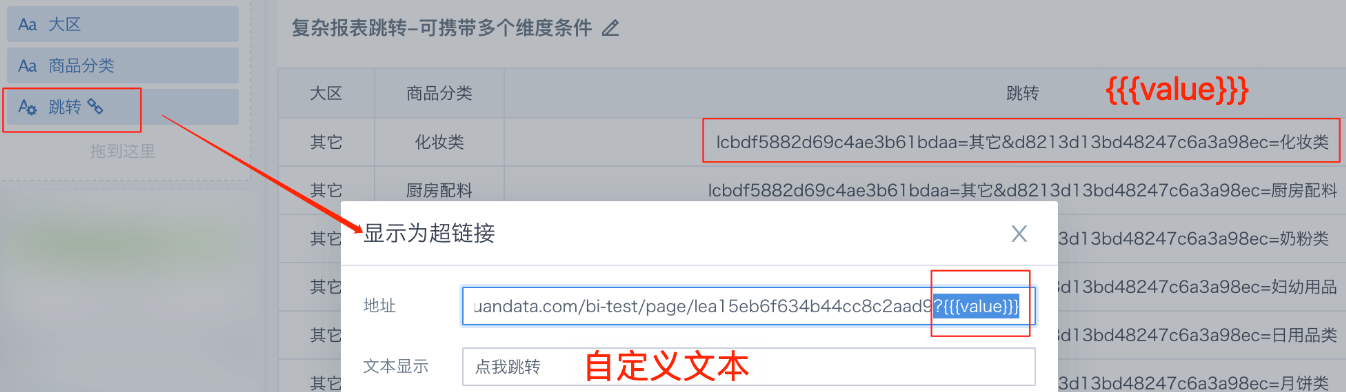
Answer: Although the complex report card itself does not support Jump settings, you can set a dimension field to Display as Hyperlink to jump to the target page with current dimension information.
Solution:
1) Ensure that the target page has a filter that can pass parameters. Copy the target page link and the filter ID.
2) In the data preparation page of the complex report, set the dimension field that needs a jump to Display as Hyperlink, and concatenate the target dashboard page URL with filter conditions. Then drag this field into the complex report. For parameter concatenation, see Add Condition Parameters to Page URL.
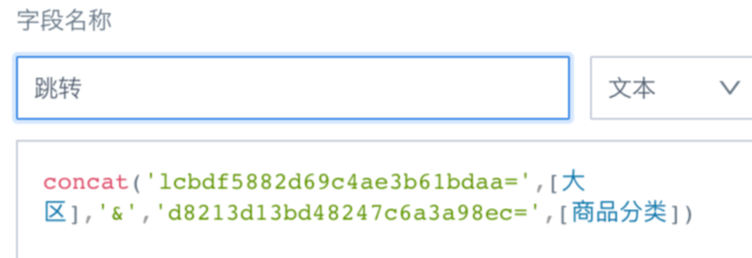
- If multiple dimension values need to be carried during the jump, such as both [Region] and [Product Category], create a calculated field in the view and concatenate the two filter IDs and options together. You can also concatenate the full URL directly. See the following figure.
Why can't a template be saved after editing again when it contains many formulas?
Possible cause: The frontend template size limit is 10 MB. A template larger than this cannot be saved.
Solution: In version 5.9, the template limit is changed to 30 MB. You can upgrade to 5.9. Also optimize the template design and avoid writing too many formulas that occupy too many cells.