Card FAQ
After a field is dragged into the color area, the legend is no longer distinguished by numeric fields
For legend colors, Color has higher priority than Value.
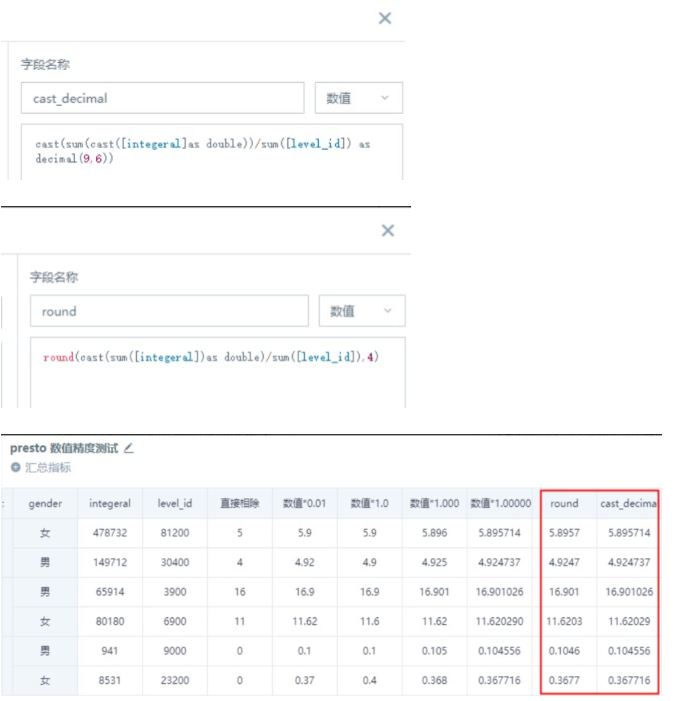
Solution for integer division results remaining integers in direct-connection databases
In databases such as Greenplum, PostgreSQL, and Presto, dividing two integers may still return an integer, causing decimal precision loss.
Solution
-
Method 1: Directly multiply the value by 1.0. Multiplying either the numerator or denominator by 1.0 converts the integer to a floating-point number. Note that the number of decimal places may affect data precision, so determine the decimal places as needed. Guandata BI supports retaining up to 6 decimal places, so even multiplying by 1.00000000000 retains only the first 6 decimal places.
-
Method 2: First convert either the numerator or denominator field to double/float, then use the round() function or cast(xxxxx as decimal()) to specify the number of decimal places. Use the function corresponding to the database.
Method 2 example
Solution for incorrect display of long numeric values
Background: When users create a file dataset from a CSV file or create an extracted dataset, some fields may store long numeric values with more than 15 digits, such as order IDs or user IDs. After the dataset is created, the system recognizes them as Long fields, and the values may change. For example, the last digits may display as 0. Later reports will then keep using incorrect data.
Cause: Long and Int types are similar and are used to store integers. Although Long is generally considered to occupy 4 bytes, with a maximum value of 10 digits, around 2.1 billion, this may vary across compilation environments. This issue also often occurs when opening CSV files in Excel or directly entering long numeric values in Excel cells.
Solution\
-
Method 1: Upgrade BI to version 4.4 or later.
-
Method 2: If you do not want this type of field value to change under any circumstances, store long numeric values as String in the original database, change the field type to String during the final preview step of dataset creation, or convert the field type to String later. Recommended Spark function: cast([Field Name] as string).
Incorrect results when comparing timestamps and dates
Cause: The date field is in timestamp format, but 2020-02-02 in >=2020-02-02 or <=2020-02-02 is in string format. The comparison is performed as a string comparison, meaning length comparison, which causes issues.
Solution
-
Method 1: Change the date format in the dimension: Use the to_date() function to convert timestamp format to date format.
-
Method 2: Change the comparison condition. Change the comparison condition directly to: [Date] >= "2020-02-02 00:00:00" and [Date] <= "2020-02-02 00:00:00".
Related issue
Issue: Two parameter filters are set as start time and end time, both defaulting to {{{yesterday}}}. When the default value is used or the same day is selected, linked cards have no data. Cause: Troubleshooting found that the date field in the dataset is in timestamp format, so it cannot be compared correctly. Use Method 1 and convert timestamp format to date format with to_date(). Summary: When comparing dates, formats or string lengths must match. If the field is timestamp format, the comparison condition should generally also be timestamp format. If the field is date format, the comparison condition should generally also be date format.
Are empty strings counted during distinct count?
Yes. Empty strings are counted. If you do not want them counted, replace empty strings with null values, because null values are not counted.
When using a card to create detail data download, why are some downloads limited to 50,000 rows and others to 100 rows?
The default limit for exporting data to Excel is 50,000 rows and can be changed in Admin Settings. However, if Display Count is set to 100 in the dimension area on the card editing page, the exported data has 100 rows.
If a text field is placed in Values and aggregation is set to No Processing, Maximum, or Minimum, what is the display logic?
Text values can also be compared by ASCII order. Maximum is max(), minimum is min(), and no processing takes the first row in the dataset without sorting.
Why do two cards from the same direct-connection dataset with the same filter conditions show inconsistent data?
Possible cause: Direct-connection dataset cache.
If Support Real-time Card Data is enabled for the dataset and Real-time Data is enabled on the page, card data may be cached. The specific cache validity period depends on the settings under Dataset/Data Update.
Card editing triggers data queries. On the card editing page, if Auto Refresh Data After Changes is enabled, each edit refreshes the cache and directly fetches data from the database. If it is not enabled, each edit queries cached data within the cache validity period.
Solution
-
After card editing and saving, refresh the page consistently to refresh cached data.
-
In Direct-connection Dataset/Data Update, select No Cache when setting cache validity to minimize cached data.
More: View more information about direct-connection dataset cache
Why does card editing prompt that the row count of datasets supporting auto refresh has reached the upper limit?
Cause: This occurs because the dataset is too large, over 1 million rows. To ensure system operation efficiency, this switch is not allowed to be enabled by default. You can modify the upper limit for dataset rows that support automatic refresh when editing non-direct-connection cards on Admin Settings > Operations Management > Card Parameter Configuration.
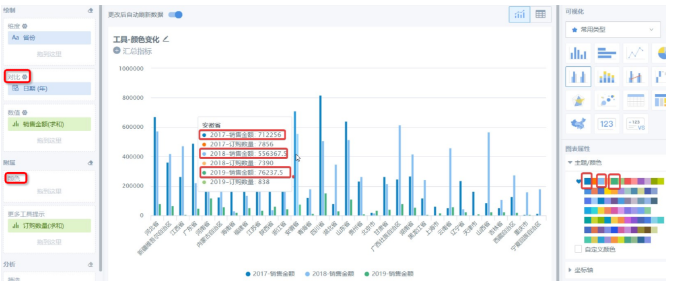
Chart colors change after adding Tooltip
Cause analysis: Adding Tooltip actually adds a dimension, so the value order changes.
Solution: 1. If there is no Compare field, colors do not change before and after adding Tooltip. Consider removing the Compare field.
- If the original coloring is based on the dimension Color field, colors also do not change before and after adding Tooltip. Consider adding the Color field.
A table in a card has totals configured, but no data is shown
(1) For table display performance, calculated table data is limited to 20,000 aggregated rows. Therefore, when the data volume is too large, totals may not be displayed. Usually, external filters narrow the table data range, and totals have values when the data volume does not exceed the limit. We recommend adding filters to organize data and solve incomplete display issues. (2) For some aggregate measures that use formulas, the system cannot correctly display totals, so totals are not shown.
(3) If the numeric field aggregation method is No Processing, totals are not calculated. Switch to another aggregation method.
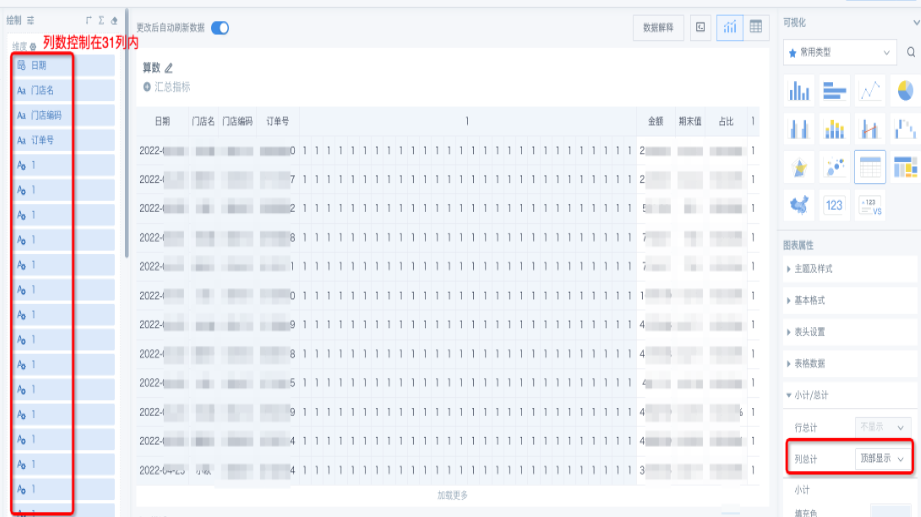
Totals are not displayed or are displayed abnormally
The number of columns in table dimensions cannot exceed 31. If it exceeds 31, subtotals/totals are not displayed.
Where can the raw data of the user behavior analysis page be viewed?
Raw data can be viewed in Data Center. The folder is Built-in-Dataset, and the dataset type is Built-in Dataset.
Row total is grayed out. How can row total be configured?
Row totals can be calculated only when there is a field in the Compare area.
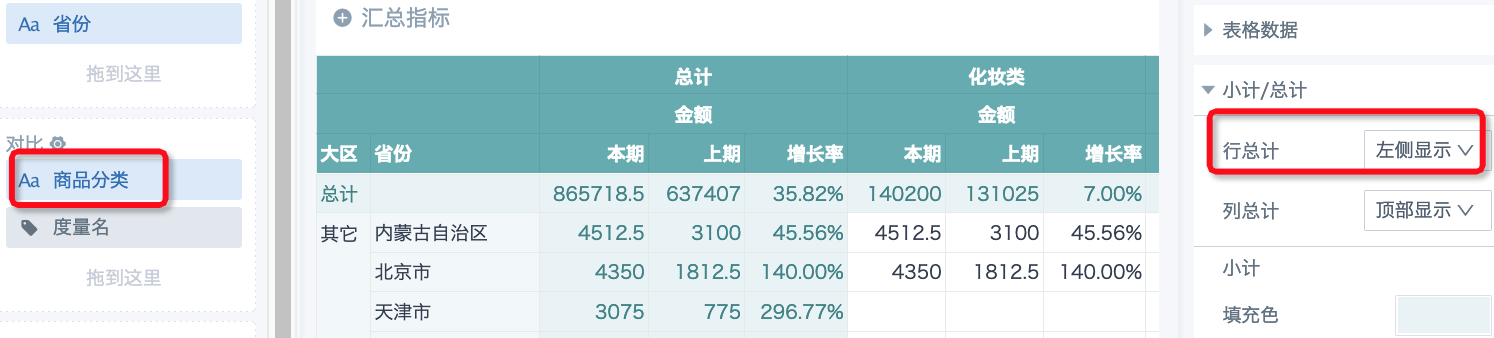
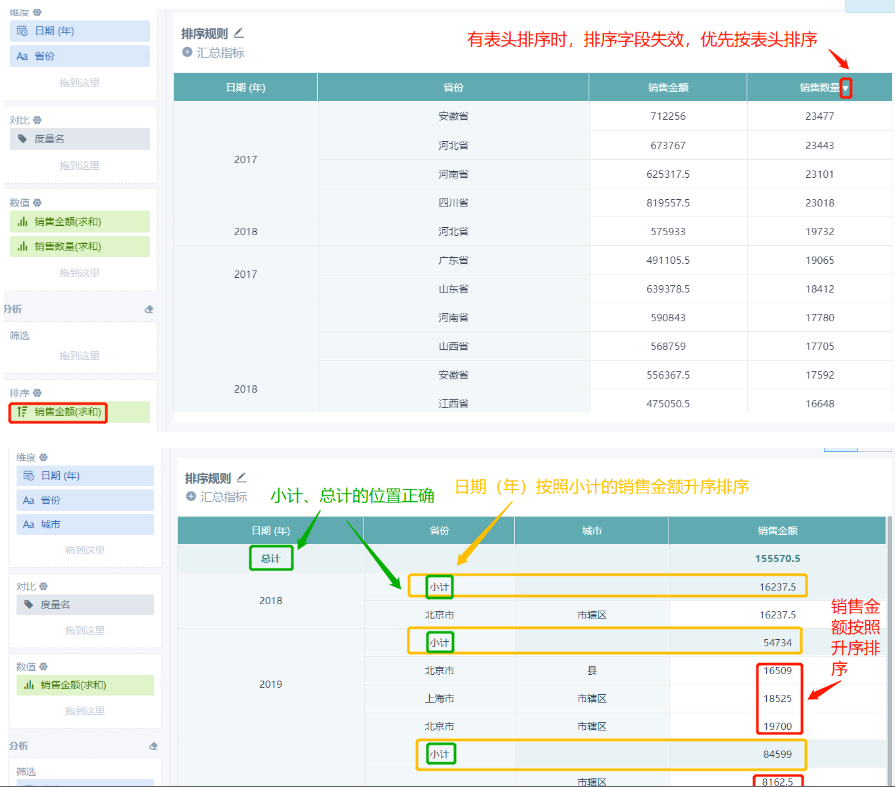
Table sorting does not take effect (sorting rules)
(1) Without subtotals/totals
- For the same field, if both header sorting and Sorting are configured, header sorting takes priority.
- When there are comparison items and no header sorting, numeric field sorting is split into multiple numeric items. Therefore, numeric sorting is not processed, and only dimension sorting is supported.
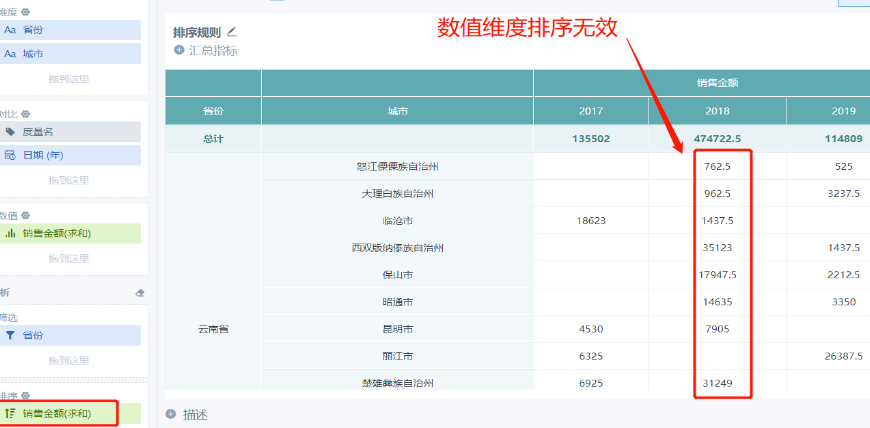
(2) With subtotals/totals
- First ensure the position of totals/subtotals.
- For the same field, if both header sorting and Sorting are configured, header sorting takes priority.
- When there are comparison items and no header sorting, numeric field sorting is split into multiple numeric items. Therefore, numeric sorting is not processed, and only dimension sorting is supported.
Error occurs during card drill-down
The drill-down card must contain a field of the same dimension as the clicked drill-down field. If the drill-down field is a newly created field in the card, or the drill-down card uses a different dataset, drill-down cannot be performed.
Solution: Ensure that the dimension field displayed by the first-level card exists in the second-level drill-down card with the same name and type.
What are the column count limits for tables?
Table Type | Dimension | Value | Compare | Filter | Sort |
Normal Table | Dimension + Compare fields <= 32 (subtotals/totals are not displayed when Dimension + Compare fields > 31) | 124 | Dimension + Compare fields <= 32 (subtotals/totals are not displayed when Dimension + Compare fields > 31) | 20 | 20 |
Grouped Table | 64 | Unlimited | \ | 20 | 20 |
Detail Table | Unlimited | \ | \ | 20 | 20 |
Carousel List | Aggregate primary key + fields <= 50 | \ | 20 | 20 | |
Heat Map | 1 | 1 | 1 | 20 | 20 |
If previewing or exporting a card reports Cannot cast [Ljava.lang.Object; to org.apache.spark.sql.Column, it is because the backend needs to concatenate SQL, perform aggregation, and may exceed length limits during processing. Reduce the number of fields to resolve it.
Value count limit for Compare fields in table - heat map
The number of values in a Compare field is limited to 100.
A table on the page cannot be dragged horizontally, and the horizontal scrollbar does not work
Too many default fixed header columns are configured, exceeding one screen. Reduce the number of fields under Dimensions, that is, the number of fixed header columns.
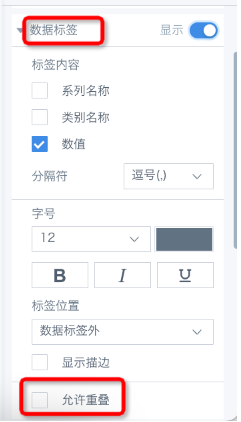
Data labels on a card are incomplete
Select Allow Overlap in data label settings to show all data labels.
Adding spaces before text field content to implement hierarchical indentation for dimension fields does not take effect
The Guandata BI frontend, including page cards and dataset preview, removes leading half-width spaces by default. To implement indentation, add full-width spaces before the field and set the field to left alignment.
What do conversion rate and arrival rate mean in a funnel chart?
In a funnel chart, conversion rate is current stage users / previous stage users, and arrival rate is current stage users / first stage users.
The card editing page remains loading after modification
After card editing, the page automatically previews by default. If it remains loading, the preview task is usually still running. If it takes too long, see What to Do When a Task Runs for a Long Time or Gets Stuck.
Card editing prompts: Current card data exceeds the upper limit, only the first 20,000 rows are displayed
Cause analysis: For performance reasons, when the data volume is too large and exceeds 20,000 rows, data display is limited to the first 20,000 rows. The 20,000 rows here correspond to the first 20,000 rows in Excel export.
Solution: 1. Configure filter conditions to keep the data volume within 20,000 rows. 2. Optimize the card structure and control the number of comparison items and comparison values.
Note: Other chart types also have row count limits. The order follows the first N rows after Excel export.
A date field exists, but YoY/period-over-period calculation cannot be selected
Advanced Calculation - YoY/Period-over-period supports only date formats (date and timestamp). If the date field is string type, convert the field type first. For non-direct-connection datasets, use the to_date() function.
What is the upper limit for batch paste search in a filter?
The current setting is 1000.
Why does today's date obtained by a function in a card not update in real time?
Cause: All data updates in a card depend on dataset updates. If the dataset is not updated that day, dates and times obtained with functions such as current_date(), now(), and today() are not automatically updated and show the cache from the most recent dataset update.
Solution: Configure the dataset to update at least once per day.
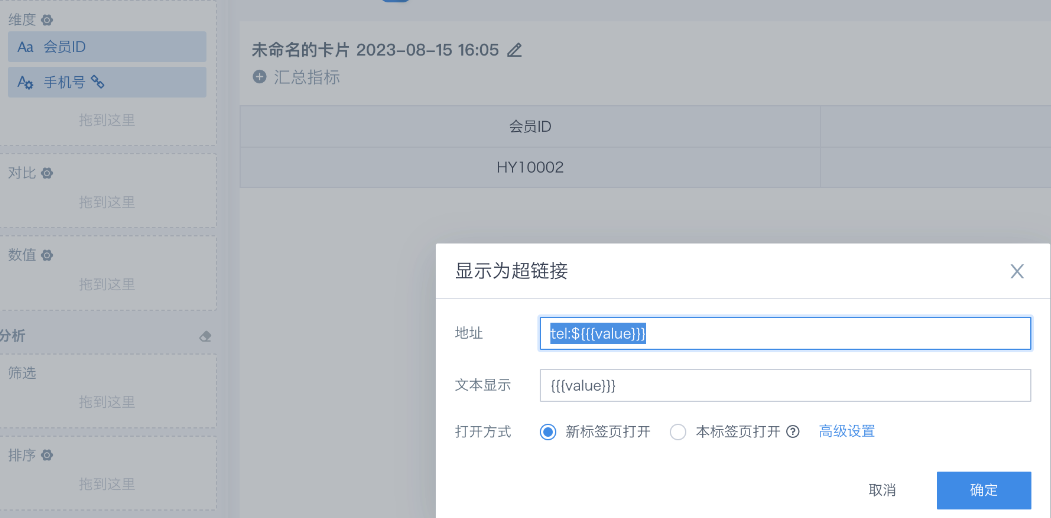
How can phone dialing be implemented in a table?
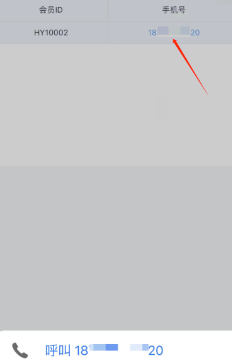
Requirement: Staff need to trigger phone dialing by clicking a mobile number in a card.
Solution: Put the [Mobile Number] text field in Dimensions, set Display As to Hyperlink, and set the address to tel:${{{value}}}, as shown below.
Ensure that the dataset associated with the table has strict data governance.
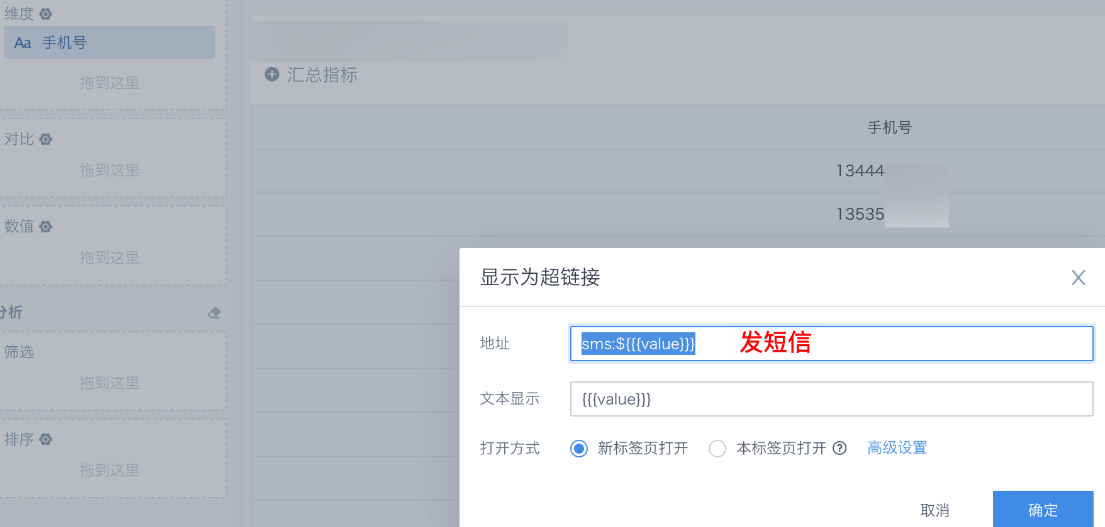
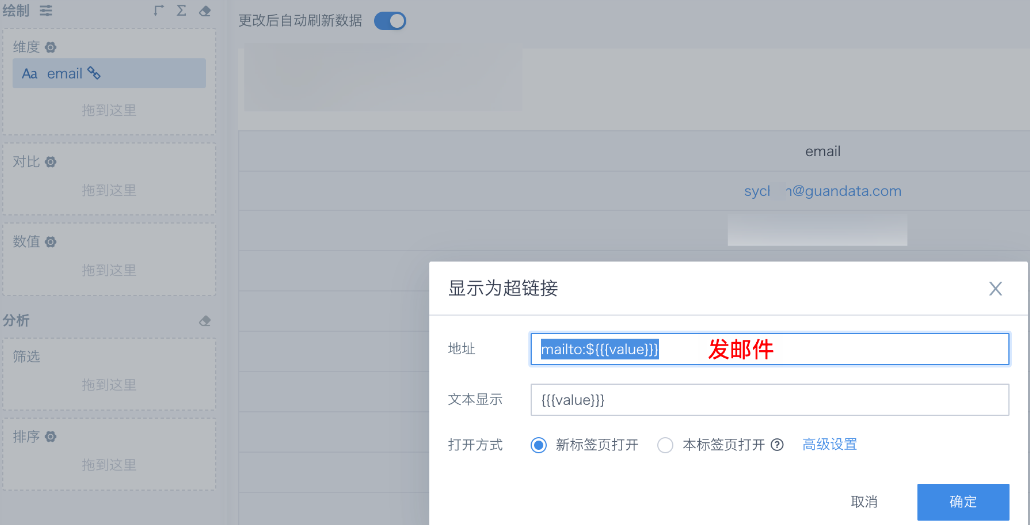
Additional scenarios:
Send an SMS by clicking a mobile number in the card: sms:${{{value}}}
Send an email by clicking an email address in the card: mailto:${{{value}}}
Why does setting a field containing an image URL to Display as Image not take effect?
Possible cause: Text fields containing URLs take effect only when placed in Dimensions or Compare. They do not take effect when placed in Values.
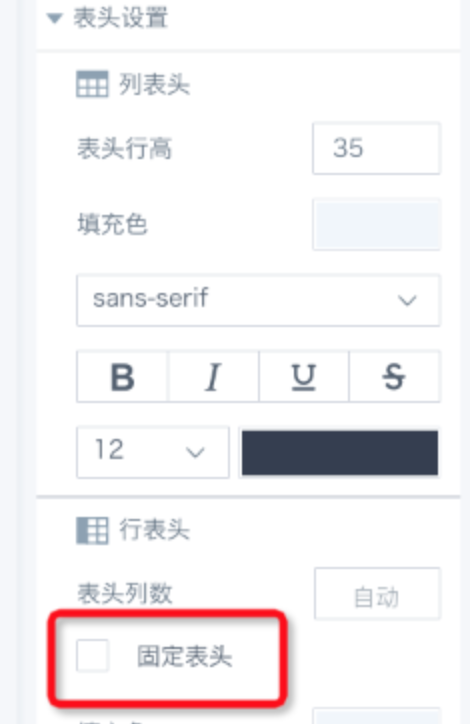
A table has a fixed header configured. Why are only some columns fixed?
Cause: The maximum locked area of a table is 60% of the table area. Columns beyond this range are not locked. In this case, the manually configured fixed column count does not take effect and is handled automatically.
Solution: Adjust header field column widths so the part to be fixed is less than 60% of the card size.
Conditional formatting is set for an aggregate measure and compared with the current column average. Why does it not take effect?
Cause: The average in conditional formatting comparison is calculated based on aggregated data and is actually correct. It seems ineffective because totals/subtotals use the average calculated from raw data.