Create a Historical Zipper Table with Window Functions
Background
The previous article, Create a Historical Zipper Table with Time-Series UDFs, introduced how to create a historical zipper table with Guandata custom time-series functions. However, the time-series custom function logic is complex and may be inconvenient for users. This document introduces how to create a historical zipper table in ETL with Spark window functions.
Link to Create a Historical Zipper Table with Time-Series UDFs:
Click the link to view: https://docs.guandata.com/?g=Doc&m=Article&a=index&id=1&aid=428145563741978624
The comparison of the two zipper table creation methods is as follows. Choose the appropriate method based on the actual scenario:
| Zipper Table Creation Method | Applicable Scenario | Notes |
|---|---|---|
| Time-series UDF function | Suitable for massive data, hundreds of millions of rows, and can reduce data volume to the greatest extent. | Requires users to have SQL skills. |
| Spark window function | Suitable for small data volumes and easier to get started. | Limited data volume reduction. Window functions consume more resources, and efficiency decreases as data volume grows. |
For Spark window functions, see Spark Window Functions and Applications.
Implementation Steps
Data Preparation
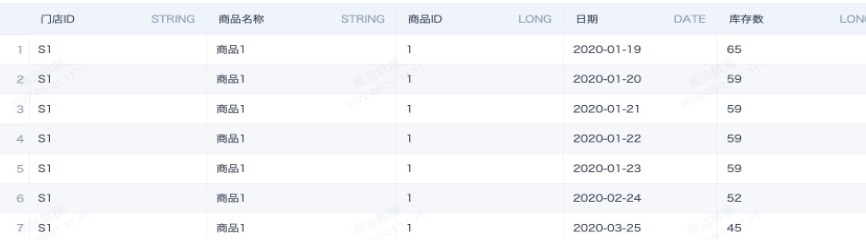
Import the prepared inventory snapshot table, see Create Data Snapshots with ETL, or transaction detail table into the Guandata data platform. Create a Smart ETL and first aggregate the data to the required granularity. Here, we prepare a daily summary table by store and product. In the example below, both consecutive dates and skipped dates exist. The actual inventory quantity on missing dates is equivalent to the inventory quantity on the nearest historical date.
ETL Data Processing
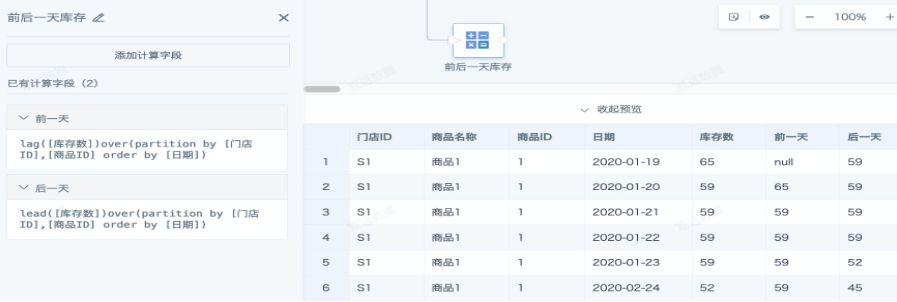
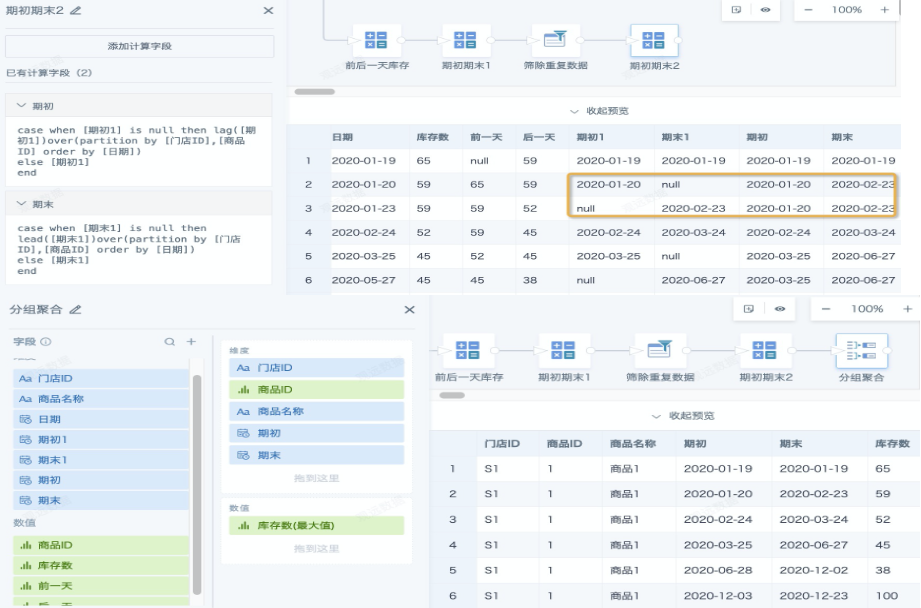
- Add a calculated column and calculated fields. Use the lead/lag window functions to calculate the inventory quantity of the previous day and the next day for each product in each store.
lead([Inventory Quantity]) over(partition by [Store ID], [Product ID] order by [Date])
lag([Inventory Quantity]) over(partition by [Store ID], [Product ID] order by [Date])
-- Group by [Store ID] and [Product ID], sort [Date] in ascending order, and obtain the previous and next row of data.
- Add a calculated column and calculated fields Start 1 and End 1. Compare the previous day's and next day's inventory quantities to preliminarily determine the start date and end date for each inventory quantity. For an unfinished date interval, the end date can be set to today or a fixed date, such as year end, as needed.
In the example below, inventory does not change from 2020-01-20 to 2020-01-23, so 2020-01-21 and 2020-01-22 are neither start nor end dates. The end date is the day before the inventory quantity changes. Then use a Filter Rows node to remove duplicate inventory data that is neither a start nor an end.
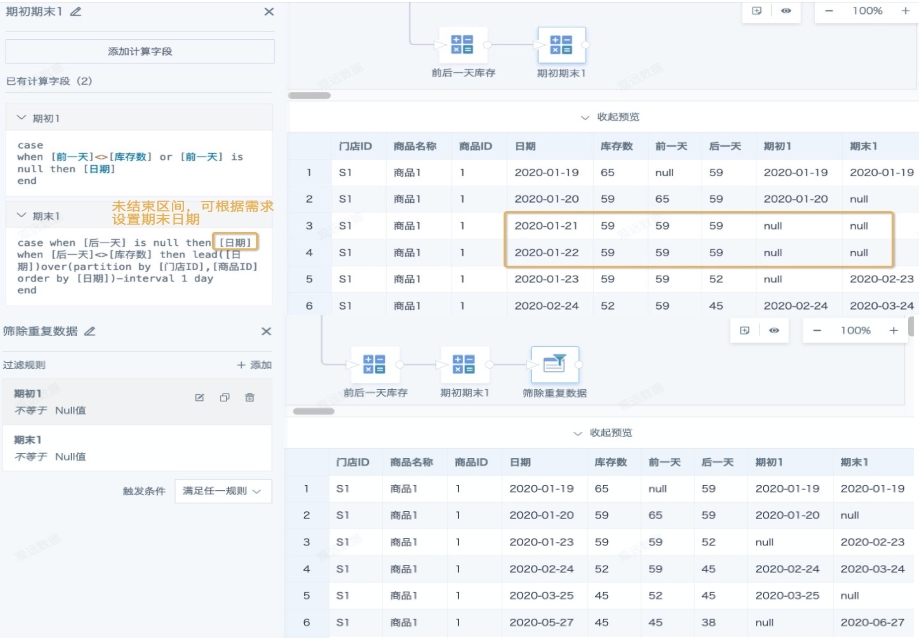
- After duplicate data is filtered out in the previous step, dates become non-consecutive. However, the start and end dates within the same date interval are still split into two rows and need to be merged into one row. Add an Add Calculated Column node and a Group Aggregation node in sequence to fill and deduplicate null values in Start 1 and End 1. The data volume is further reduced. Add an output node, save, and run. The zipper table is complete.
Note: The method above is not the only solution. You can explore more solutions with window functions. For example, inventory snapshot tables, or any scenario with consecutive dates, can also use the lasting_days_to_date function to create zipper tables.
See https://docs.guandata.com/?g=Doc&m=Article&a=index&id=1&aid=428149303114989568.
Dashboard Display
Scenario 1: Direct Query
Create a card on the page and create a Boolean calculated field Date Filter. Reference a time-type global parameter and drag the field into the filter area, with true selected by default. Then create a date filter on the page and link it to the global parameter used in the card.
[DYNAMIC_PARAMS.Selected Date] between [Start] and [End]
[DYNAMIC_PARAMS.Selected Date] >= [Start] and [DYNAMIC_PARAMS.Selected Date] <= [End]

Final page effect:

Scenario 2: YoY/MoM Calculation
Because a zipper table is based on fuzzy query over date intervals, the system's built-in YoY/MoM calculation cannot be used in the card. Global parameters must be used to directly calculate and display YoY/MoM data. The following case shows monthly YoY data.
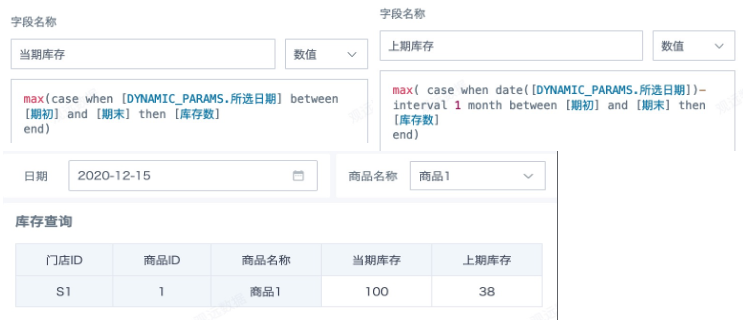
Create the following two calculated fields and drag them into the value area. No date filtering is needed. Then create a date filter on the page and link it to the global parameter used in the card.