Fill Data with ETL
Background
Year-over-year and month-over-month calculations are based on comparing data from the same period using the current period's dimension fields. If the dimension fields are inconsistent between the current and comparison periods, the calculation results for each row may be correct, but the total may be incorrect.
For example, if there are 10 SKUs this year and 12 last year, only the 10 SKUs from this year can be compared, and the missing SKUs will be omitted. To compare all SKUs, you need to fill in the data in ETL in advance to ensure that each SKU has data for every date range.
Note: Data filling will cause data expansion. Please estimate the data volume and use it as needed.
Implementation Method
The sample dataset contains 3 years of sales data, with the original granularity at the "day" level. To calculate month-over-month and year-over-year at the "month" level, you need to fill in the data so that each product category has sales data for every month.
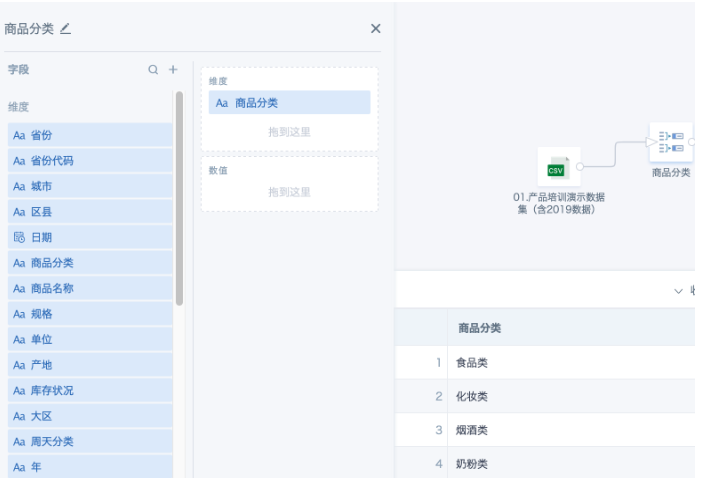
- First branch: After importing the dataset, add a "Group Aggregation" node, drag the "Product Category" field into the dimension bar, and get a deduplicated list of all product categories in the dataset.
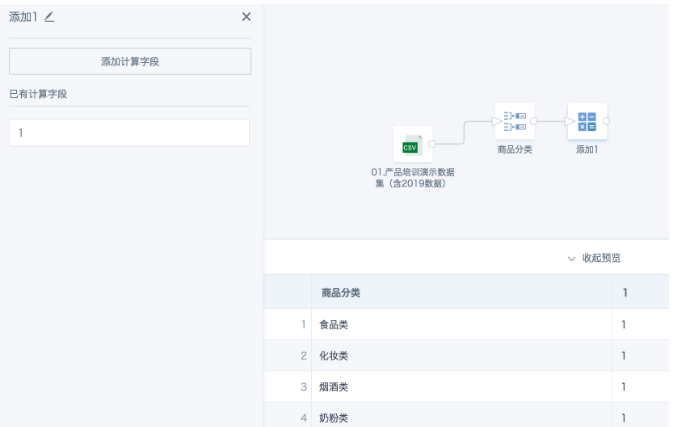
- Add a "Calculated Column" node and add a constant field, e.g., [1].
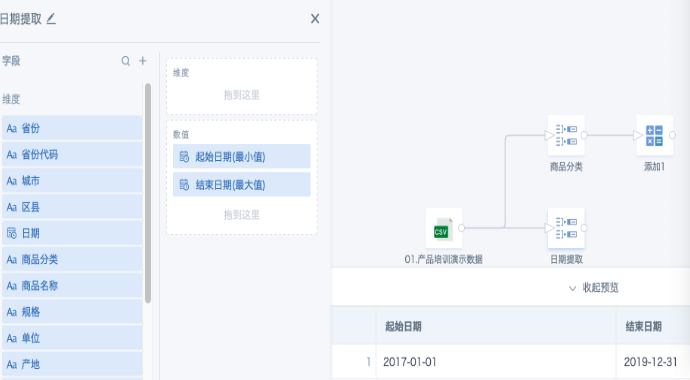
- Second branch: After importing the dataset, add a "Group Aggregation" node, drag the date field into the value bar twice, set one to "min" and the other to "max". The system will prompt for duplicate field names, so set aliases. If you want to use a specified range instead of extracting from the dataset, use a "Calculated Column" node to add two date-type constant fields as the start and end dates.
-
Add a "Calculated Column" node.
-
Add a constant field, e.g., [1].
-
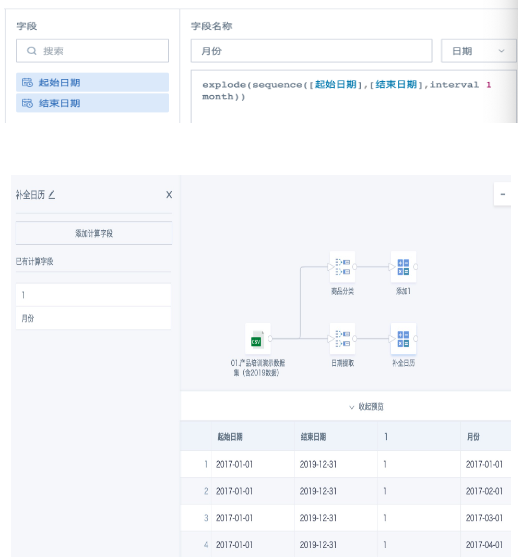
Add another field using the function explode(sequence([Start Date],[End Date],interval 1 month)) to fill in the calendar, getting the first day of each month in the range. You can change interval 1 month to 1 week/day as needed.
-
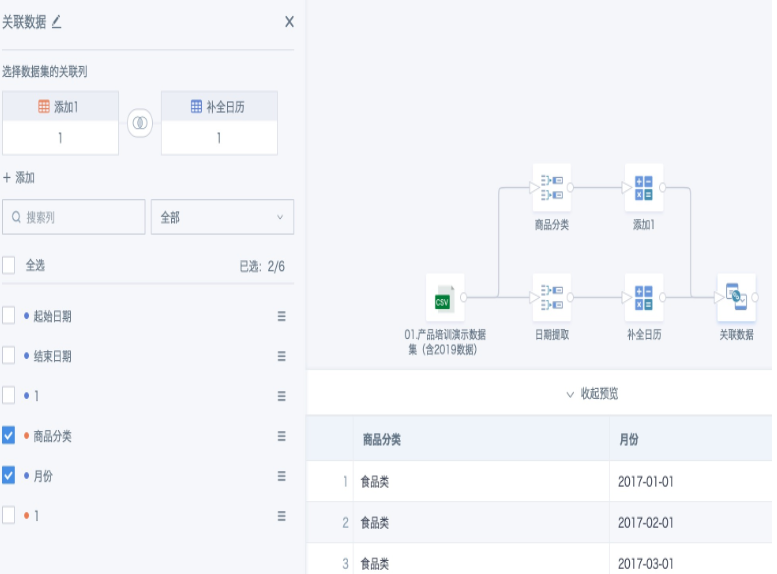
- Add a "Join Data" node, join the two temporary datasets from steps 2 and 4 using the constant field 1. Any join type is fine (since the month and product category fields are already deduplicated). Select the fields "Product Category" and "Month" to get the complete list after filling.
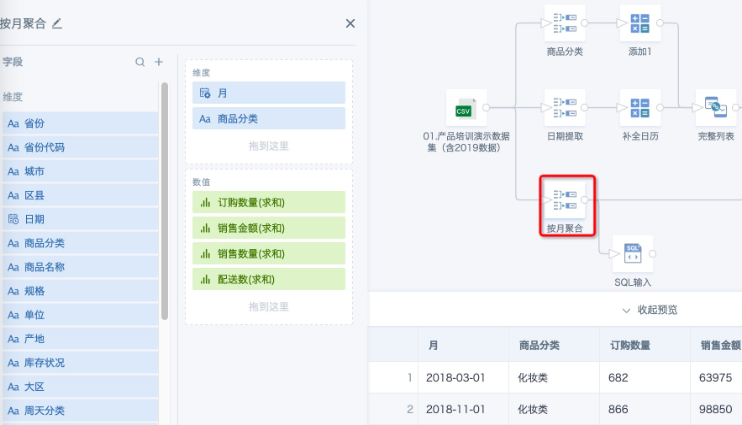
- Third branch: Use "Group Aggregation" on the original input dataset to aggregate data to the "Product Category" and "Month" level.
Note: The dimension fields must be consistent with the previous two branches. If you need to add other fields that affect the number of rows, those fields must also be handled in separate branches and joined for data filling as above.
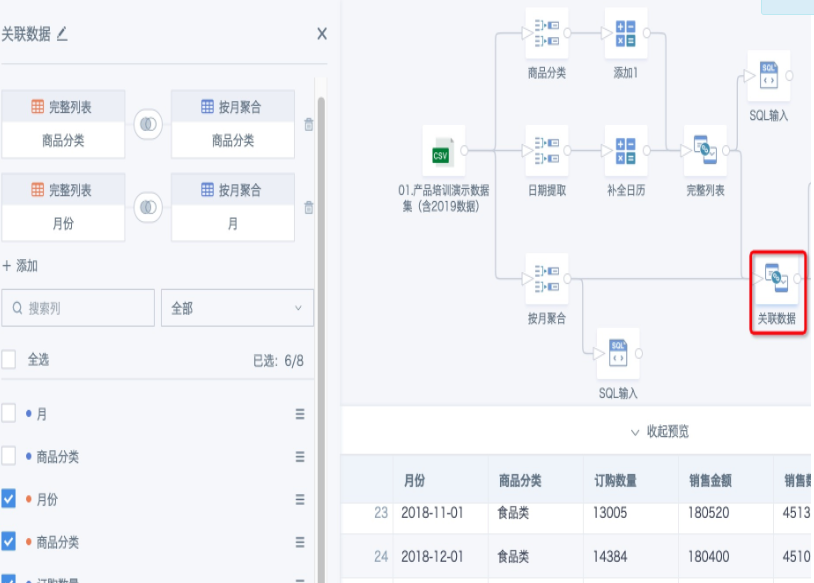
- Add a "Join Data" node, use the complete list from step 5 as the base table, and left join the table from step 6 using the fields "Product Category" and "Month". When selecting fields to keep, select the base table's fields for "Product Category" and "Month".
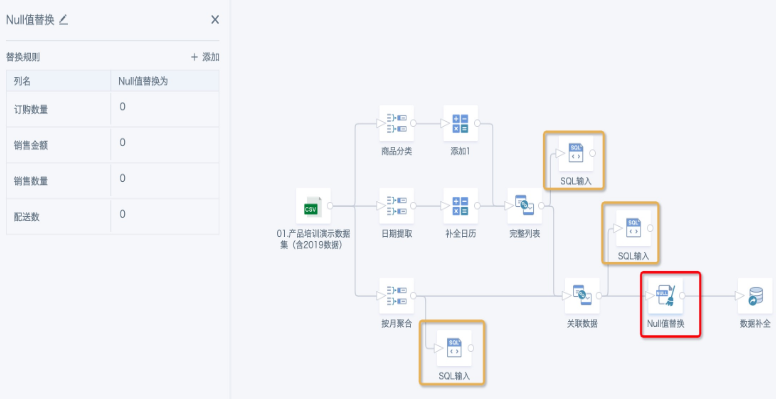
- Add a "Null Value Replacement" node, replace all null values in numeric fields with 0. Data filling will generate many nulls, which need to be replaced with 0 for subsequent calculations. Add other nodes as needed until ETL is complete and saved.
Notes
-
It is recommended to use the Data Exploration node or SQL to check the data volume after joining, to determine if the data expansion is reasonable.
-
If the ETL node preview or run fails with the error "message":"java.util.NoSuchElementException: key not found: numPartitions", it means the data expansion is unreasonable and exceeds the system limit, causing forced termination. Check the data and modify the join method as needed.