Chinese-style Reporting Feature Overview
Overview
Chinese-style Reporting, also known as GuanReport, is an extended chart type embedded in the Guandata BI all-in-one intelligent data analytics platform. Its design goal is to deeply combine Excel-style report building with Guandata BI capabilities.
To preserve users' existing habits of building complex reports in Excel, GuanReport provides two editing modes. Online editing mode integrates an online Excel-like editor, supports field drag-and-drop, and provides configurable formulas. Local upload mode reuses existing Excel capabilities, especially native Excel editing operations, so users can design report templates quickly in Excel. Both modes move the local Excel report viewing experience to the web and can restore Excel styles accurately. GuanReport is also deeply integrated with Guandata BI, including data access and refresh, filter and linkage analysis, row and column permissions, download, distribution, and subscription capabilities.
Feature Advantages
- Intelligent data preparation: With Smart ETL in Guandata BI, GuanReport can quickly connect to and process the data sources required for complex enterprise reports, improving data preparation efficiency and reducing the report development threshold.
- Secure permission control: Enterprises can use existing BI data permission capabilities to manage report data sources securely and reduce risk.
- Complex report layouts: GuanReport is compatible with Excel-style static text headers, merged cells, indented headers, diagonal headers, and horizontal or vertical expansion driven by dimension and metric fields.
- Complex calculation and analysis: It supports value lookup formulas, inter-cell calculation, parameterized queries, and linkage or filtering with other BI charts.
- Excel compatibility: Users can design complex report templates based on Excel and reuse many native Excel capabilities.
- Sharing and collaboration: Template download, card export, and subscription are supported, making it easier for multiple users to share the same report.
In summary, GuanReport helps business users prepare report data quickly, design flexible Excel-compatible layouts, perform interactive analysis, and share reports efficiently. It shortens the process from retrieving data to viewing and using data, while also meeting enterprise requirements for data security. It is suitable for Chinese-style complex reports with complex data sources, layouts, calculations, and integrations, such as sales analysis, profit analysis, supply chain reports, financial reports, and operations reports.
This module is a value-added module. To try it, contact Guandata sales or your customer success manager.
Application Scenarios
Supply Chain Data Analysis
Supply chain analysis usually includes logistics, procurement, production, inventory, delivery, transportation network, and supply chain node analysis. GuanReport can meet the needs of users at different levels and produce visually polished supply chain analysis reports.
.jpeg)
Sales Analysis
Sales targets are usually decomposed level by level across an organization. Managers need to monitor overall target achievement, while frontline sales users need to track their own progress. Sales reports often serve frontline sales, sales supervisors, sales management, executives, and functional teams that monitor product, brand, or SKU performance. Because these reports are often complex, GuanReport helps different user groups build clear visual sales analysis reports.
.jpeg)
Profit Analysis
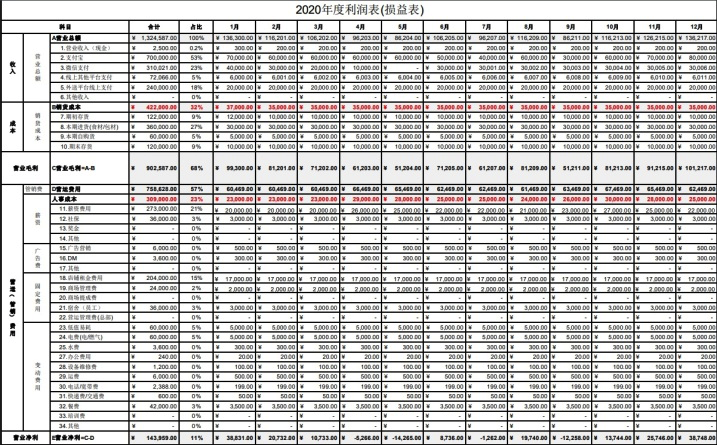
Profit analysis, also known as income statement analysis, uses the income statement as the primary object of financial analysis. To analyze profitability and operating results, users must obtain financial data from the income statement. Even solvency analysis should consider profitability because solvency is closely related to profit generation. Profit analysis is closely tied to revenue, cost, and expense data and is usually complex. GuanReport supports polished profit analysis reports for users at different levels.
Financial Analysis
Financial analysis uses accounting records, reports, and other related materials to evaluate profitability, operating capability, solvency, and growth across financing, investment, operating, and distribution activities. It often combines single-metric and multi-metric analysis with reference values such as budgets and targets, and uses ratio, trend, structure, and factor analysis. The results are then presented through intuitive reports or visual narratives. Financial analysis reports are often complex and follow common analysis models, and GuanReport can create clear visual financial analysis reports.
.png)
Operations Reports
Operations reports usually reflect whether a company realized profit or incurred loss during a period. They are dynamic reports that help readers make business decisions, analyze the reasons for profit changes, understand operating costs, and evaluate investment value. Because operations reports often involve complex layouts and common analysis models, GuanReport can produce dynamic and visually polished operations reports.
.png)