Cloud Market (Application Market)
1. Application Market Overview
The Guandata Application Market is a website based on enterprise multi-business scenarios, focusing on data application downloads, installation, usage, and related services. Through applications such as plugins, templates, and AI assistants, it makes users' analysis and construction processes more convenient and efficient. It enables users with different roles within enterprises to quickly consume pre-built industry analysis and decision-making scenarios, accelerating business implementation and agile decision-making.It covers industry scenarios such as retail, consumer goods, e-commerce, and finance, supporting different business analysis themes for various core functional departments within enterprises, such as finance, supply chain, customer relationship, and human resources. We provide hundreds of analysis and decision-making scenarios, comprehensively empowering business lines, enabling users with different roles within enterprises to quickly consume pre-built industry analysis and decision-making scenarios, including intelligent insights for enterprise business analysis, one-click visual style changes, or teaching guide materials.
Overall, the current Guandata Application Market has launched various applications including visualization plugins, visual styles, large screen templates, and AI assistants. By standardizing and productizing services, encapsulating industry data analysis methodologies into individual data applications, enterprises at different growth stages can quickly download applications that match different business scenarios, enhancing end-to-end data analysis capabilities.
2. Application Market Value
| Advantage Value | Description |
|---|---|
| Rich Application Types, Simple Installation | The Application Market provides a vast number of applications, including scenario applications, AI assistants, plugins, data connectors, etc., with quick installation and convenient usage. |
| Internal and External Integration, One-stop Business Support | Accumulating years of industry experience and deep business understanding, achieving service productization; each application in the Application Market encapsulates full-process data analysis logic and models, achieving process automation. |
| Multi-scenario Themes, High Aesthetics and Creativity | The scenario applications in the Application Market provide rich application scenarios, including executive business overview scenarios, member growth insight scenarios, and promotional activity operation scenarios, with clean and beautiful pages. |
| Minimal Operations, Saving Manpower and Time | Professional team implementation and delivery, eliminating the need for IT personnel to perform data development, reducing project cycles by 65%, with automated one-click downloads. |
| Multi-source Data Integration, Seamless Data Asset Accumulation | Facilitating integration with various data sources, building data unification in advance; the Application Market provides comprehensive data models, beneficial for simplifying implementation processes. |
3. Application Market Usage Instructions
3.1 Application Market Access
3.1.1 BI Top Navigation Access
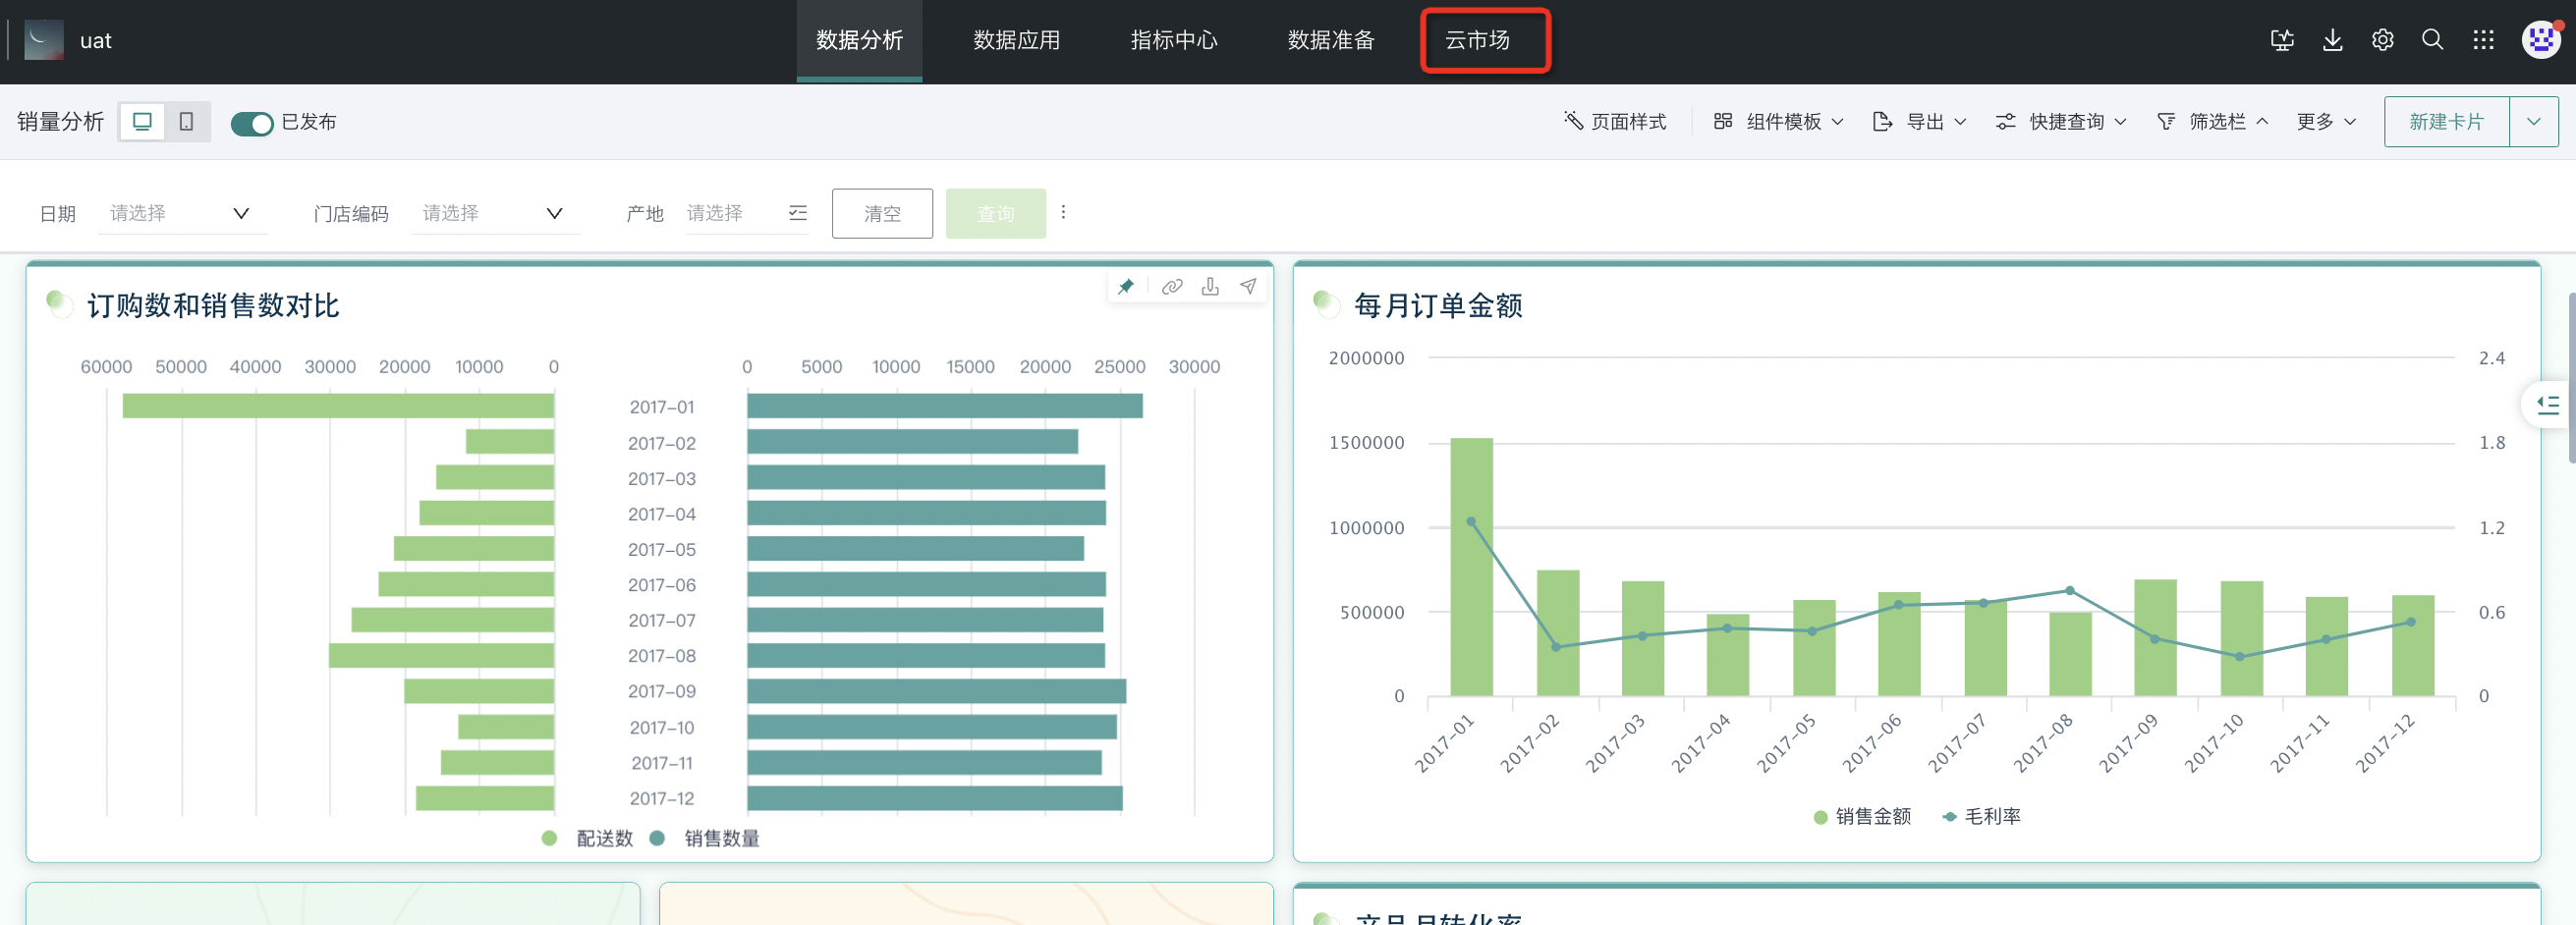
If you are already a Guandata user, you can access the Application Market (Cloud Market) from the top navigation of the platform interface.
Note: Accessing the Application Market (Cloud Market) within BI requires no additional registration and automatically binds enterprise information.
3.1.2 Guandata Official Website Access
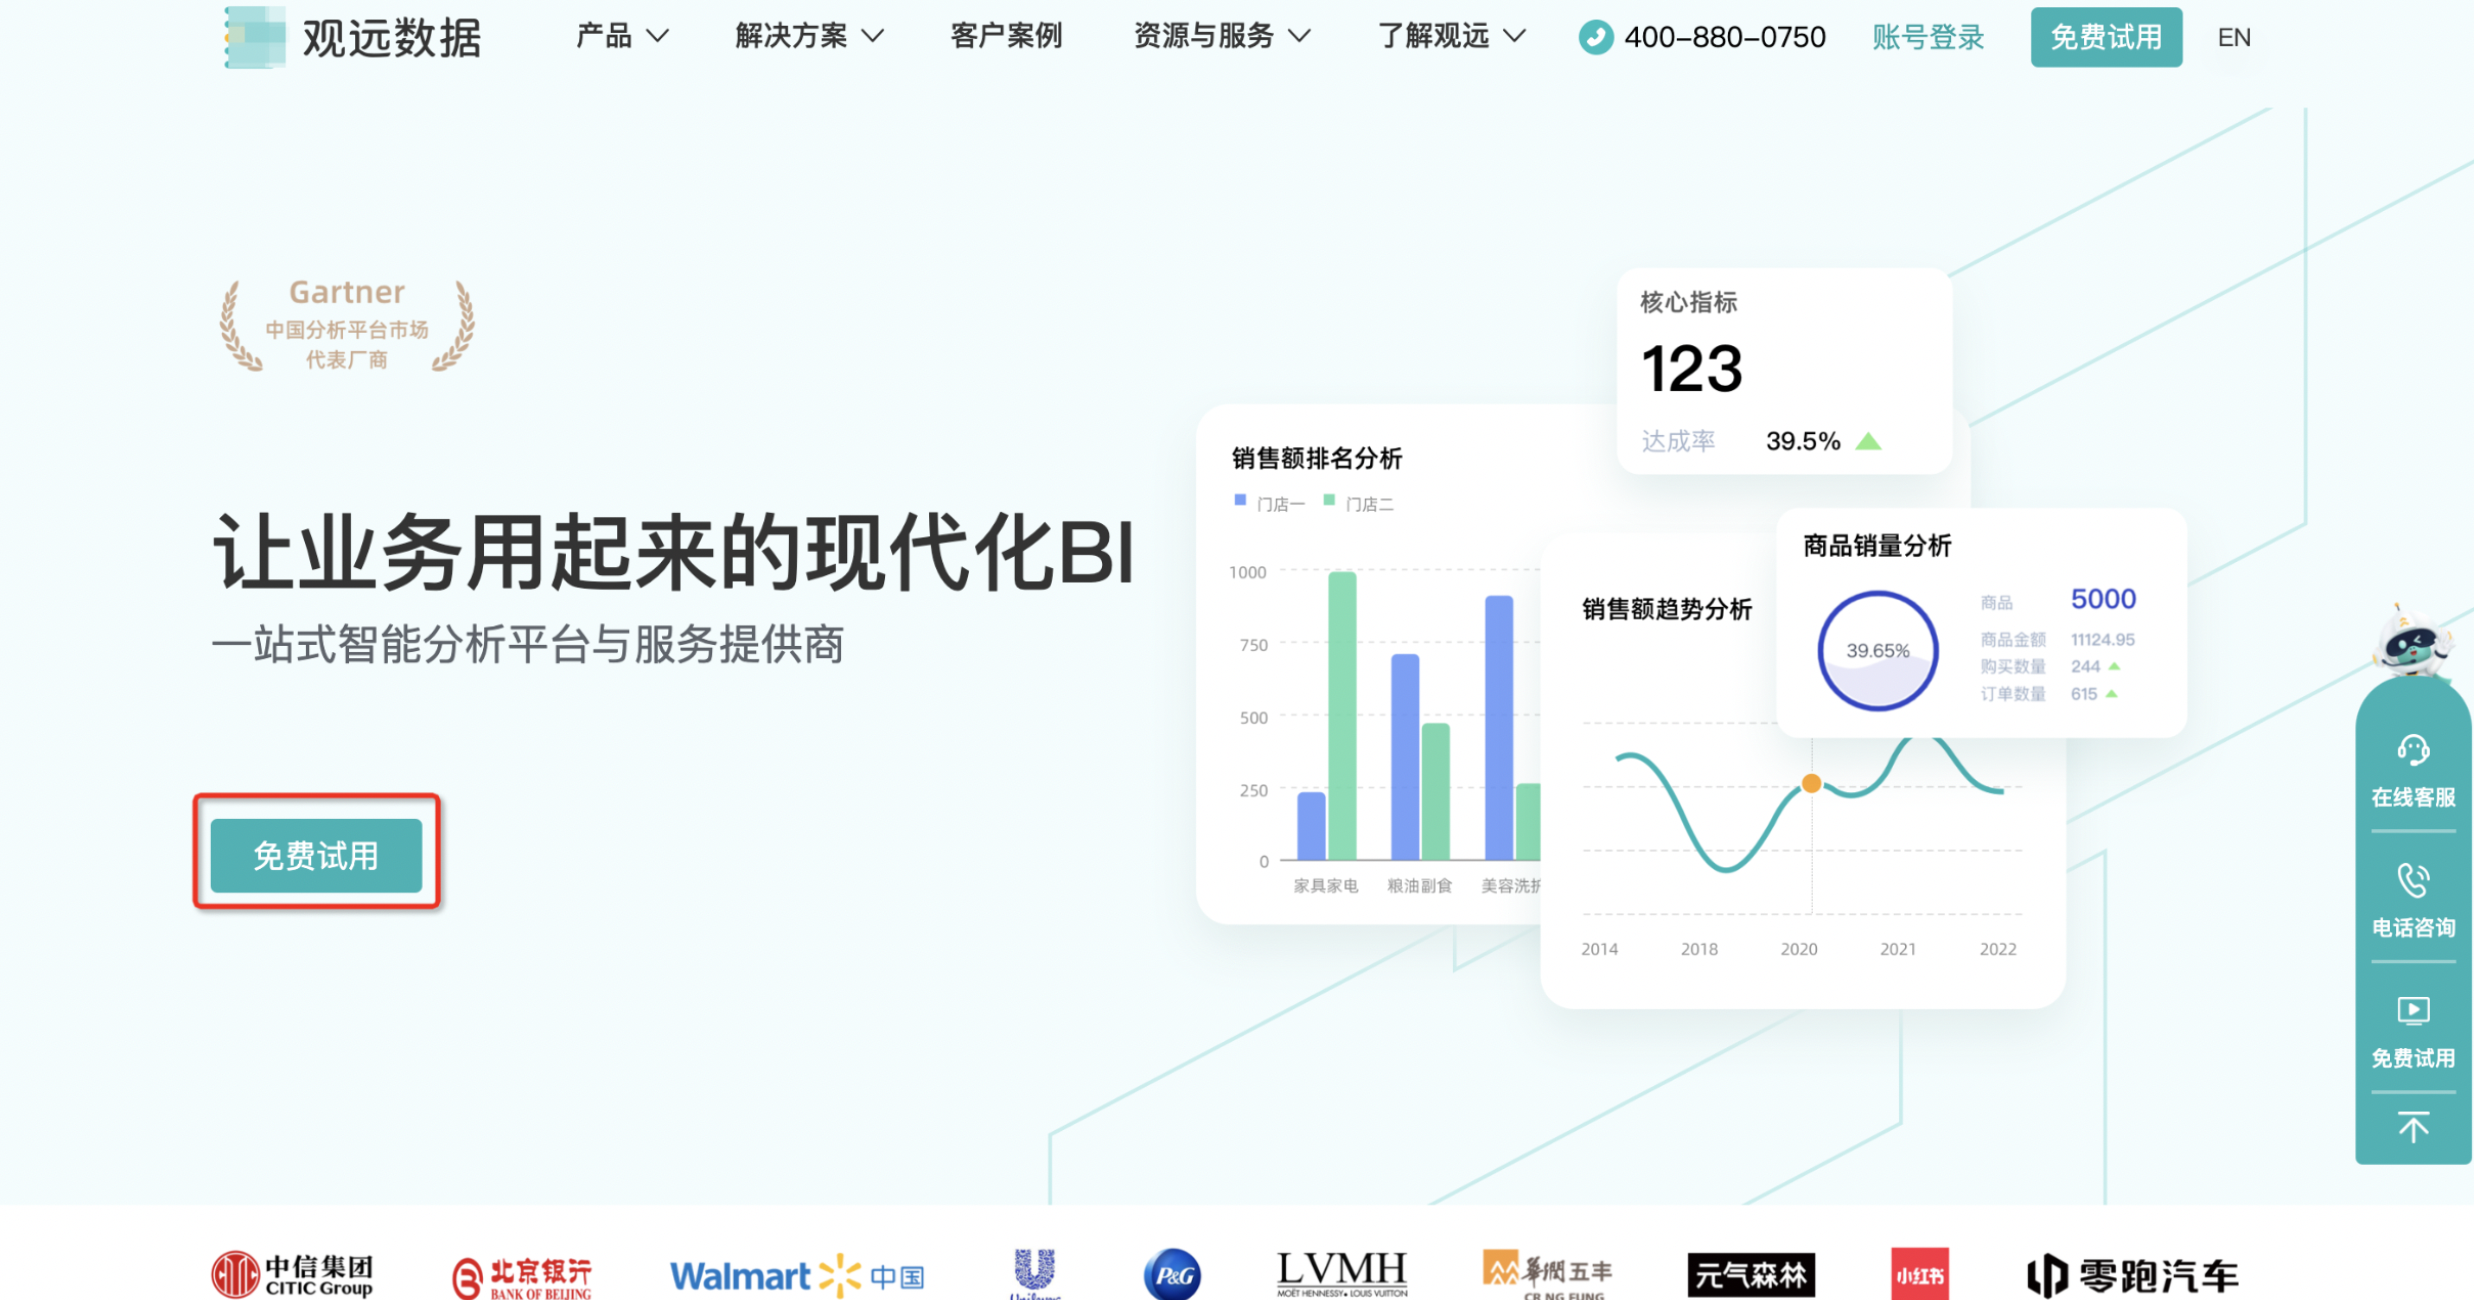
You can also access the Application Market through the Guandata official website, with the following access path:
Click "Free Trial", complete registration and login, then enter the Guandata BI Experience Center, and access the Application Market (Cloud Market) from the top navigation of the platform interface.
3.2 Application Market Registration
Registration method: Users register themselves, as shown in the figure below:
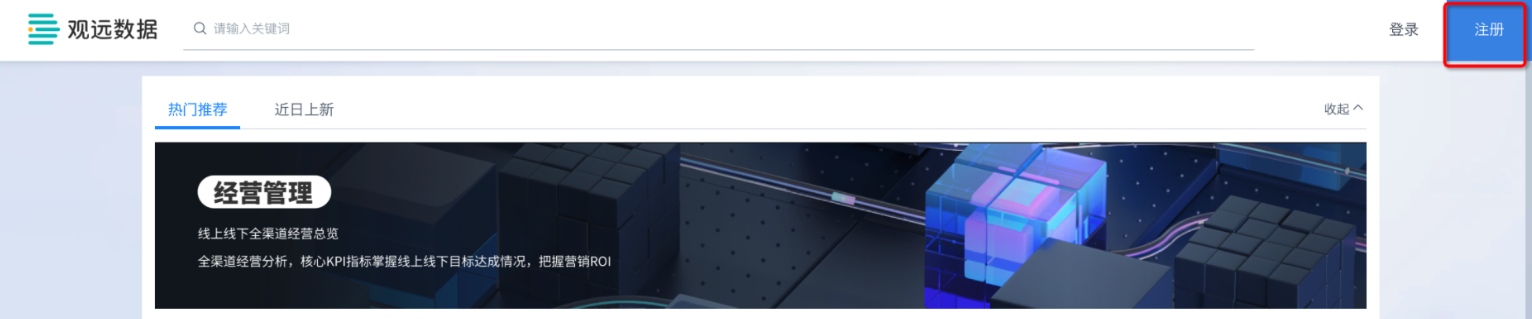
After clicking, enter the registration page:
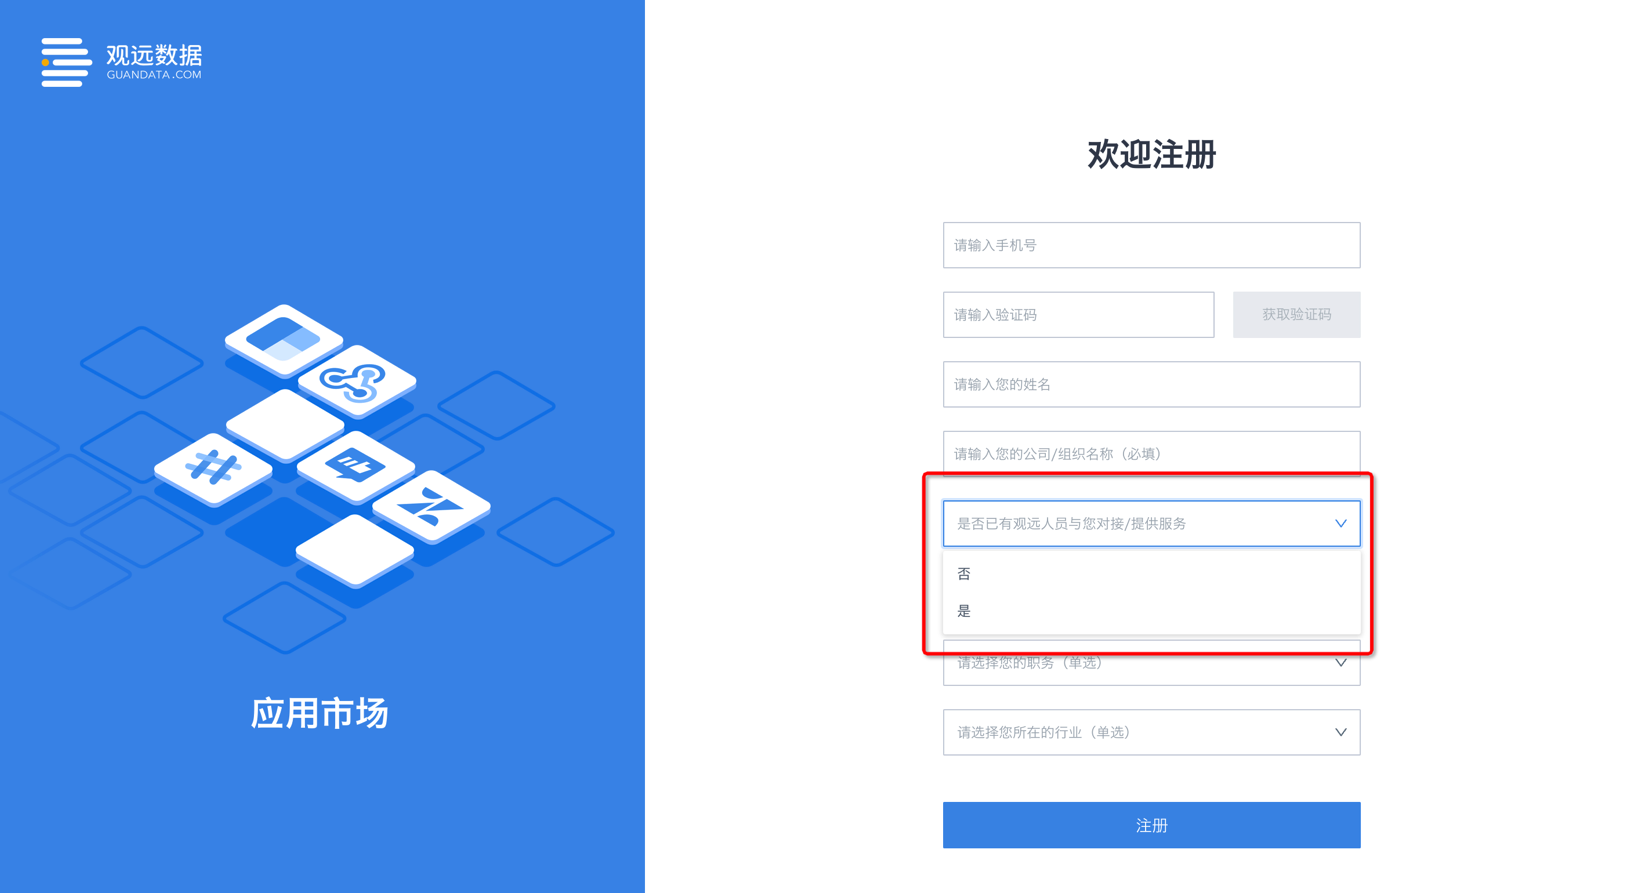
Note: On the registration page, please fill in the information according to the prompts. In the fifth selection box "Whether Guandata personnel have already contacted/provided services to you", if you select "No", for a better service experience, Guandata service personnel may contact you later to provide more services, please pay attention to answering calls. If you select "Yes", it is considered that you have already been in contact with Guandata, and no further contact will be made.
3.3 Application Type Selection
The Application Market provides rich application types, which can be divided into free applications and paid applications based on whether they are charged. Paid applications can be experienced online for free, but can only be installed after purchase. If interested, you can contact Guandata staff.
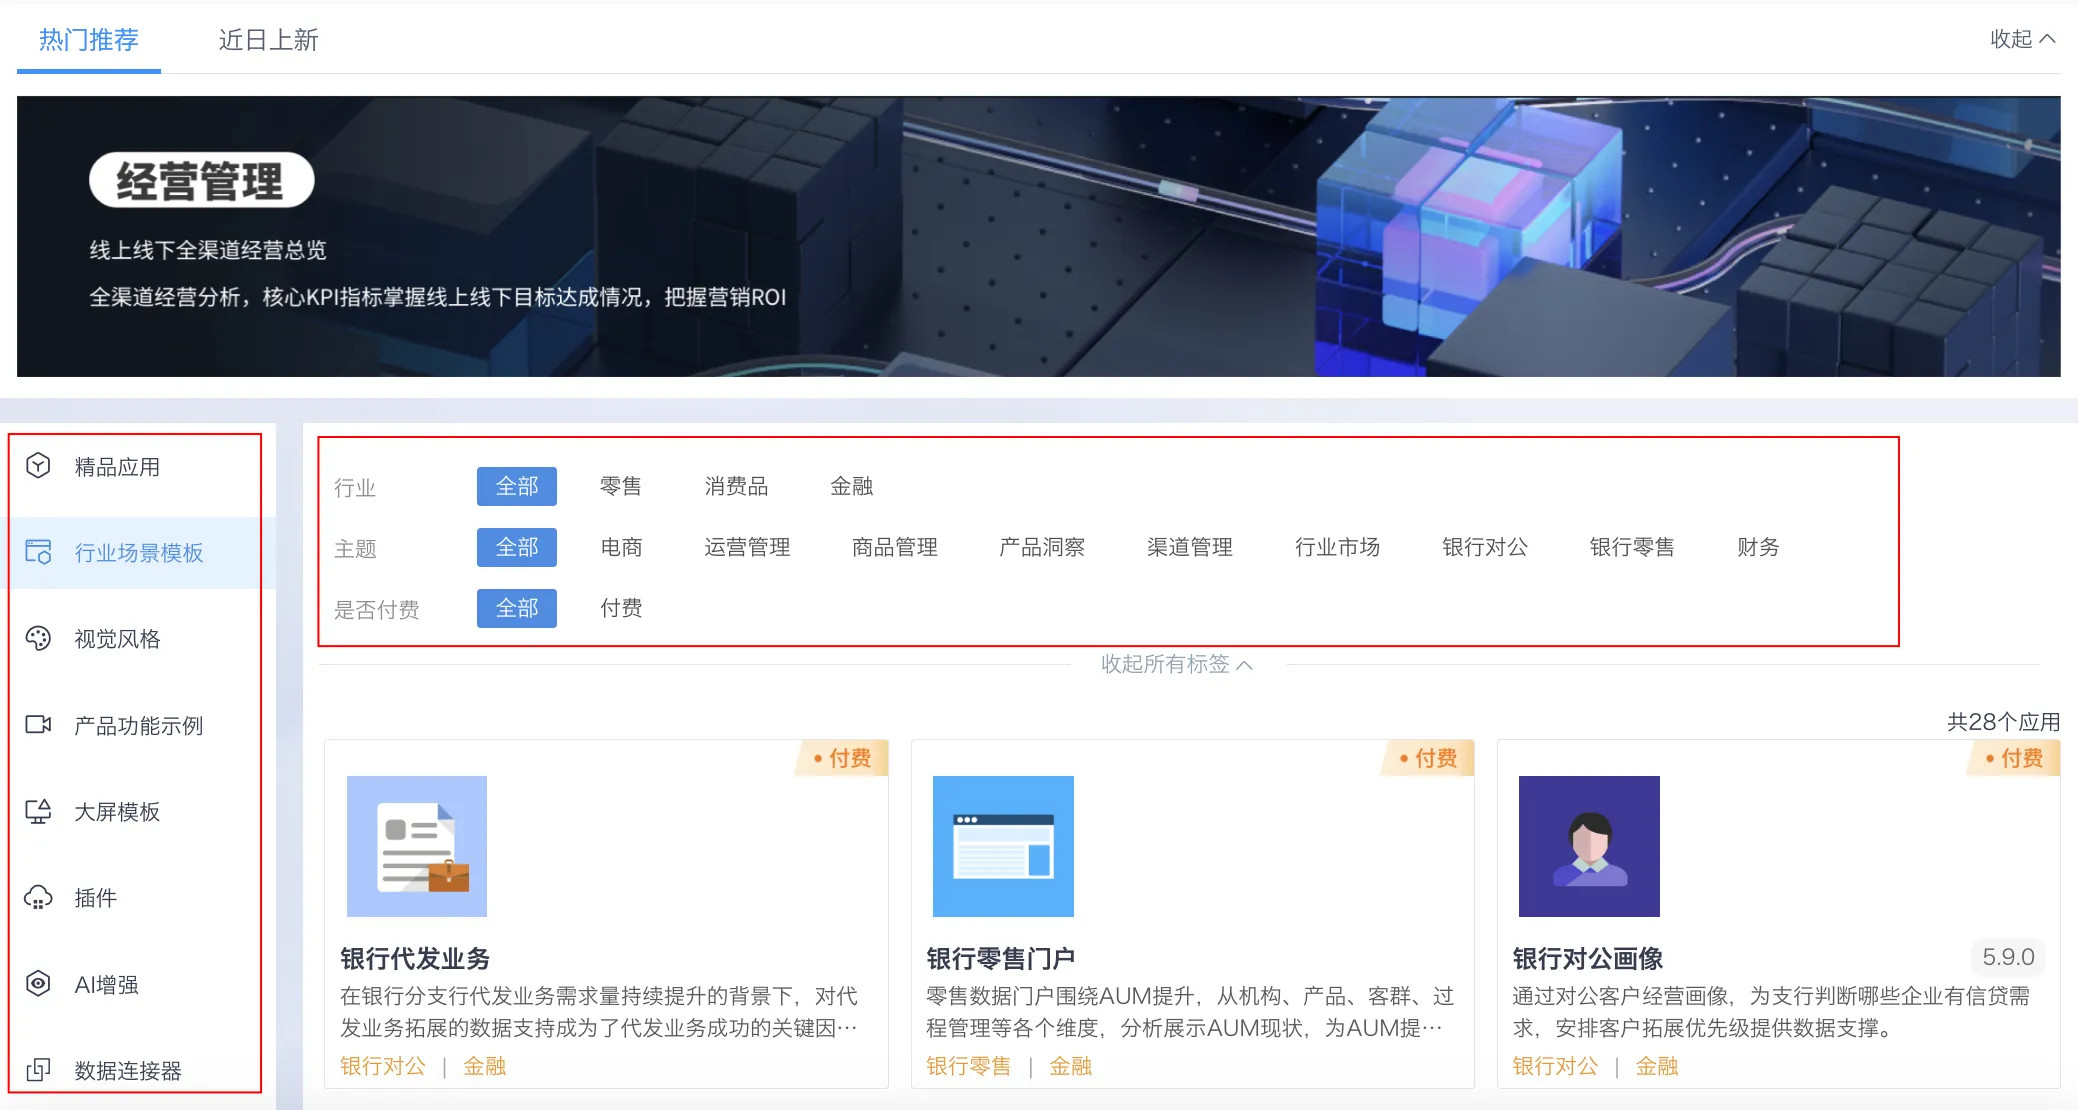
Based on different application forms, they are divided into premium applications, industry scenario templates, visual styles, product function examples, large screen templates, plugins, AI assistants, and data connectors. Application categories are displayed as navigation bars on the homepage. At the same time, each application category corresponds to different tag groups, and users can quickly filter and locate desired content through keywords.
3.3.1 Premium Applications
Premium applications focus on enterprise business management end-to-end needs, deeply covering multi-industry scenarios such as consumer goods and cross-border e-commerce, as well as core business themes such as executive management and market insights. Selected applications are refined through scenario-based development. For example, executive business analysis applications are based on industry benchmark cases, providing precise data insights for enterprise CXO-level decision-makers; market insight applications integrate online and offline omni-channel, helping brands accurately capture market dynamics. From a functional perspective, they integrate data analysis and intelligent decision-making capabilities, using low-threshold, high-adaptability digital tools to help enterprises efficiently penetrate business data and accelerate business strategy implementation. They are excellent choices for improving efficiency, reducing costs, and accumulating business value in the enterprise digital transformation process, providing suitable business management "digital engines" for enterprises at different development stages.
3.3.2 Industry Scenario Templates
In the process of enterprise digital operations, business analysis often requires certain data analysis logic and business professional knowledge. Currently, Guandata provides scenario applications that fit business digital chains for "multiple vertical industries" such as retail/food service/footwear and apparel/finance, and "multiple horizontal functions" such as finance/HR. These standard pre-built analysis templates under different industry themes and diverse scenarios are all derived from the business analysis practice ideas of leading enterprises in the industry (including professional data analysis logic and business professional knowledge, etc.), with comprehensive data indicator systems and solution blueprints. Users only need to replace data sources with one click to quickly implement industry best practices and obtain the best experience in data analysis and decision-making.These scenario application packages can help companies quickly replicate and implement these best practices within their companies, accelerating the business analysis process. This includes but is not limited to business management, channel management, retail portals, financial analysis, bank payroll services, and human resource management.
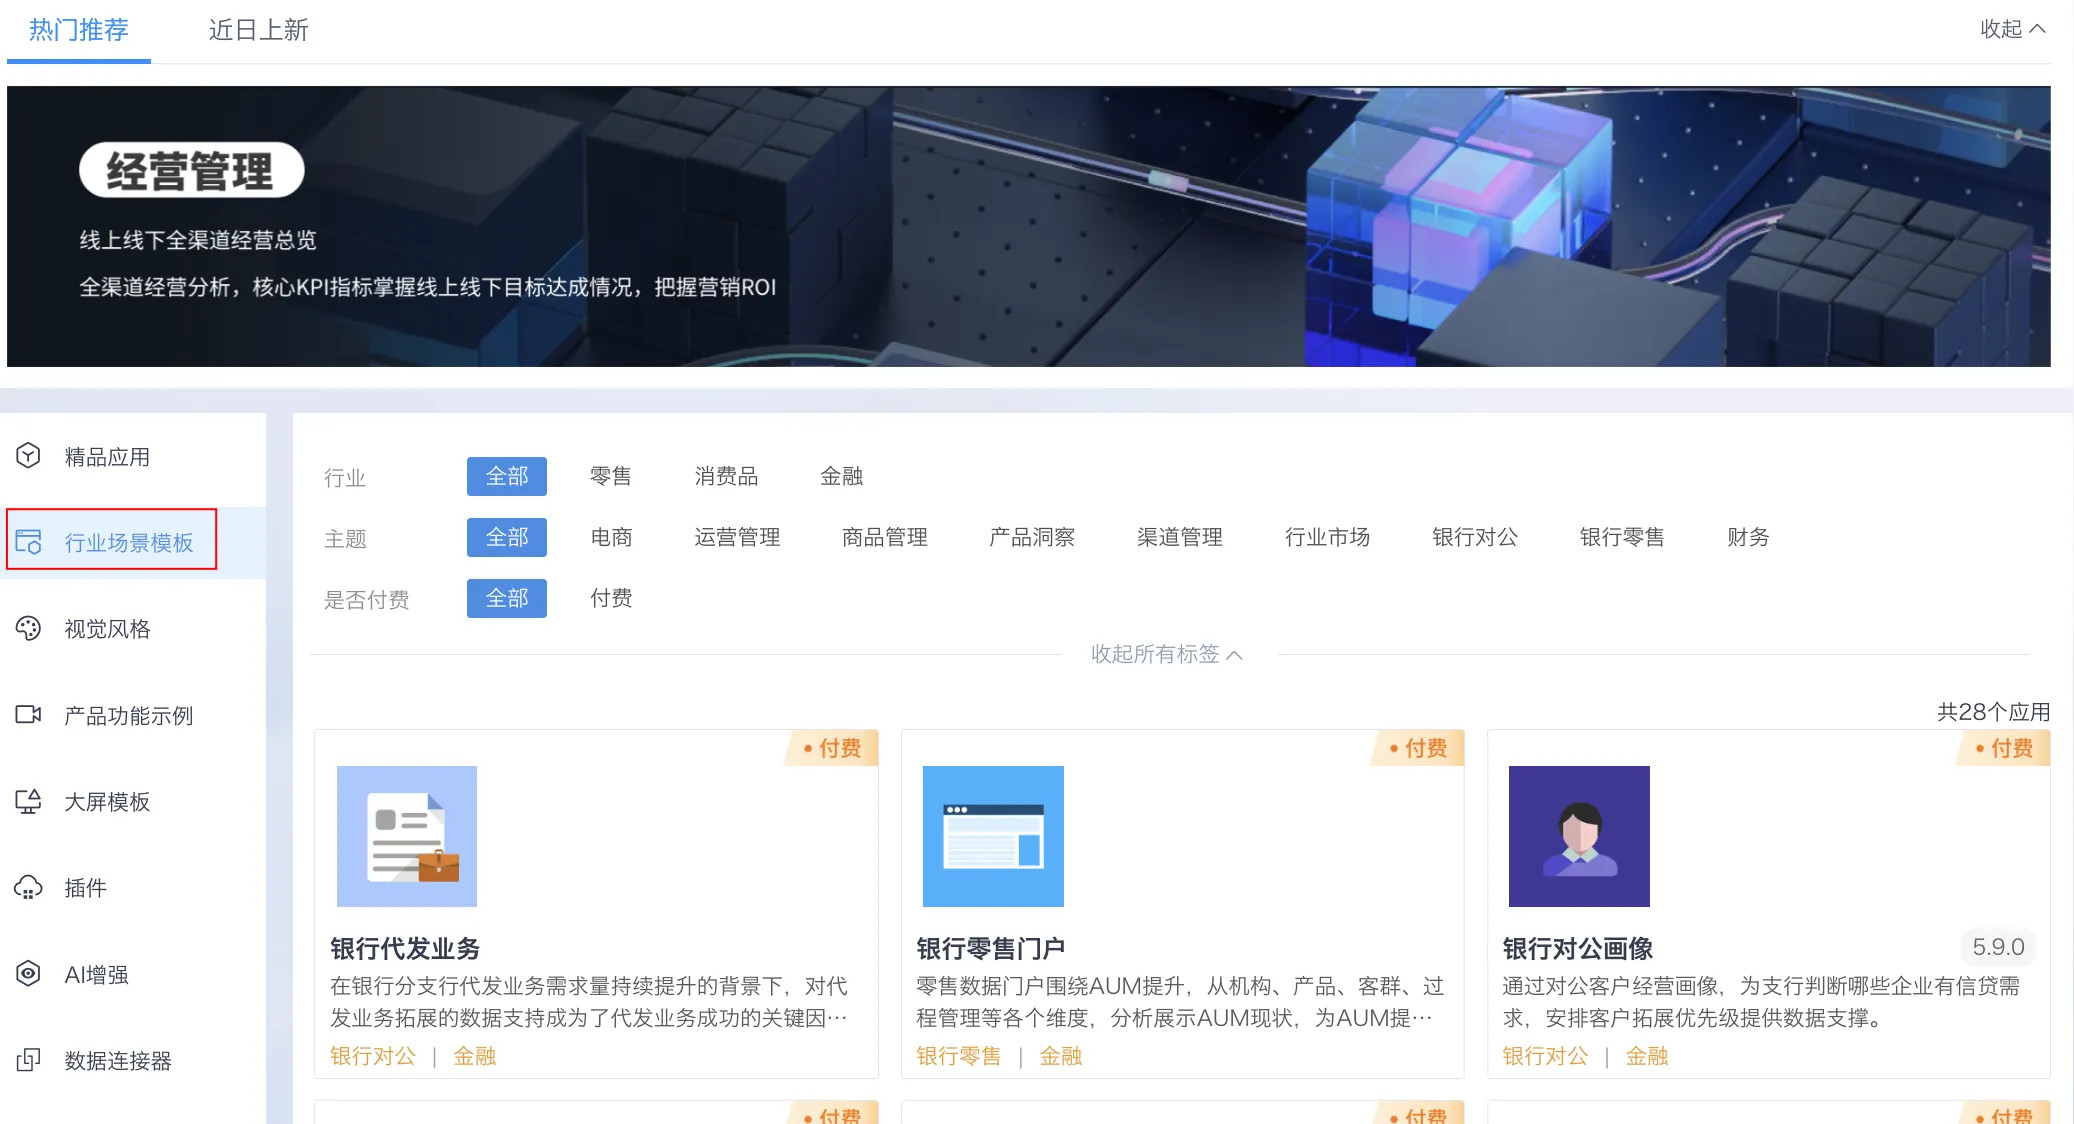
Industry solution applications are further subdivided according to themes, platforms, and capabilities. Users can quickly filter based on their own situation, find applications they are interested in, and further view details.
-
From an industry perspective, it includes but is not limited to vertical industry scenarios such as retail, food service, and footwear and apparel, as well as horizontal function scenarios such as HR and finance for users to choose from;
-
From a theme perspective, it includes but is not limited to industry markets, business management, executive management, channel management, operations management, etc. for users to choose from;
3.3.3 Visual Styles
Visual styles are flexible and easy-to-use dashboard beautification tools, targeting users who frequently perform data analysis and visualization but struggle with lack of professional design capabilities. They provide quick dashboard beautification product capabilities and a large number of beautiful visual templates, achieving dashboard beautification work in just a few steps, allowing users to have high-aesthetic dashboards in minutes, and dedicating precious time and energy to producing more data value.
Unlike traditional visualization templates, addressing the problems of low efficiency in enterprise visualization presentation and inconsistent, difficult-to-manage visual effects, we support enterprise administrators to build their own templates for widespread user reuse; we also support quick dataset replacement after downloading from the Application Market, completing dashboard beautification work in just a few simple steps. We also support opening more dashboard theme templates for users to download and use with one click.
3.3.4 Product Function Examples
Product function examples are important resources for providing users with Guandata product-related knowledge and skills. These materials help users quickly understand and master the various product functions and services provided by Guandata. Beginners can easily master BI entry knowledge through detailed explanations and demonstration guides, thus easily getting started and skillfully operating Guandata products. Based on basic guides, we also provide advanced/senior practice techniques and case explanations for different user roles (such as data analysts), such as demonstrations of functions like visualization dictionaries, conditional formatting, and Spark advanced functions. This helps different user roles learn the rich functions and features of products in different usage scenarios.
3.3.5 Large Screen Templates
Guandata's professional UI designers and data analysis teams, leveraging industry practical experience, have created high-aesthetic large screen templates suitable for multiple business scenarios and integrated them into the Application Market template library for enterprise users to access and use at any time. Without design experience, users can easily create eye-catching and cool large screens. In Guandata's Application Market large screen template store, users can browse and select templates that meet their needs, easily integrate them into the BI system, and quickly generate personalized large screen content through one-click data replacement. These templates support drag-and-drop editing, allowing users to freely adjust content and dimensions according to their needs. We expect users to significantly save UI design costs, reduce visualization complexity, and greatly improve data presentation effects and value through Guandata's Application Market large screen templates.
3.3.6 Plugins
For enterprises, data visualization can eliminate barriers between stored data and each employee's use of data within the enterprise. At the same time, data visualization also helps promote accelerated decision-making by executives. In different business scenarios, using existing BI charts may not meet all data analysis needs, so there are often requirements for special charts. In addition to building special charts through the custom chart function within Guandata BI, we also support providing ready-to-use visualization plugins in the Application Market, such as dumbbell charts, calendar charts, prediction curve charts, butterfly charts, and many other types. Users only need to search and download their preferred visualization application plugins in the Application Market, and install them to BI with one click to help users more conveniently achieve data visualization acceleration.
3.3.7 AI Assistants
AI assistant applications use AI as the computing engine and BI as the digital display and interaction tool, providing scenario-based solutions for enterprise users quickly through the combination of "AI+BI", helping enterprises conduct in-depth exploration of data analysis.
These AI assistants cover full-process scenarios from data processing to visualization, with each module solving specific business pain points through intelligent capabilities.
- Intelligent Formula Generation Assistant: This is an intelligent tool that utilizes natural language processing technology. Users only need to describe the complex calculation logic or data filtering conditions required in their data analysis using everyday language, and it can automatically generate directly usable "ETL-Query SQL" and "Card-Calculated Field" formulas. It significantly reduces users' mastery threshold for SQL syntax and complex function expressions, enabling business analysts and other non-technical users to efficiently and accurately define core data logic, greatly improving the efficiency of building data pipelines and creating analysis content.
- Intelligent Chart Generation Assistant: Leveraging the natural language understanding capabilities of AI large models, this assistant allows users to directly describe the data insights or chart effects they want to present using everyday language (for example, "compare sales trends by region by month"), and it can automatically generate customized business visualization charts that meet requirements. It completely eliminates the programming skill requirements of traditional data visualization. Users don't need to write any chart configuration code to quickly transform data into intuitive, professional charts, greatly reducing the technical threshold and application speed of data visualization.
- Intelligent Naming Assistant: The Intelligent Naming Assistant relies on advanced AI technology, automatically parsing the core elements and business logic of resource content through deep machine learning and natural language processing algorithms, thus quickly generating accurate, standardized, and semantically rich names and descriptions. It is specifically designed to solve problems such as non-standardization, inconsistency, and ambiguous meaning in the naming process of resources such as dashboards, datasets, and ETL. In practical applications, whether it's name generation for calculated fields, datasets, indicators, cards, or applications, or description writing for datasets, pages, indicators, cards, and applications, this assistant can output naming and description content that meets requirements according to business scenarios.
- Intelligent ETL Assistant: This is an AI-driven plugin deeply integrated into the ETL development process, specifically designed to improve the development and operation efficiency of data processing tasks. It provides automated code comments to enhance readability, gives intelligent optimization suggestions based on best practices to improve data processing performance, and can generate clear and standardized ETL process documentation with one click. This assistant is like an experienced ETL development partner, running through the entire data pipeline construction, optimization, and maintenance cycle, significantly improving development speed, code quality, and team collaboration efficiency.
- Intelligent Plugin Generation Assistant: This assistant is based on powerful AI large models, understanding users' needs for specific functions through natural language dialogue interaction, and can quickly generate frontend plugins for the Guandata BI platform without writing any code. Users only need to describe the desired interaction functions or data processing logic in natural language, and this assistant can automatically generate runnable plugin code, greatly simplifying the function extension process of the Guandata BI platform, allowing users to easily customize their analysis experience.
- Product Usage AI Q&A Assistant: A personal exclusive customer service and intelligent BI butler, providing users with 7*24-hour online technical support, making answers accessible at their fingertips. Users no longer need to laboriously consult the complex online help center knowledge base on PC, spend time learning and understanding to find answers. Now, just activate the intelligent butler on mobile devices, ask questions quickly, and the system will automatically generate the best graphic answers adapted to the current scenario, including function usage introductions, step-by-step operation instructions, and best practices. This always-responsive business knowledge base not only saves users' time and energy but also accelerates the BI usage and data analysis process, thereby improving collaboration efficiency.
3.3.8 Data Connectors
Data connectors are enterprise data automation integration tools created by Guandata, providing API connectors, table connectors, etc., to automatically gather data into the BI platform. The data connectors in Guandata's Application Market can help users accelerate data connection, data integration, and accumulation, thereby helping enterprise users build data analysis and decision-making systems faster, more comprehensively, and more proactively.
3.4 Application Usage
Using visualization templates as an example, let's introduce how to specifically use the Application Market.
3.4.1 Installing Applications
On the visualization template details interface, click "Install Application" to import the visualization template into your BI platform, then you can proceed with operations such as replacing datasets and template fine-tuning. (Note: Free applications can be installed directly by clicking, for paid applications please contact Guandata staff for consultation and experience.)
3.4.2 Replacing Datasets
Click directly on the top-right corner of the card, select "Edit", and you can enter the card modification and adjustment interface.
.png)
In this interface, click "Replace Dataset" in the top-left corner, and select the dataset you need.
.png)
After selecting the dataset, you need to set up field associations to complete the dataset replacement.
.png)
3.4.3 Fine-tuning Styles
After completing the dataset replacement, you can also drag and drop the dashboard to fine-tune styles. Click the drag handle above the card to move the card position, and click the drag handle in the bottom-right corner of the card to adjust the size. For more style adjustments, you can refer to 《Page Styles (Theme)》.