Cloud Inspection Introduction
Cloud Inspection Overview
Cloud Inspection, also known as cloud diagnostics or intelligent operations, is an intelligent operations service provided by Guandata. It productizes Guandata's years of digital management expertise and provides one-stop connectivity to make IT operations smarter.
Cloud Inspection focuses on BI system cluster resources and running status. It automatically generates visual analysis reports without manual data extraction or analysis, helping teams quickly discover operations issues, proactively troubleshoot faults, obtain optimization and solution recommendations, reduce daily operations costs, and plan capacity in advance.
Tip: To try this module, contact your Guandata customer success manager, usually the service contact for your company.
Cloud Inspection Use Cases
System Health Assessment
Comprehensive assessment, in-depth analysis, and proactive risk or issue prevention.
- Provides comprehensive statistics and analyzes system health across dimensions such as system performance and capacity, dashboards and cards, datasets, ETL, and users, building deep cloud inspection capabilities.
- Builds a system health scoring framework based on expert experience, providing an overall score and a clear system health level.
- Automatically generates operations reports in the cloud. Scheduled push after subscription will be supported in the future.
System Risk Identification
Compares and reasons based on expert experience and industry best practices to predict risks in advance and eliminate issues at the source.
- Analyzes reliability feature data with expert experience to improve operations professionalism.
- Detects performance exceptions promptly, resolves performance risks during sub-health periods, and identifies performance bottlenecks.
- Identifies risks in advance, turning reactive handling into proactive prevention and improving reliability.
Resource Capacity Planning (Coming Soon)
Monitors capacity, accurately identifies overloaded or idle resources, and provides optimal expansion plans based on industry best practices.
- Predicts future capacity trends and recommends optimal expansion plans from cost and performance perspectives.
- Identifies overloaded resources and provides capacity warnings in advance to reduce potential risks.
- Identifies idle resources and provides optimal recycling recommendations to improve resource utilization.
Cloud Inspection Workflow
Cloud Inspection is available in version 4.4.0 and later. The workflow is as follows:
Open Cloud Inspection
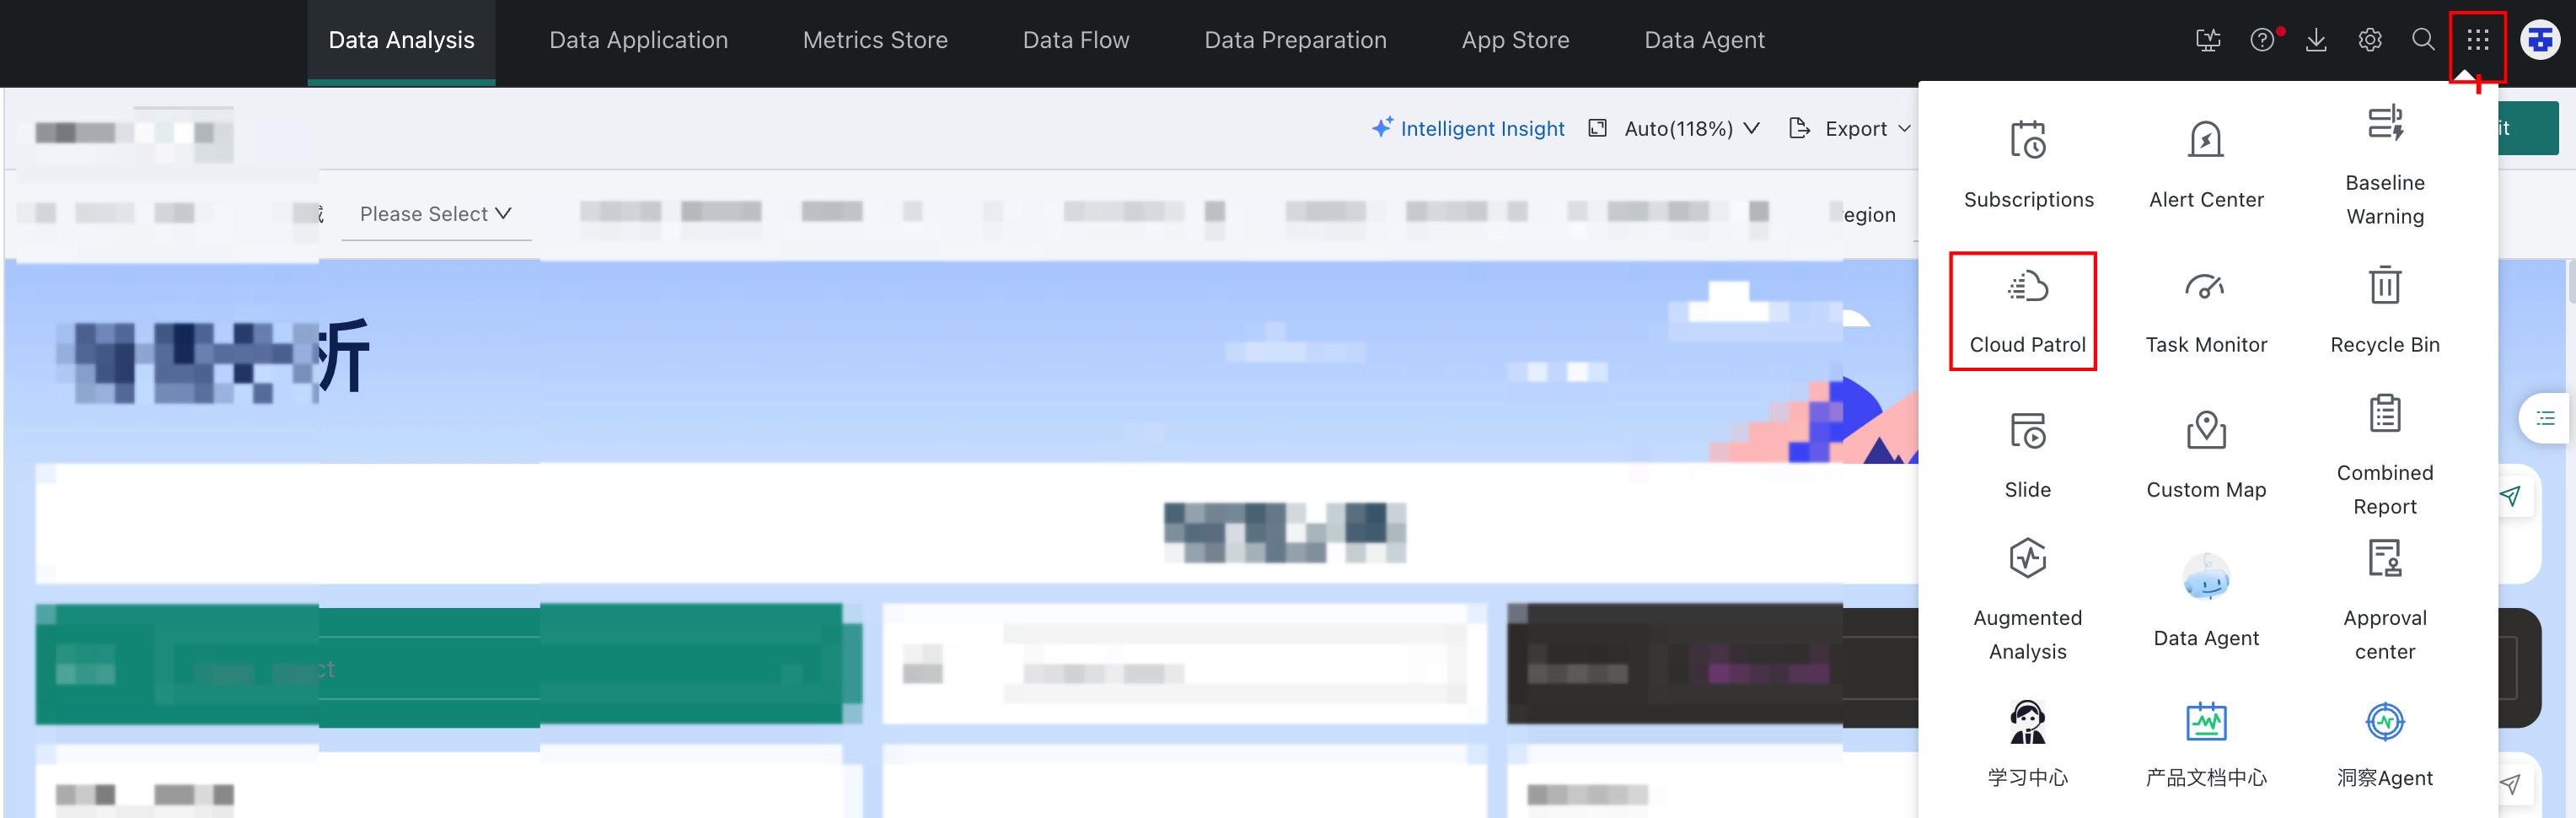
Click the app launcher in the upper-right corner of the platform and select Cloud Inspection to open the Cloud Inspection page.
Obtain a Cloud Inspection Report
Cloud Inspection reports are available in online and offline versions, depending on whether your environment can access the public network.
Online Cloud Inspection
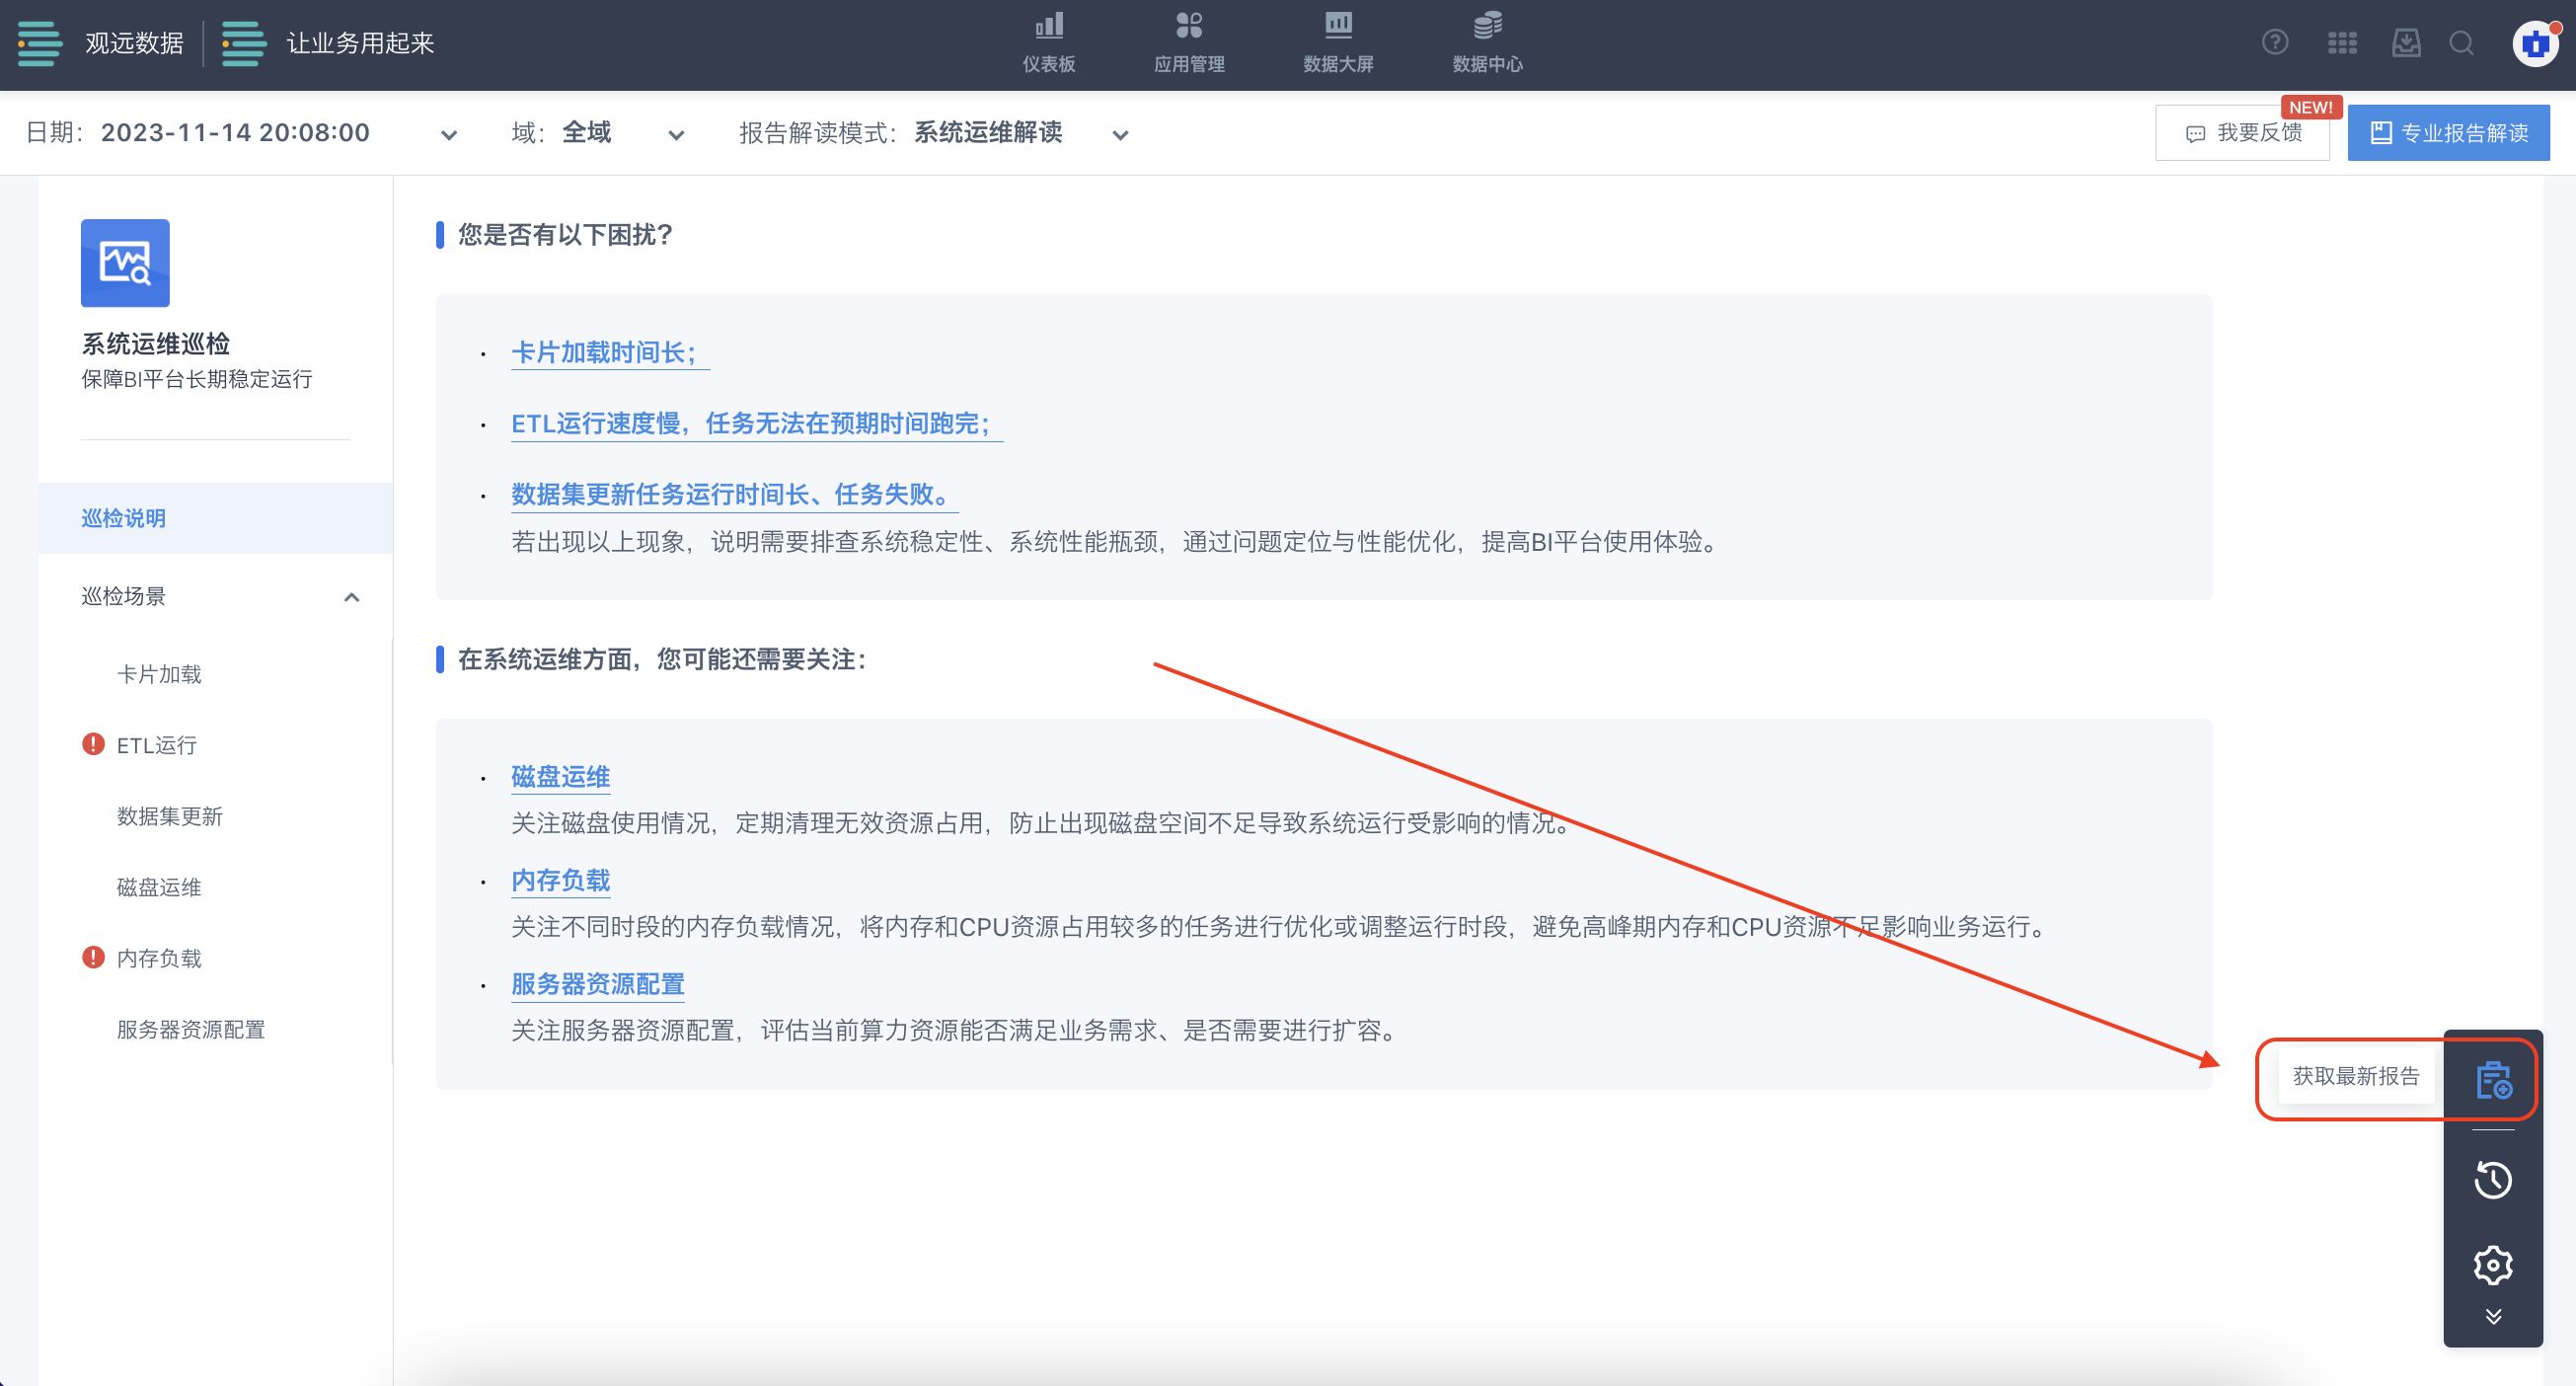
Click once to obtain the latest inspection report.
Offline Cloud Inspection
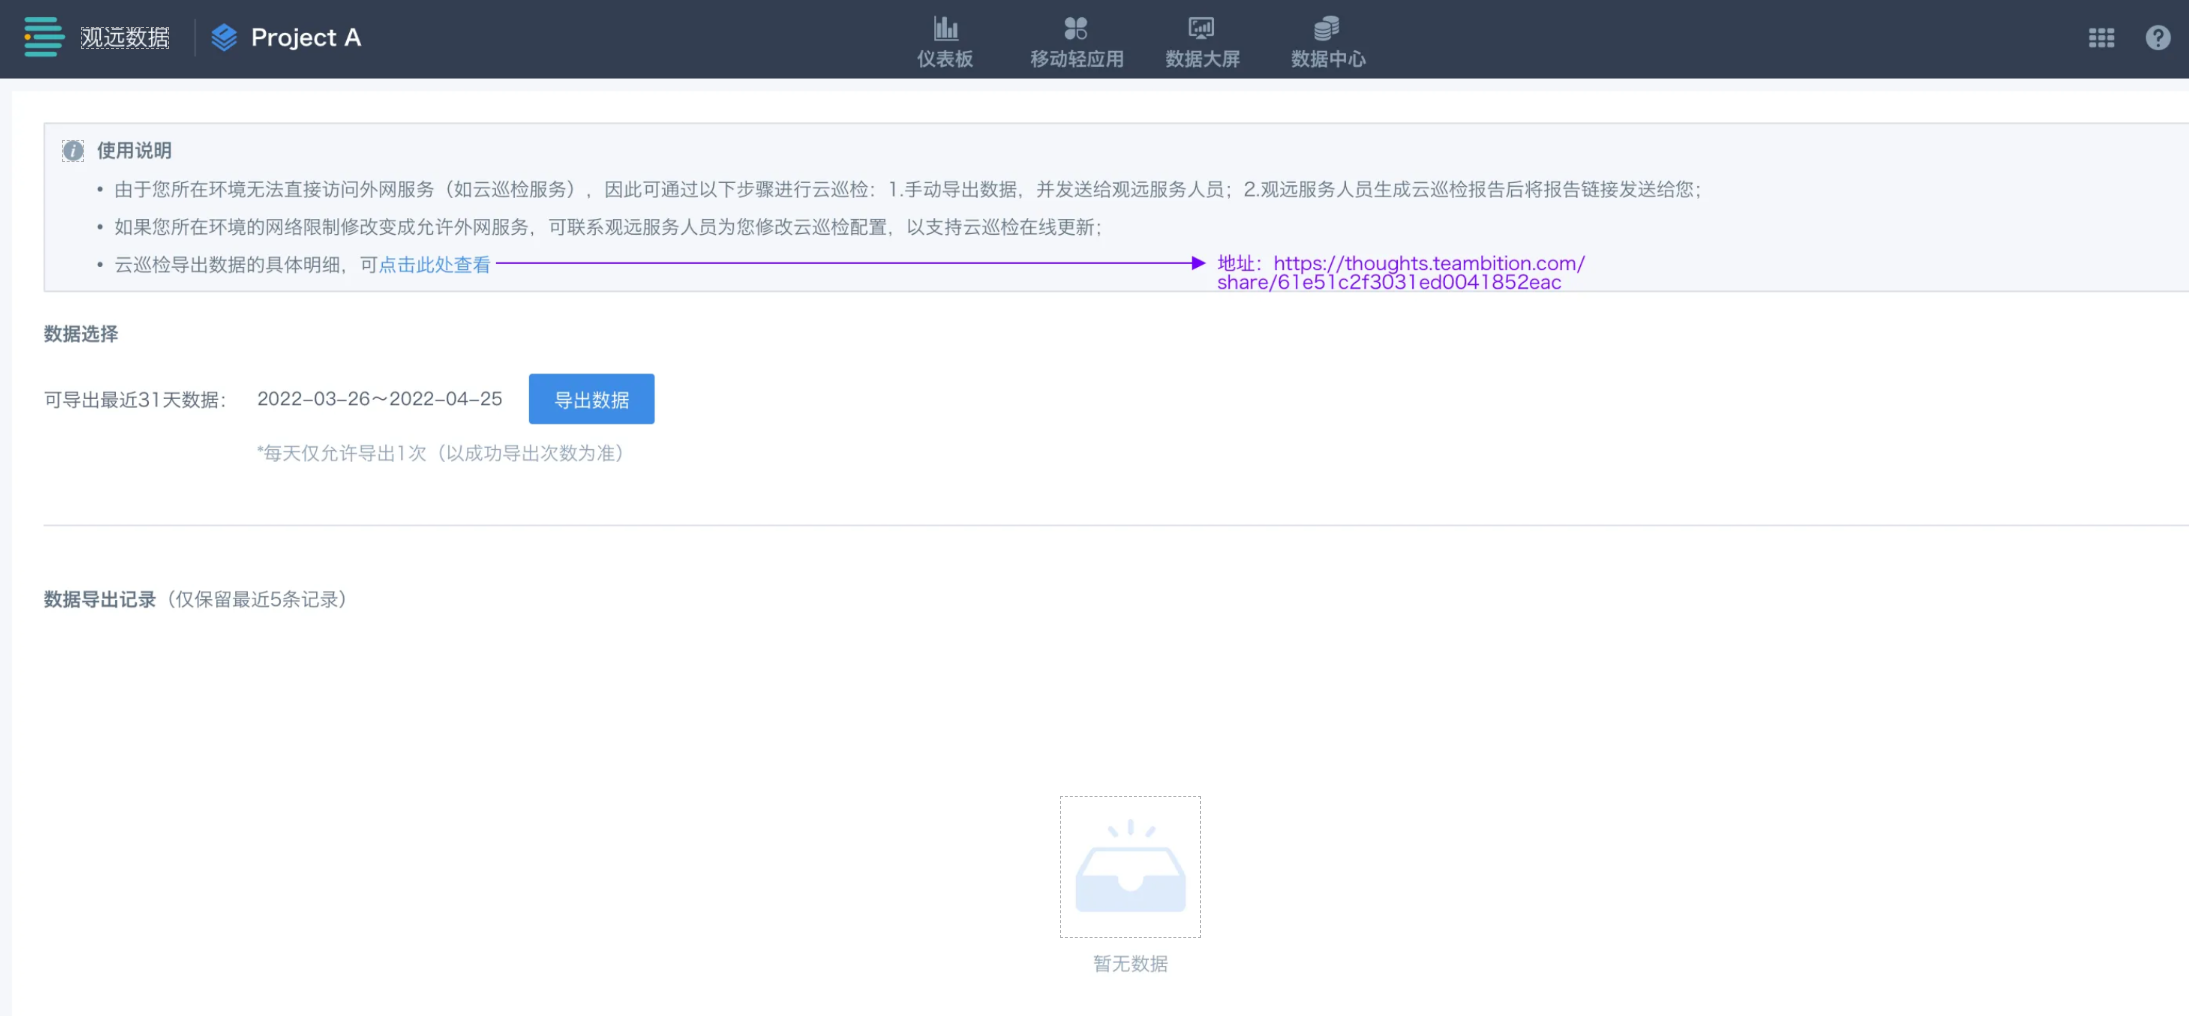
If your environment cannot directly access external services such as the Cloud Inspection service, perform Cloud Inspection as follows:
Step 1: Manually export data and send it to Guandata service personnel
In the Data Selection section, click Export Data to export data from the last 30 days.
After exporting, send the data to Guandata service personnel.
Step 2: Guandata service personnel generate the inspection report and send the report link to you
After receiving your data, Guandata personnel will manually generate the corresponding report in the Cloud Inspection service backend and send the report link to you.
You can use the link to view the Cloud Inspection results.
Switch Cloud Inspection Reports
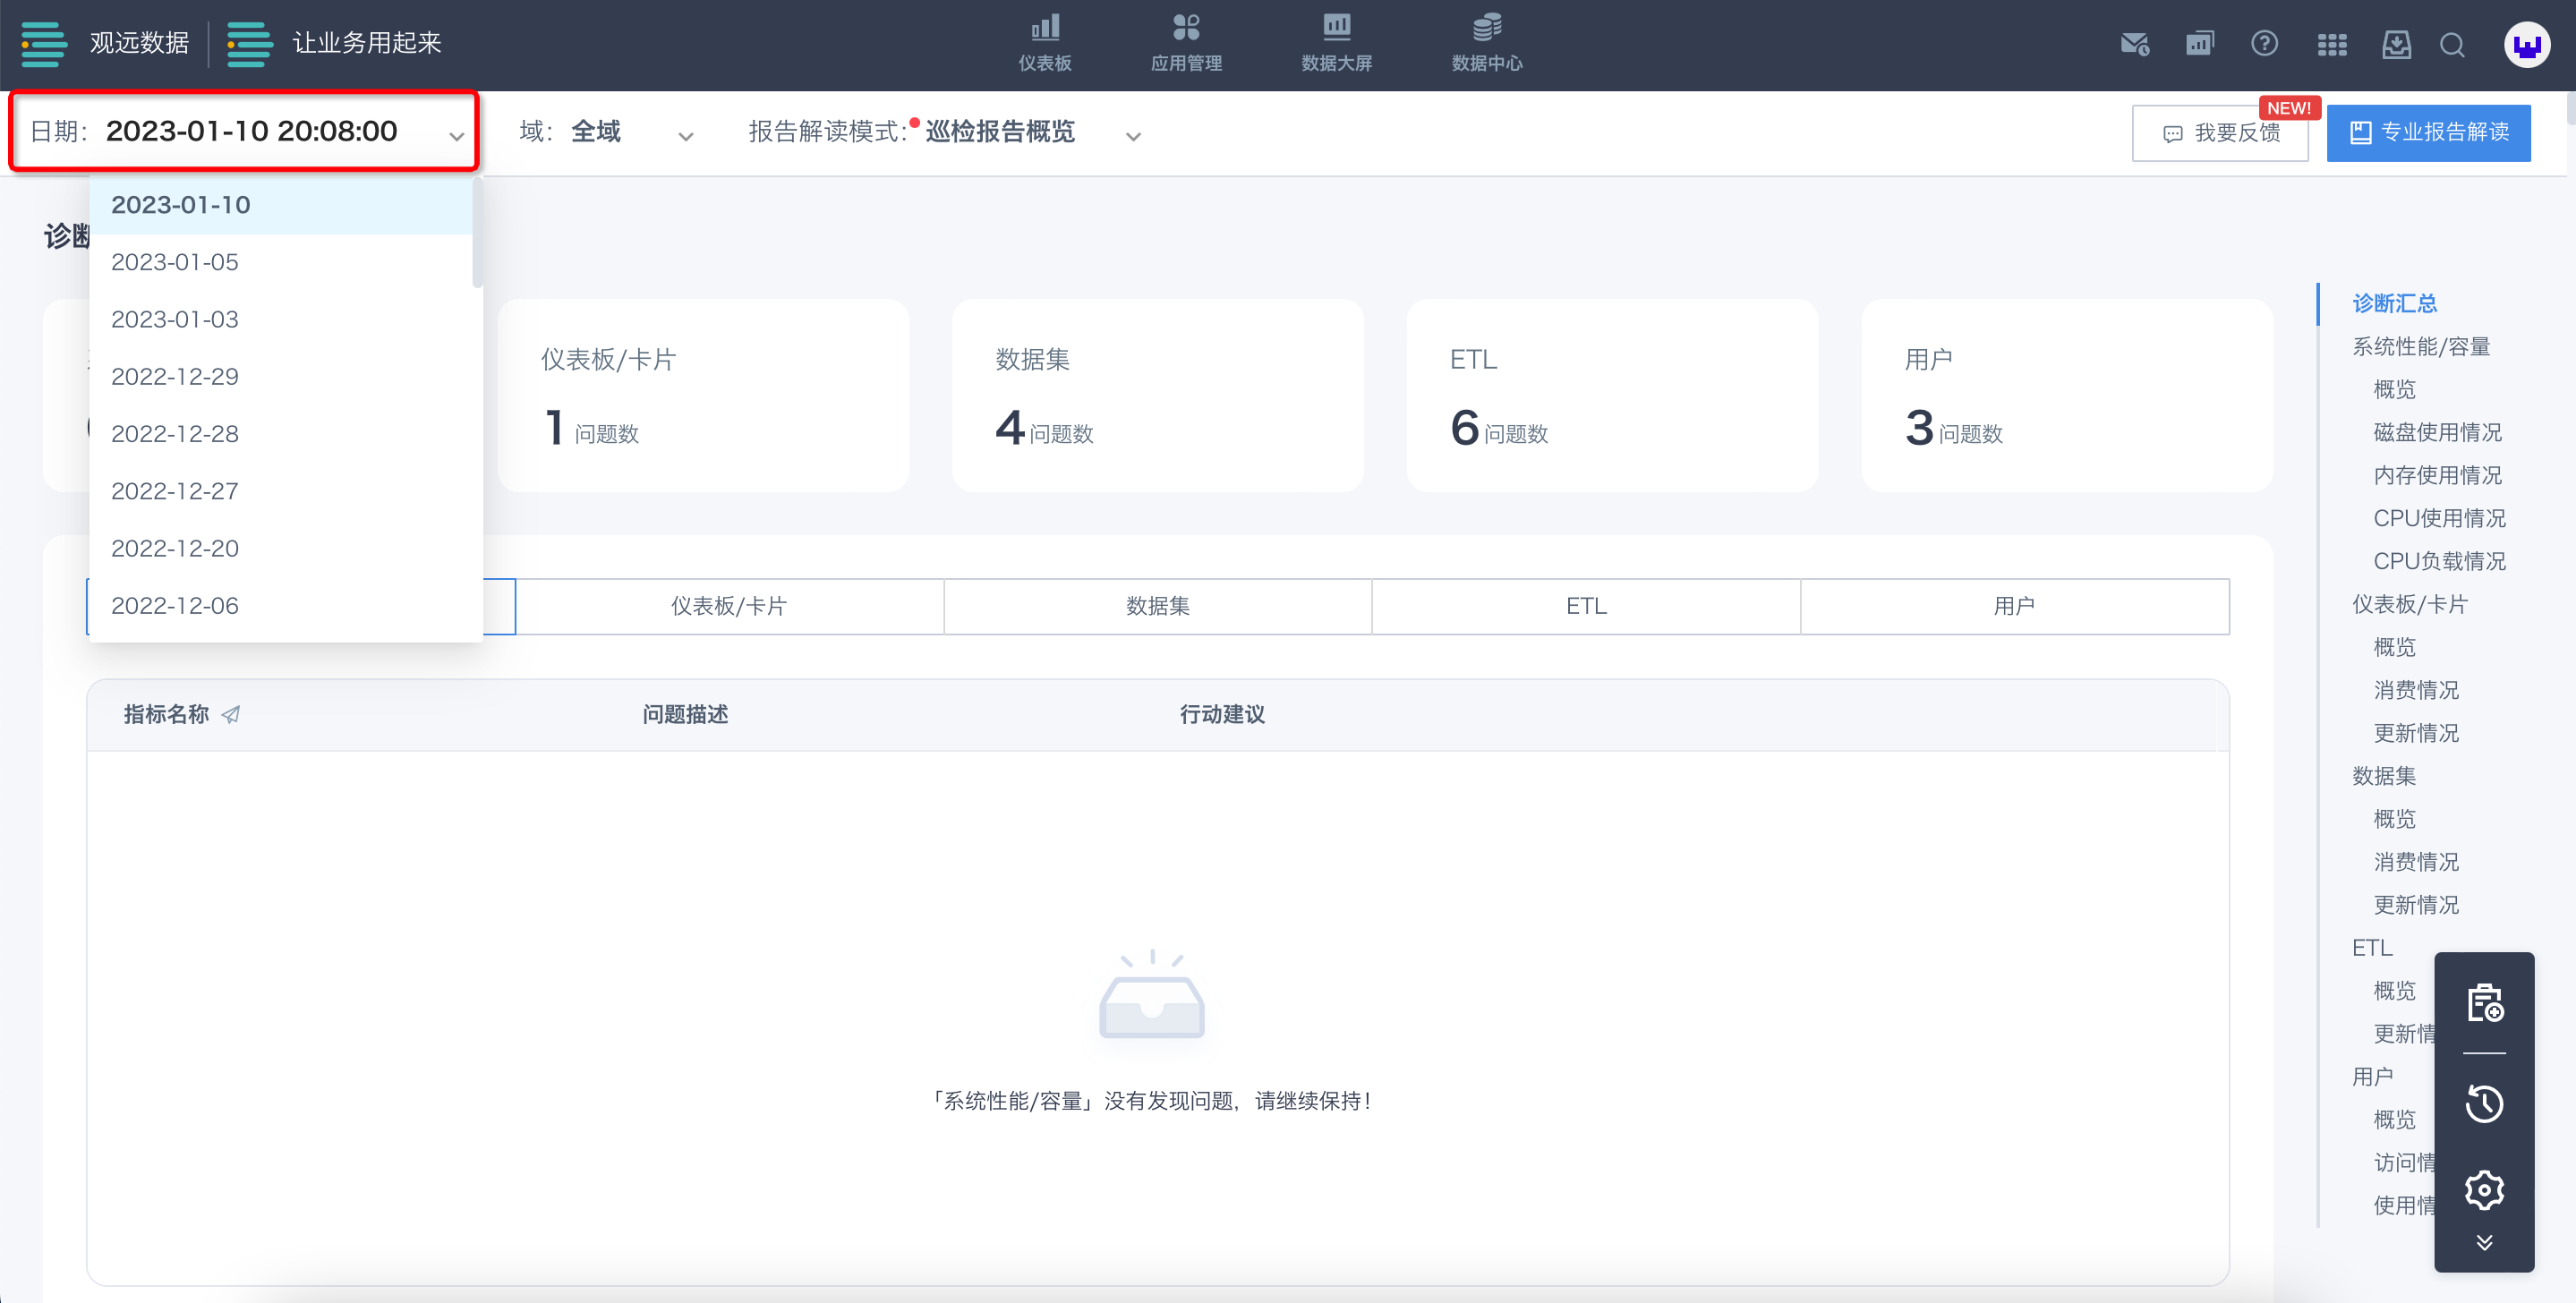
Switch by Date
Click the Date selector in the upper-left corner of the Cloud Inspection page to switch between historical reports. Select a different date from the drop-down list. The time here is equivalent to the report name. After switching, the page displays the report details.
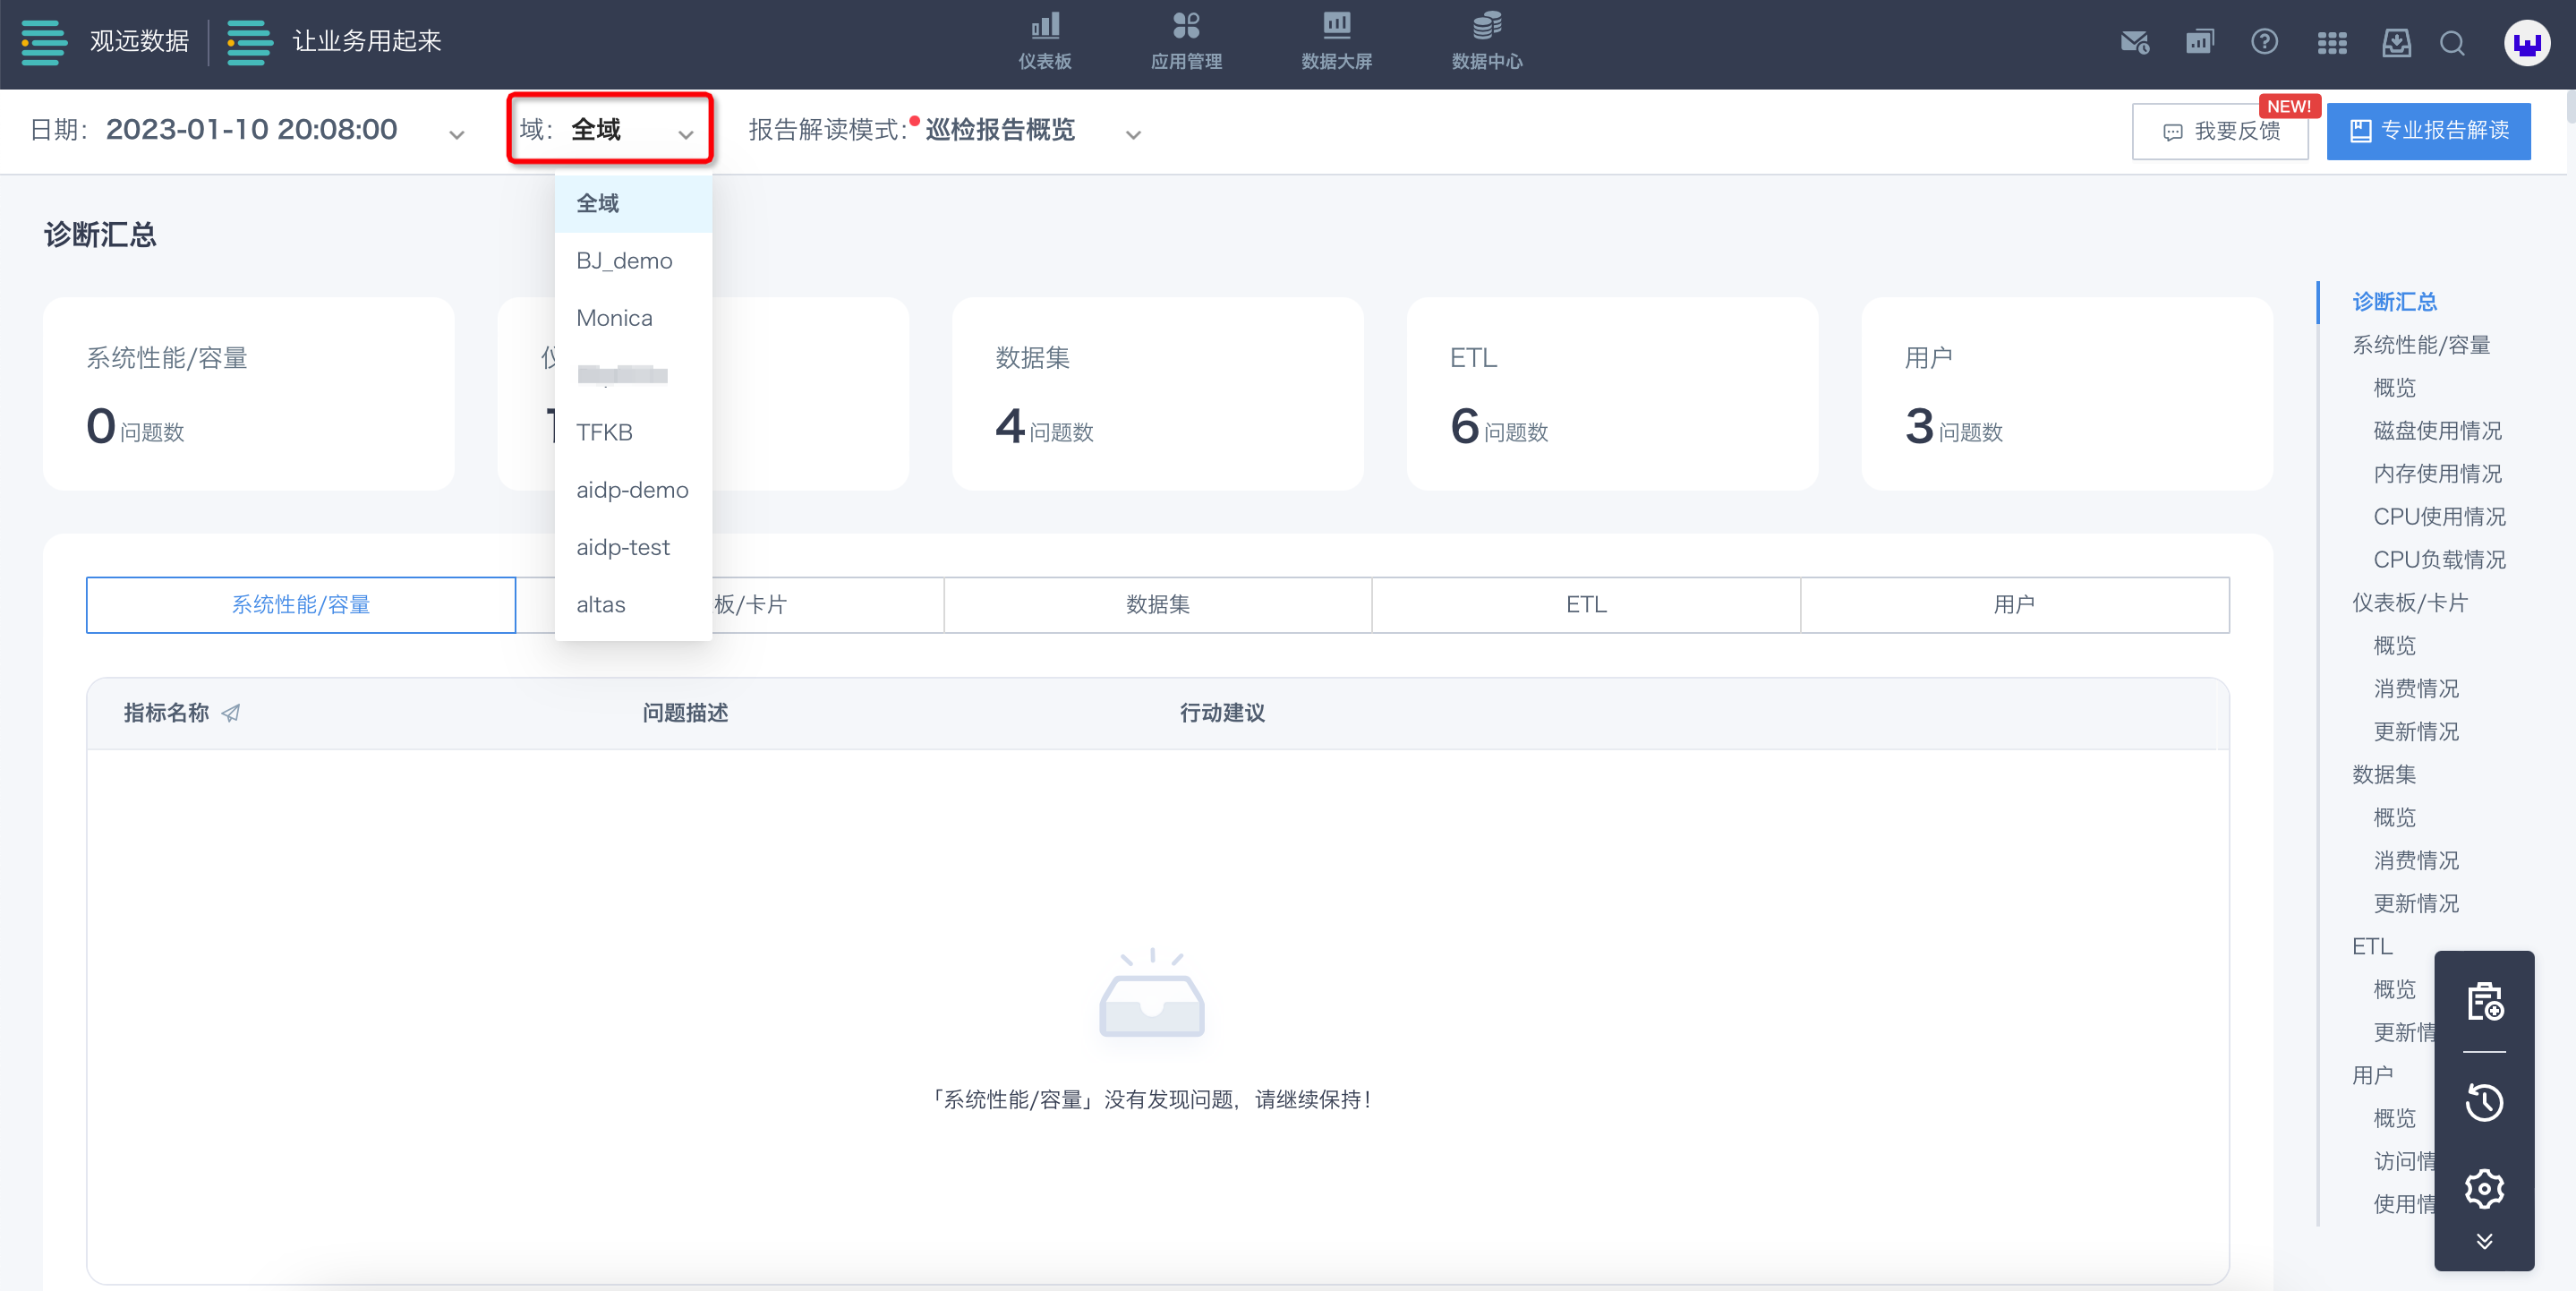
Switch by Domain
Click the Domain selector in the upper-left corner of the page, choose a domain from the drop-down list, and switch to data from that domain.
Cloud Inspection Report Content
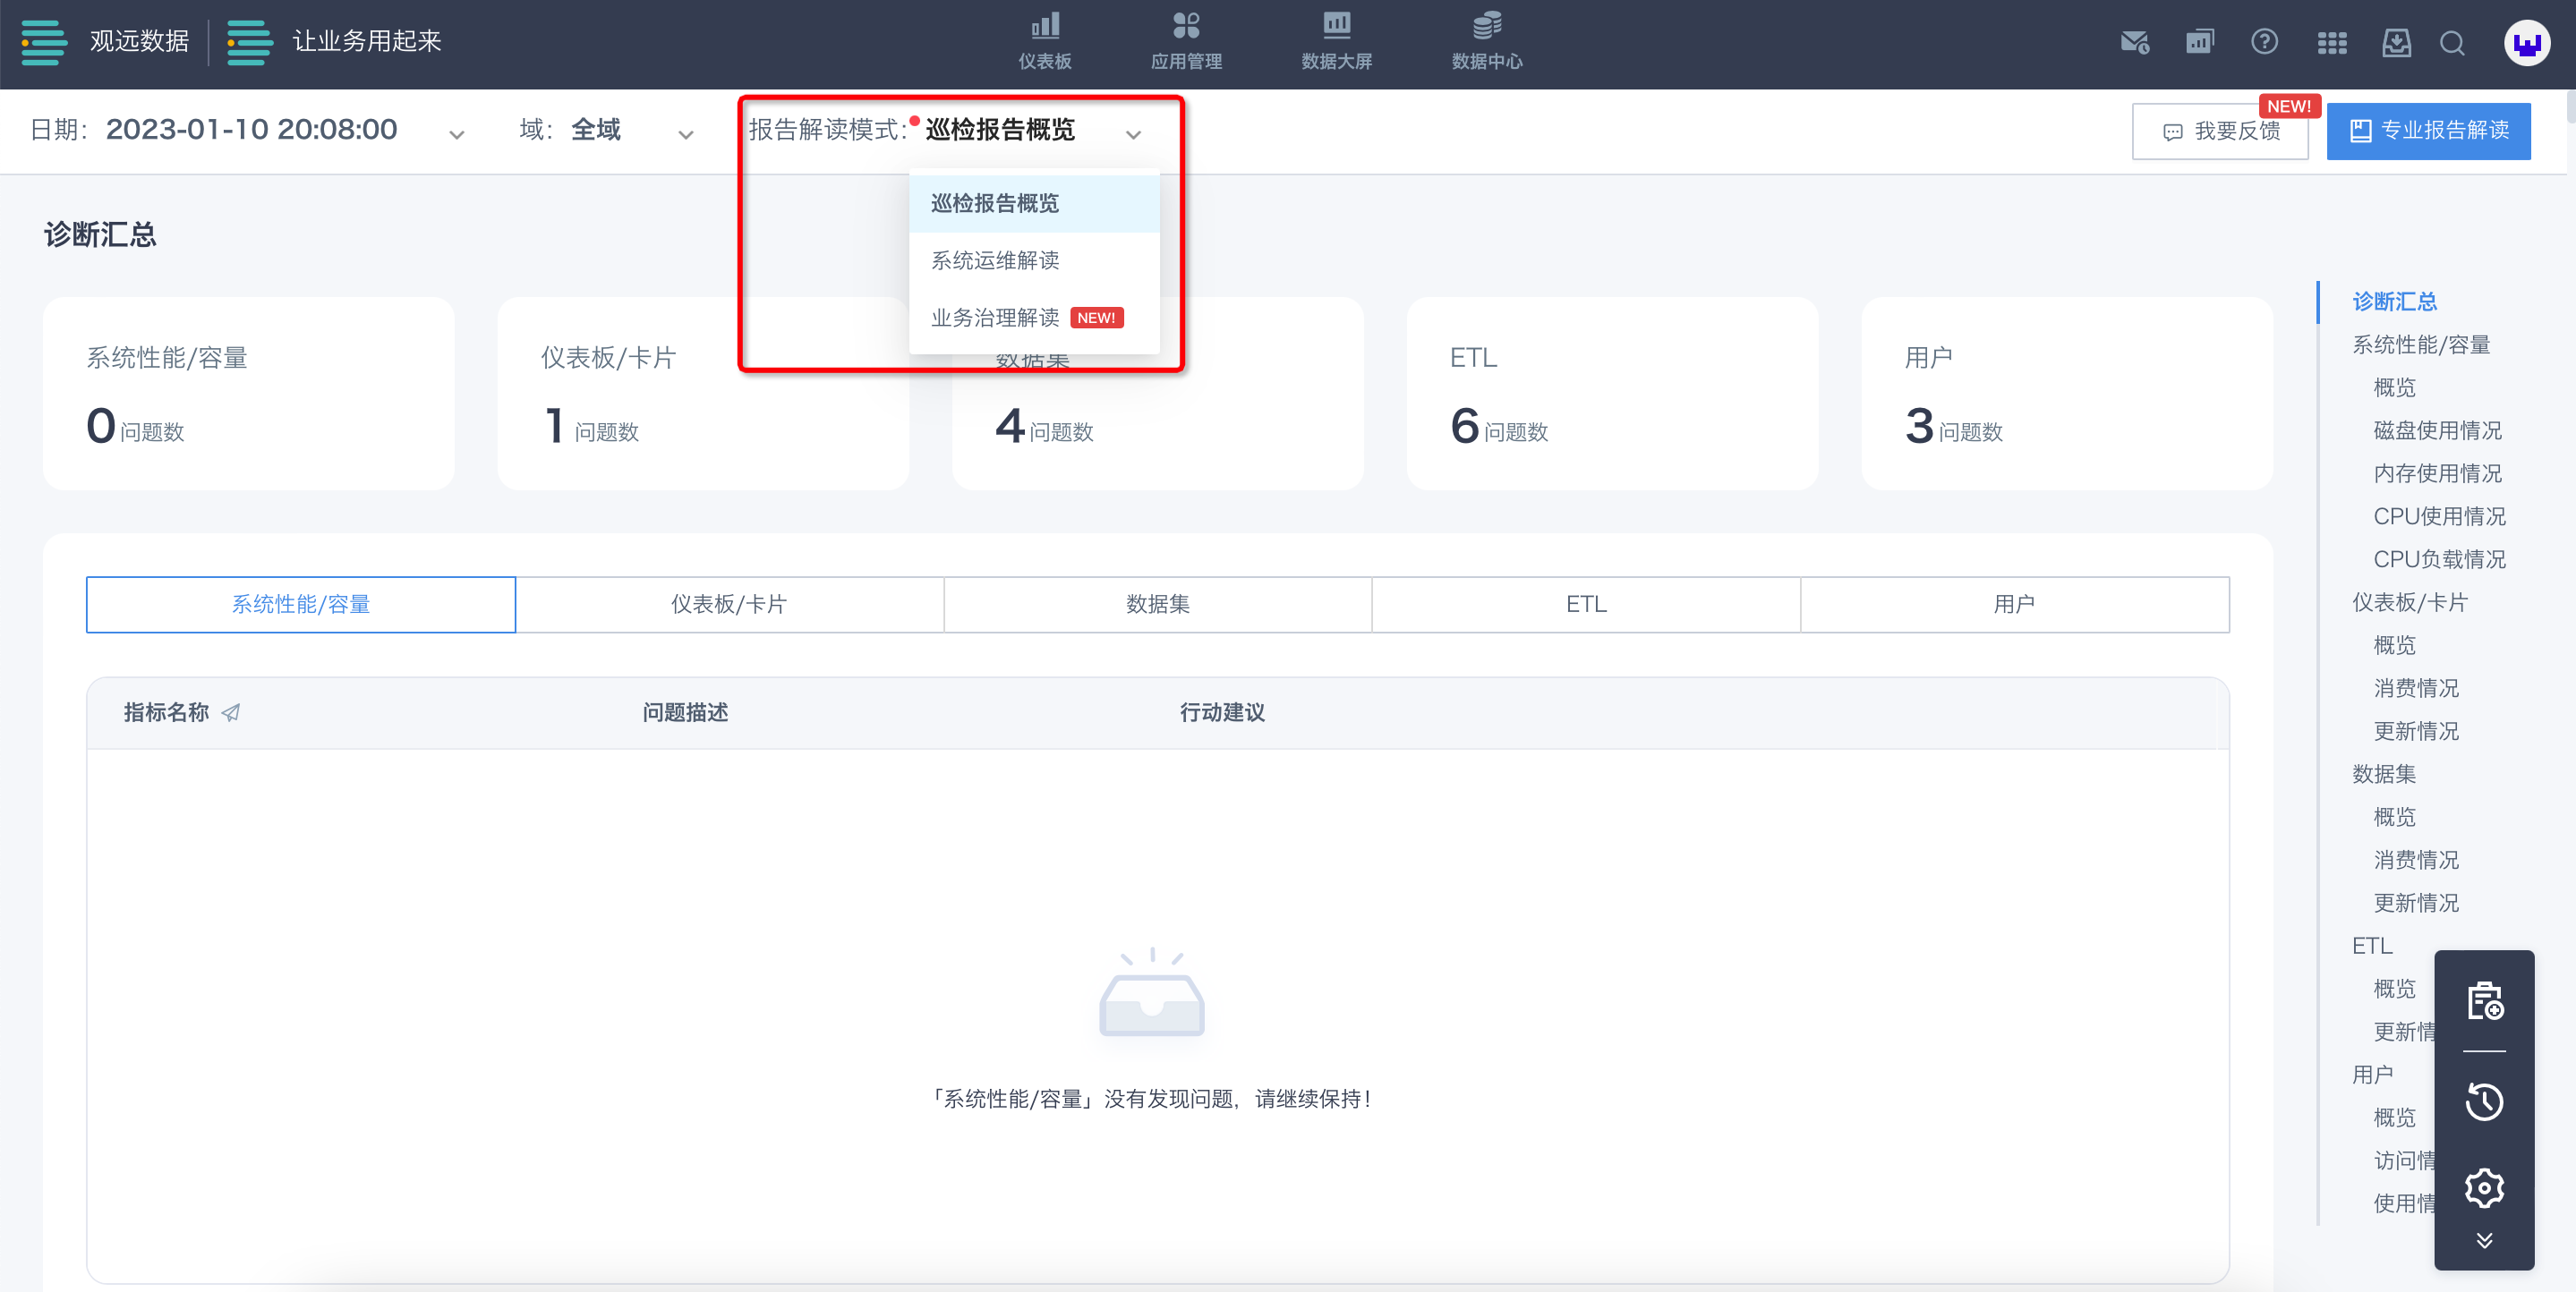
The Cloud Inspection report area contains three interpretation modes: inspection report overview, system operations interpretation, and business governance interpretation.
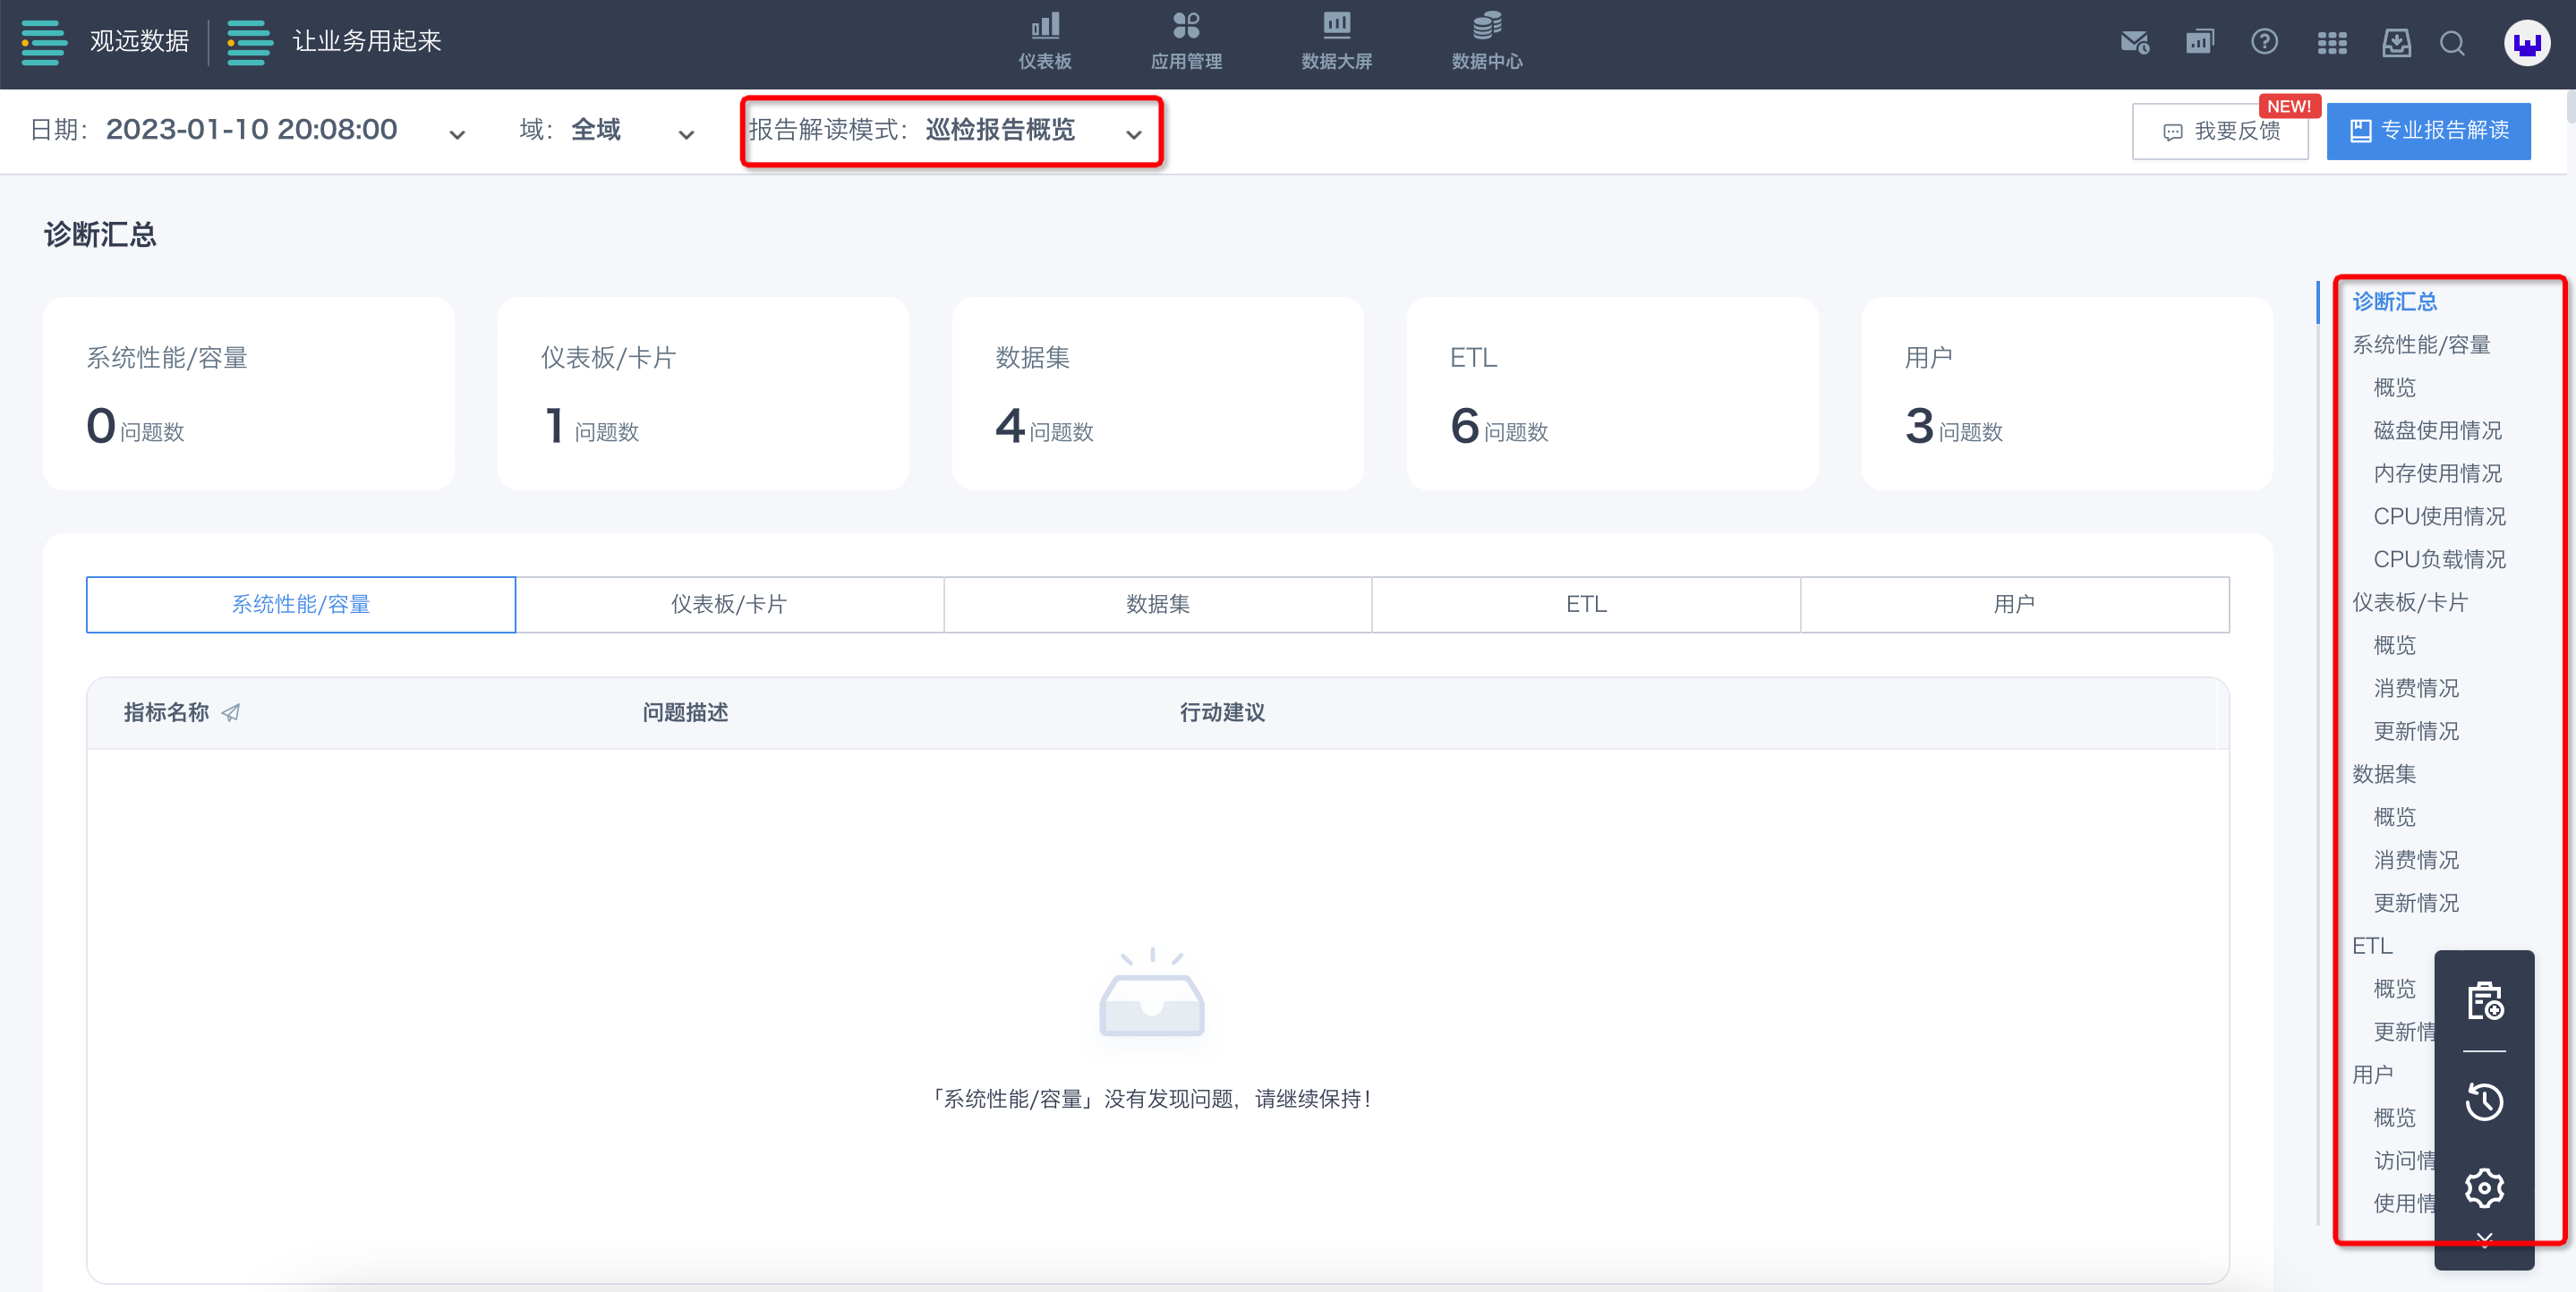
Inspection Report Overview
The overview mainly includes five categories: system performance/capacity, dashboards/cards, datasets, ETL, and users. You can quickly view them from the navigation bar on the right.
The inspection report displays potential exception analysis, reminds users of risks, and provides diagnostic recommendations for reference.
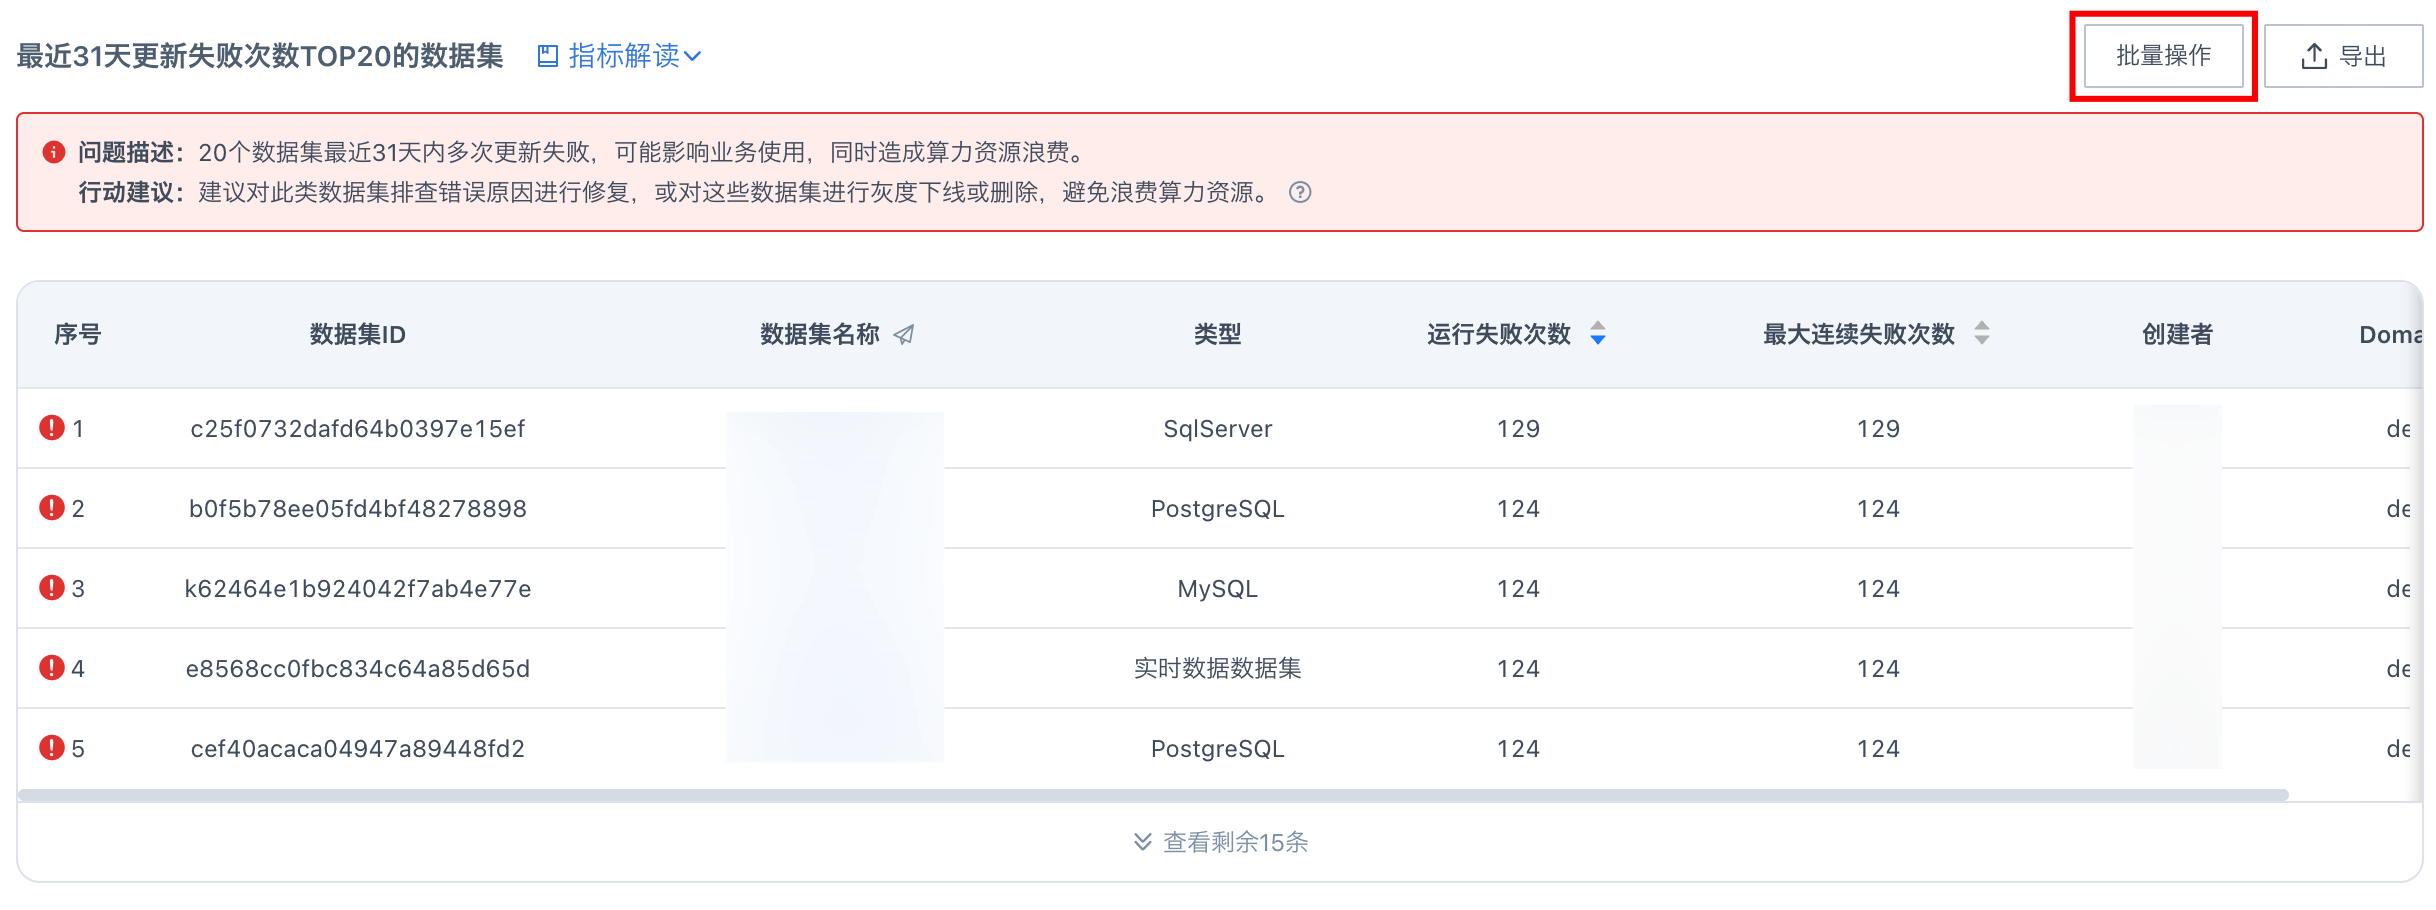
For example, for the metric Top 20 Datasets by Update Failures in the Last 31 Days, when datasets in the user environment fail to update multiple times or even continuously, the Cloud Inspection report alerts on the top 20 datasets with the highest occurrence frequency, as shown in the figure.
In this case, first change the update method of these datasets to Manual Update to avoid continuous update failures and wasted system resources. Then, based on the actual situation, batch move the corresponding datasets to a unified folder for follow-up tracing and troubleshooting. The steps are as follows:
Step 1: Click Batch Operations.
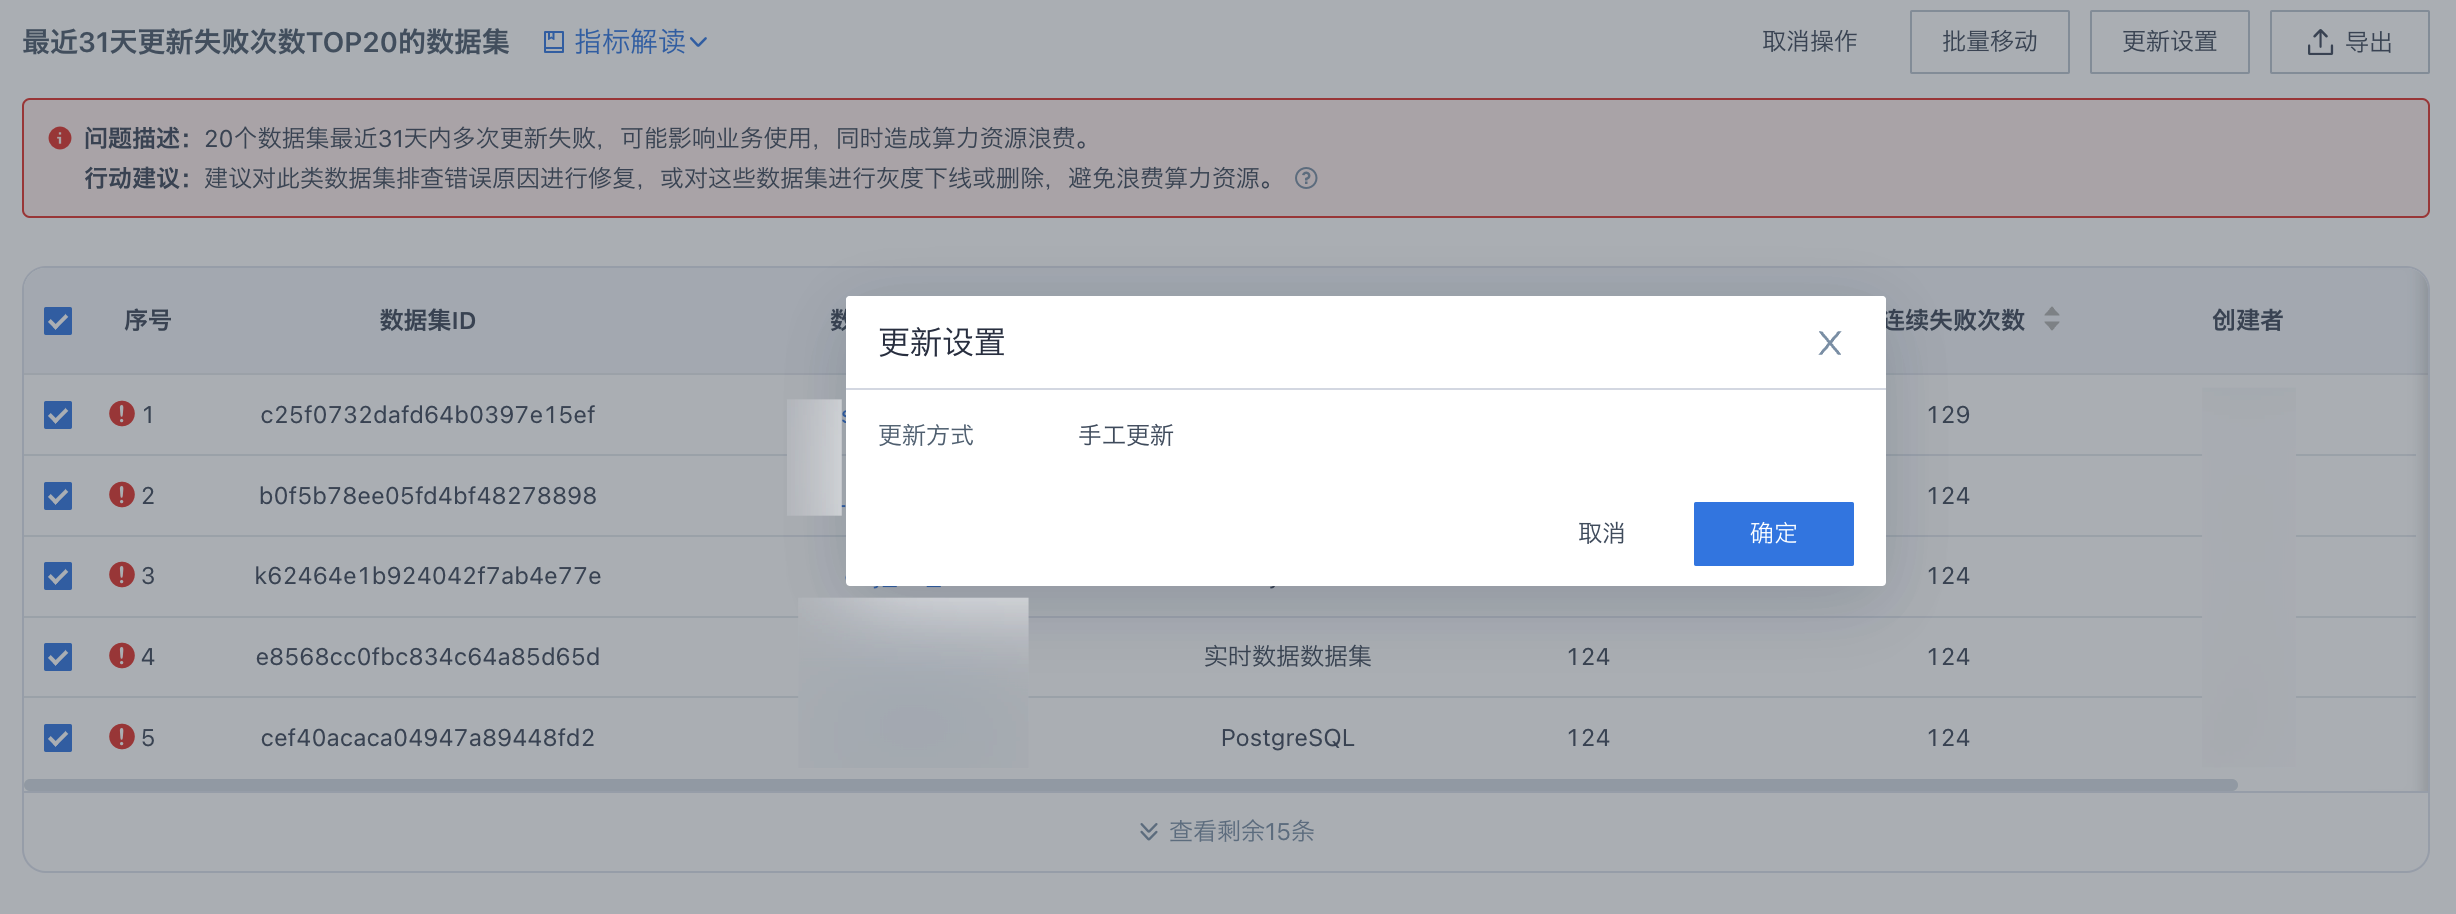
Step 2: Select Modify Update Settings and change the problematic datasets to Manual Update in batches.
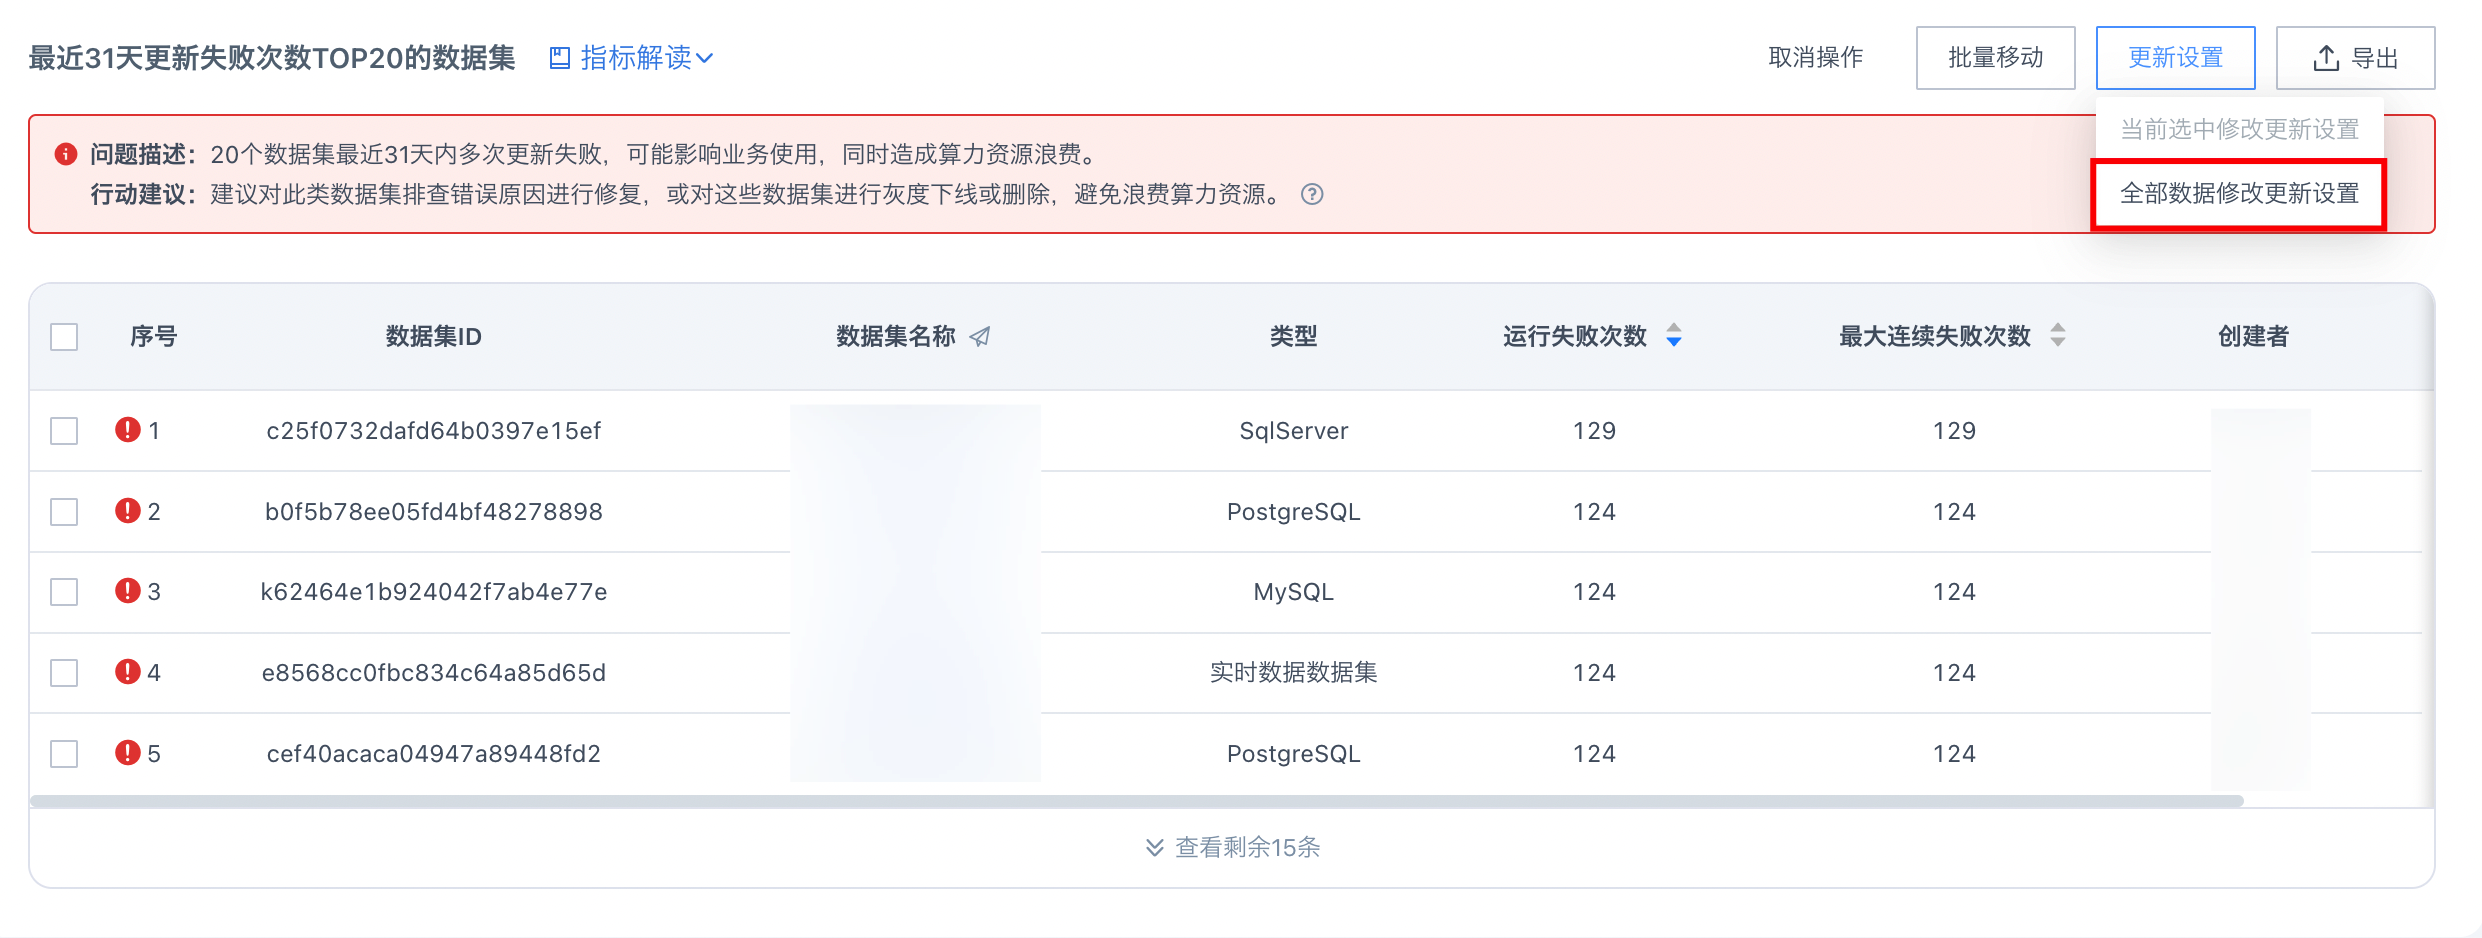
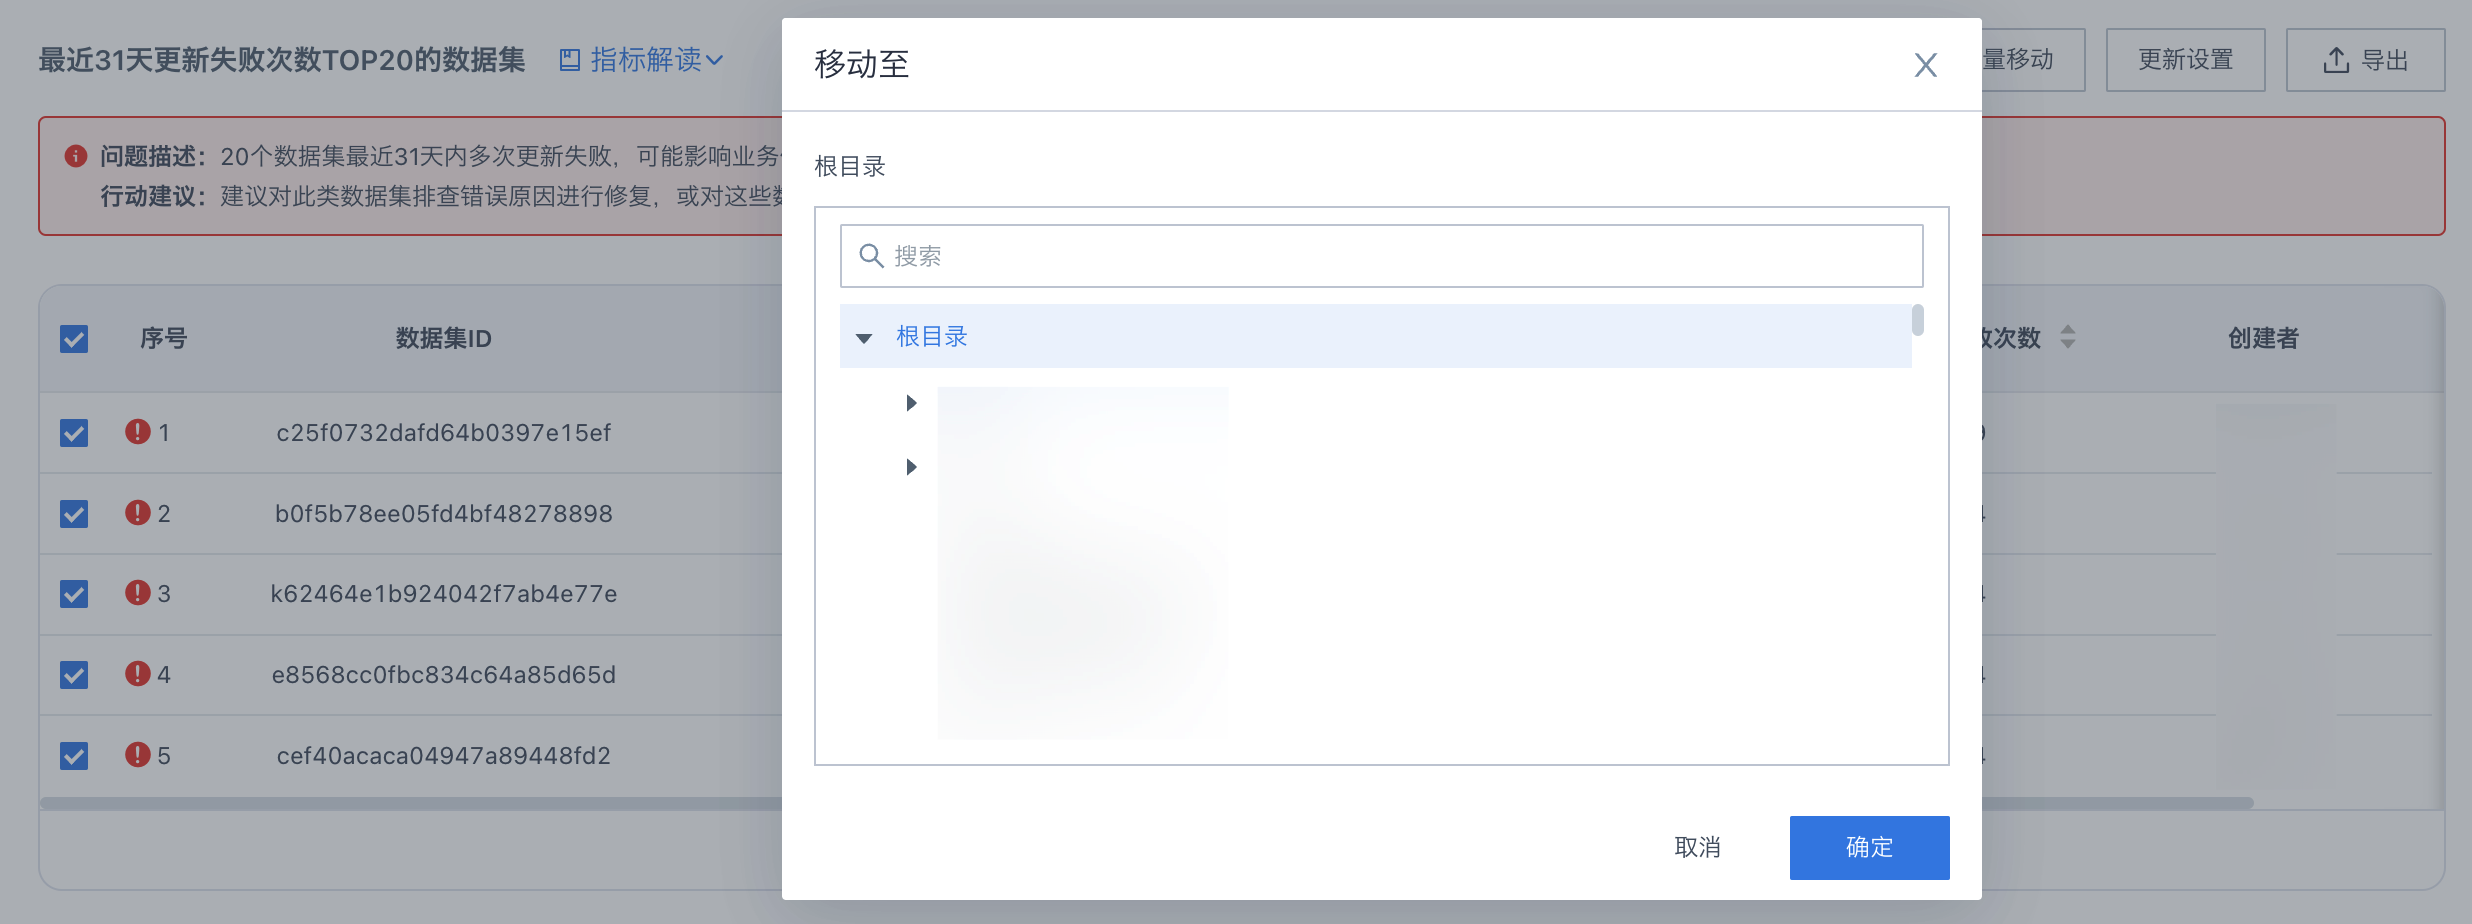
Step 3: Select Batch Move and place these datasets in a unified folder for later tracing and troubleshooting.
The list of operations supported by other metrics is as follows:
- Dataset Batch Move supported metrics: datasets with no consumption, datasets that produce invalid consumption, top 20 extracted datasets by run duration in the last 31 days (run duration >= 10s), top 20 datasets by update failures in the last 31 days, datasets not updated in the last 31 days, and empty datasets.
- Dataset Batch Modify Update Method supported metrics: datasets with no consumption and top 20 datasets by update failures in the last 31 days.
- ETL Batch Move supported metrics: top 20 ETLs by CPU usage duration in the last 31 days (CPU usage duration >= 10s), top 20 ETLs by update run count in the last 31 days (run count >= 5), top 20 ETLs by update failures in the last 31 days (run count >= 5), ETLs not run in the last 31 days, and ETLs created more than 31 days ago but never run.
- ETL Batch Modify Update Method supported metrics: top 20 ETLs by update failures in the last 30 days (run count >= 5), top 20 ETLs by CPU usage duration in the last 31 days (CPU usage duration >= 10s), and top 20 ETLs by update run count in the last 31 days (run count >= 5).
- Dashboard Batch Modify Publish Status supported metric: dashboards with 0 visitors in the last 31 days.
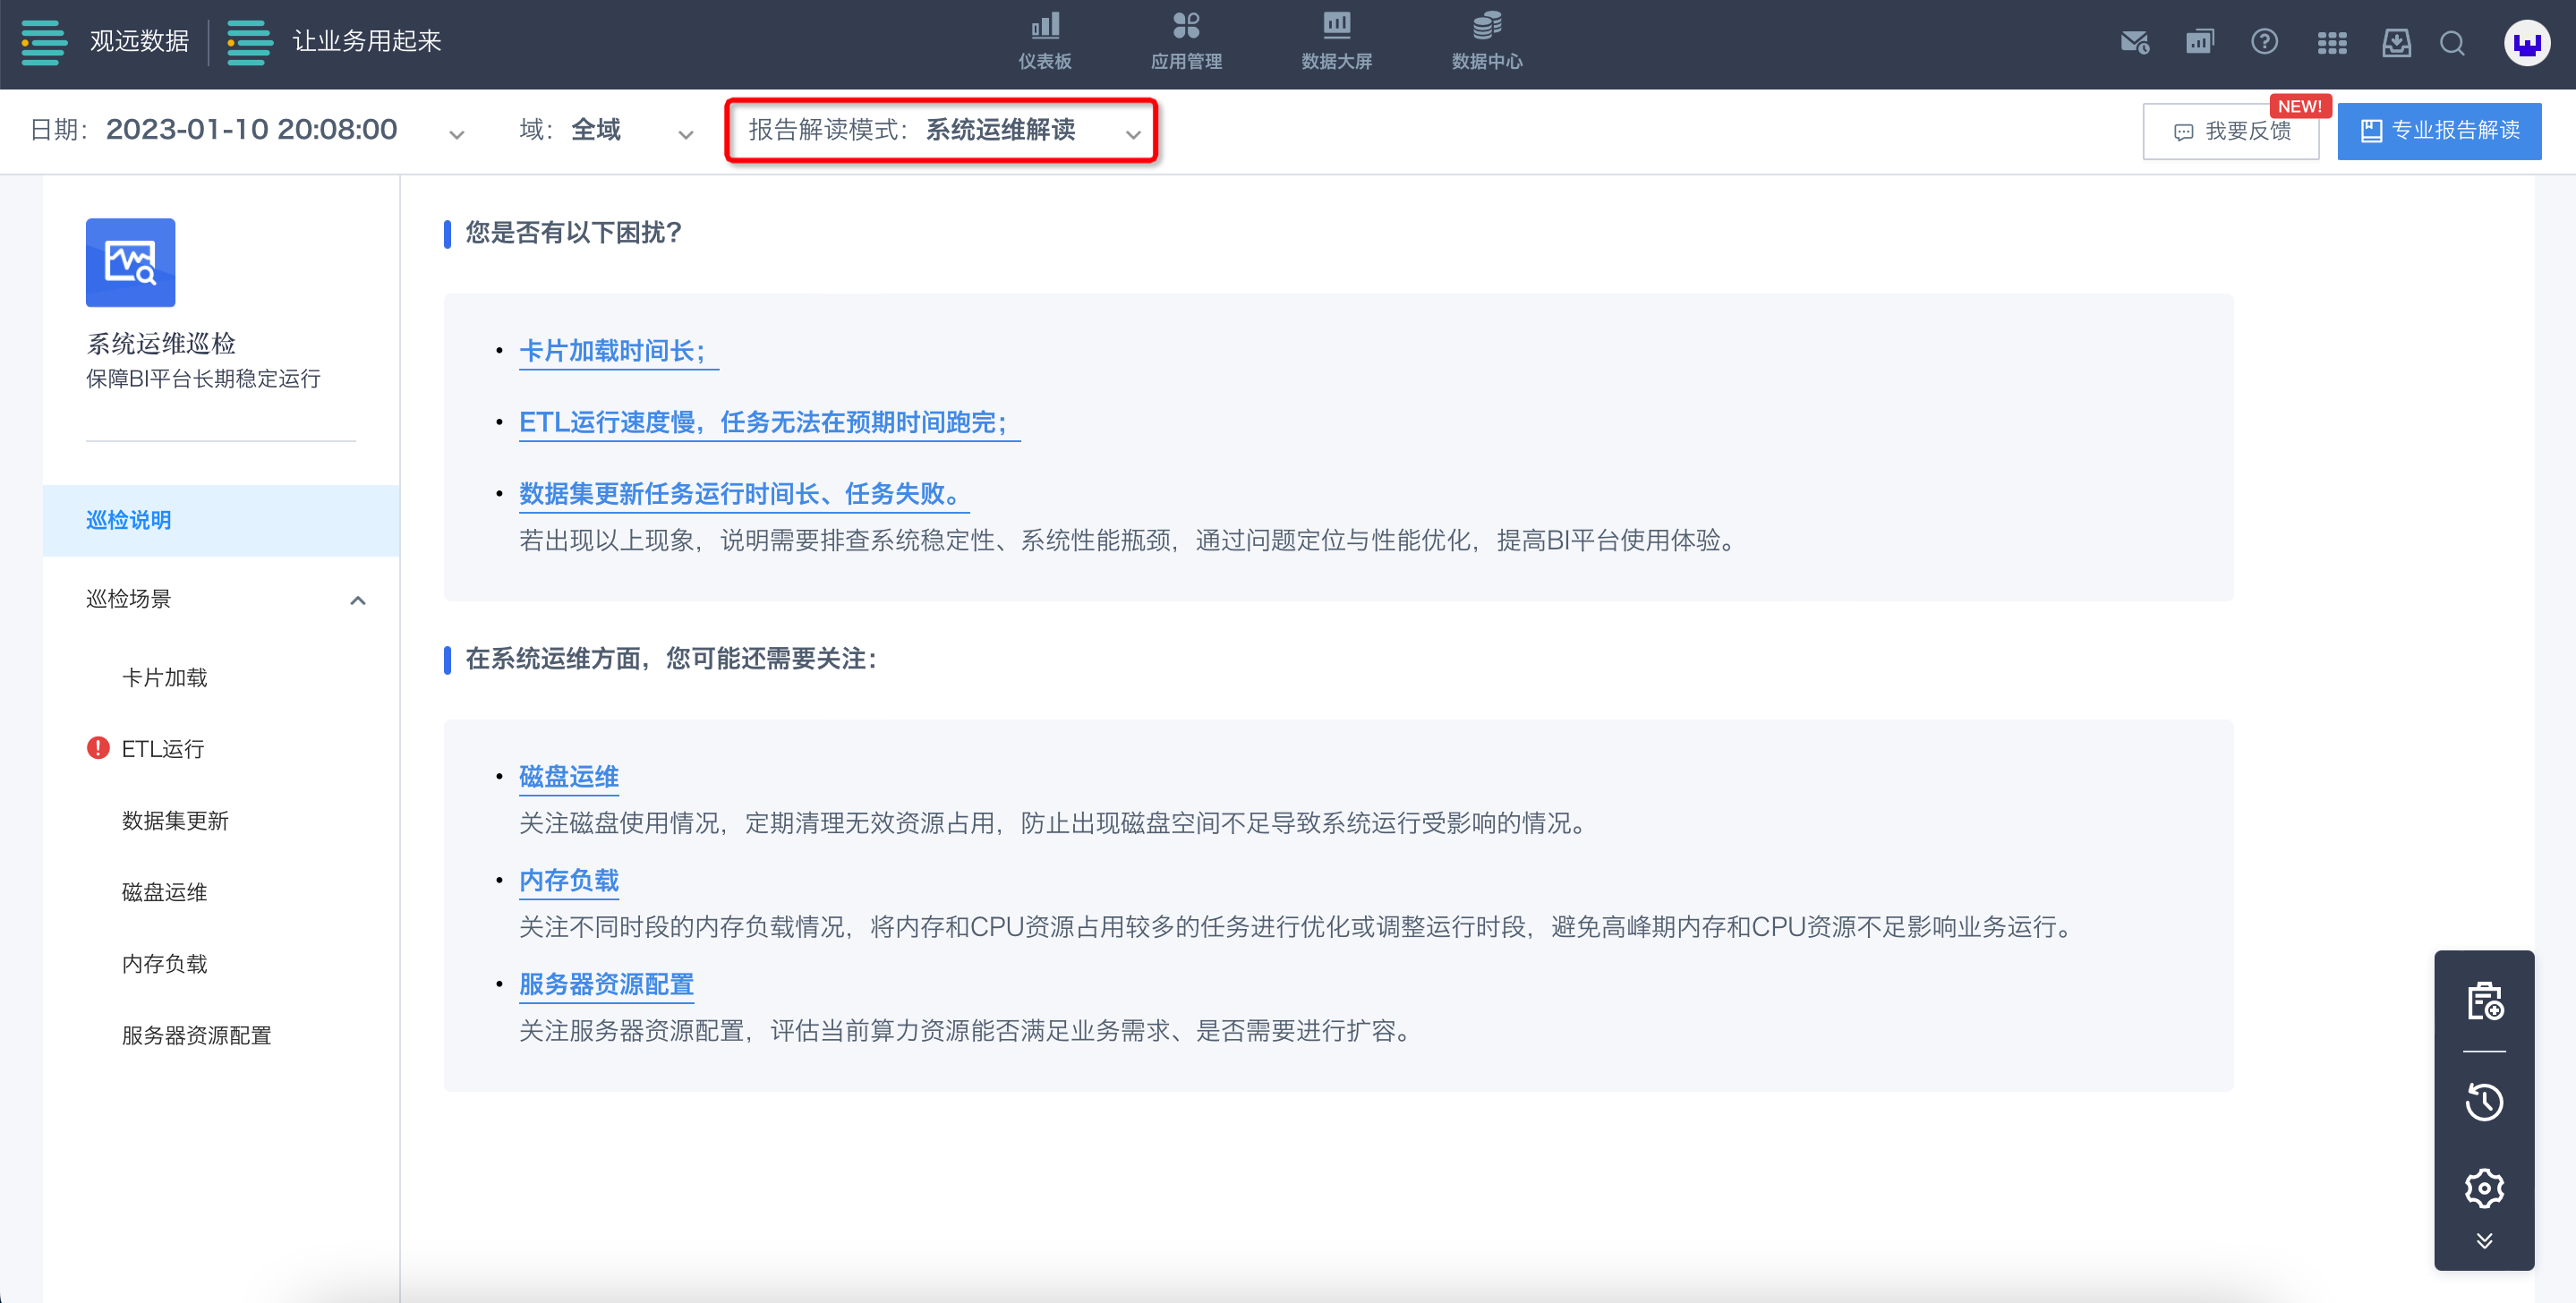
System Operations Interpretation
The system operations interpretation mode provides cause analysis, troubleshooting ideas, and action optimization recommendations for common issues in the scenario. Users can follow the guidance to view metric information, quickly jump to modify related configurations, and perform other operations.
- Experience scenarios: card loading, ETL running, and dataset update.
- Performance scenarios: disk operations, memory load, and server resource configuration.
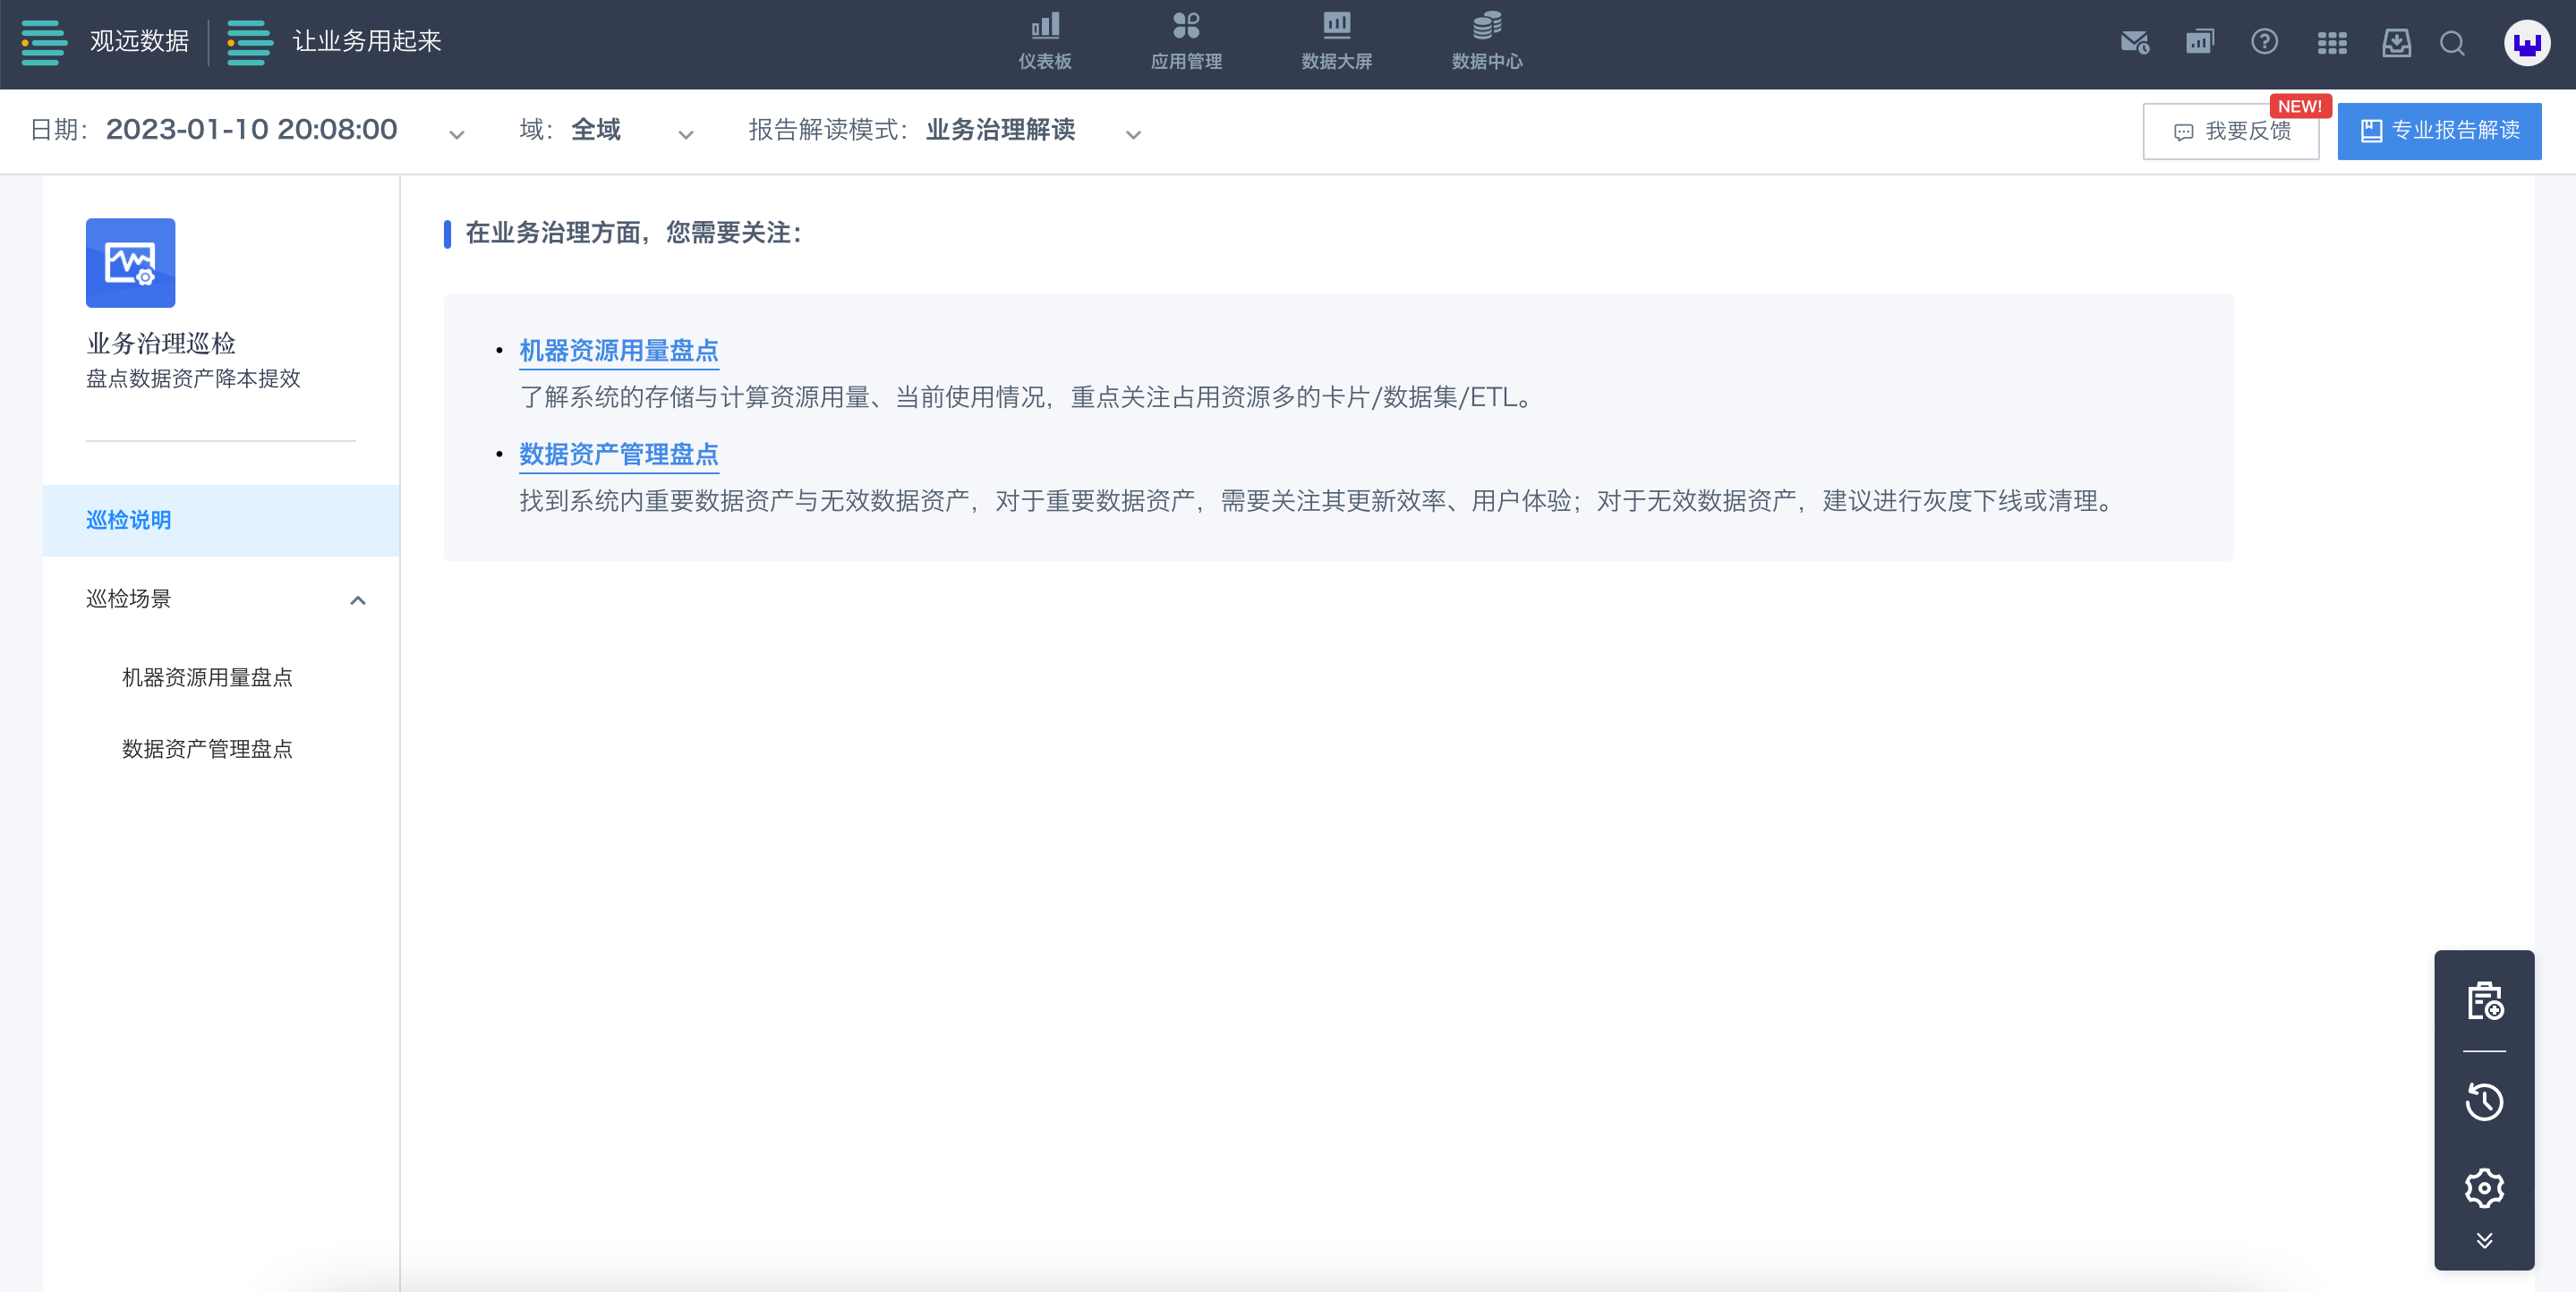
Business Governance Interpretation
Background
- System administrators need to regularly monitor data assets such as datasets, ETLs, dashboards, and cards in the system and inspect related assets:
- For unused or invalid data assets, governance actions such as phased offline removal or deletion are required.
- For data assets with heavy performance burdens, administrators need to evaluate whether governance actions are required.
- In addition, system administrators also monitor the performance of important data assets with high resource popularity to ensure the user experience in the system.
Feature Introduction
The business governance interpretation mode is mainly divided into machine resource usage inventory and data asset management inventory. It provides inventory ideas and action optimization recommendations for the system resources consumed and business value generated by datasets, ETLs, dashboards, and cards.
System administrators can follow the provided ideas to view metric information, understand resource occupation and usage of data assets in the platform, focus on corresponding assets, optimize as needed, and better manage the BI platform.
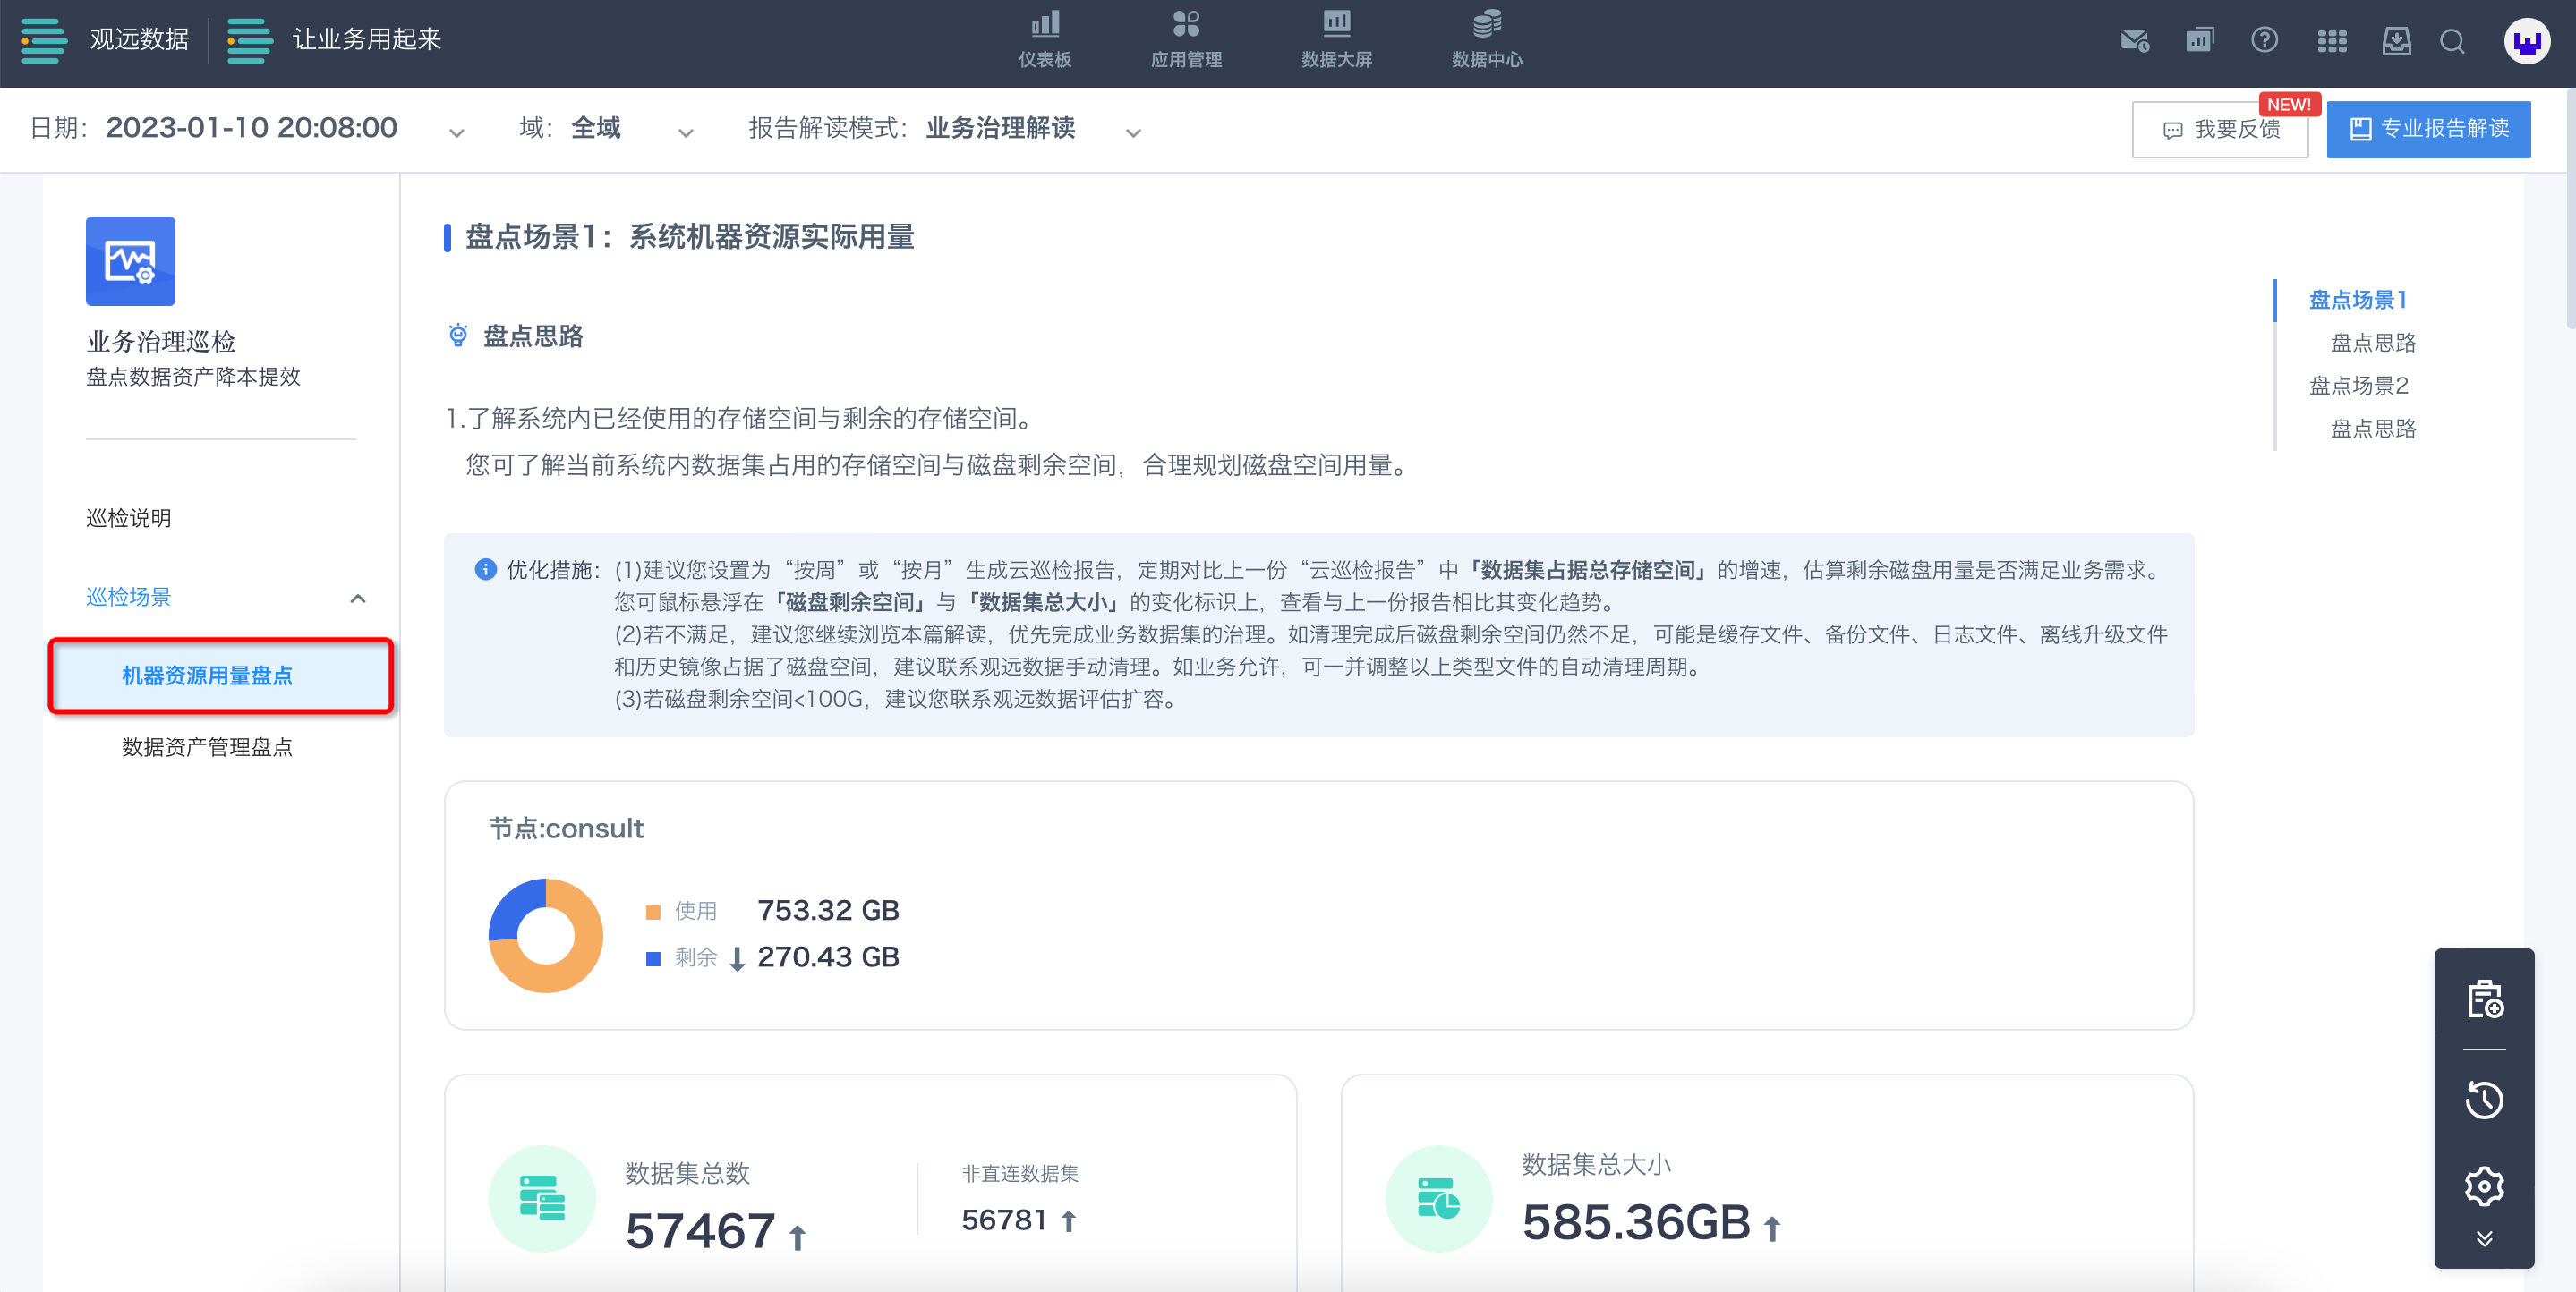
- Machine Resource Usage Inventory
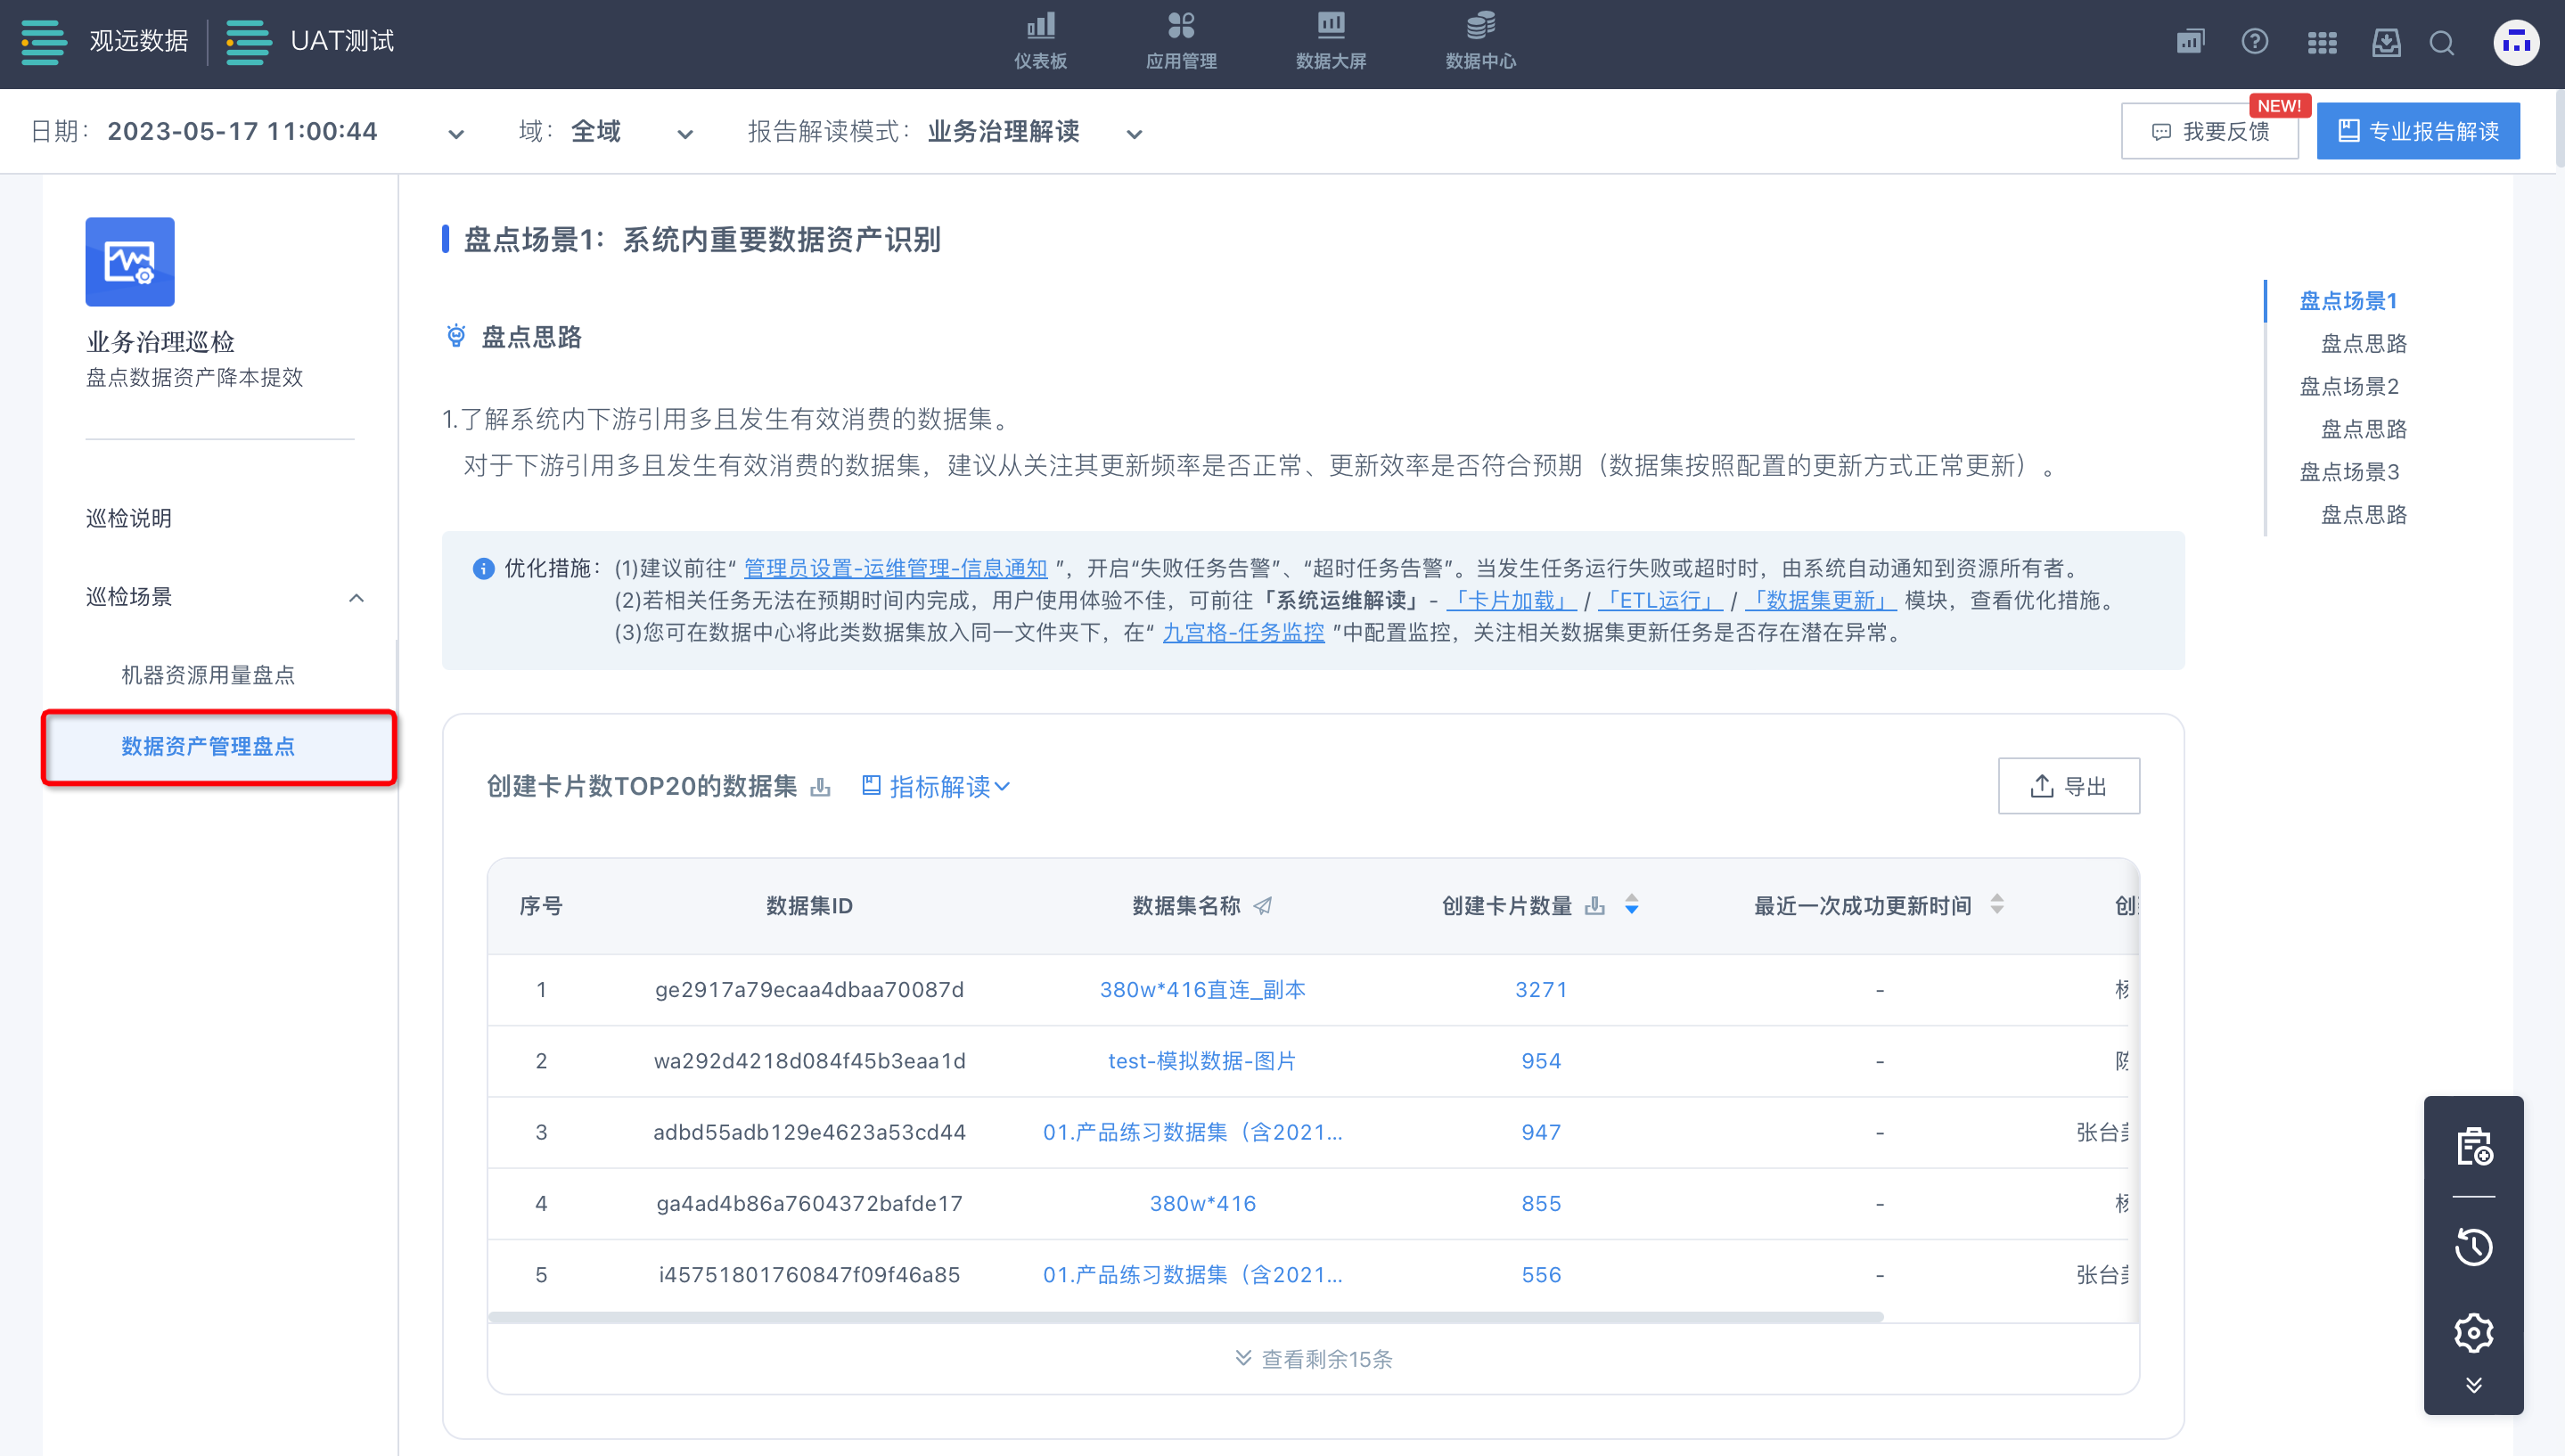
- Data Asset Management Inventory
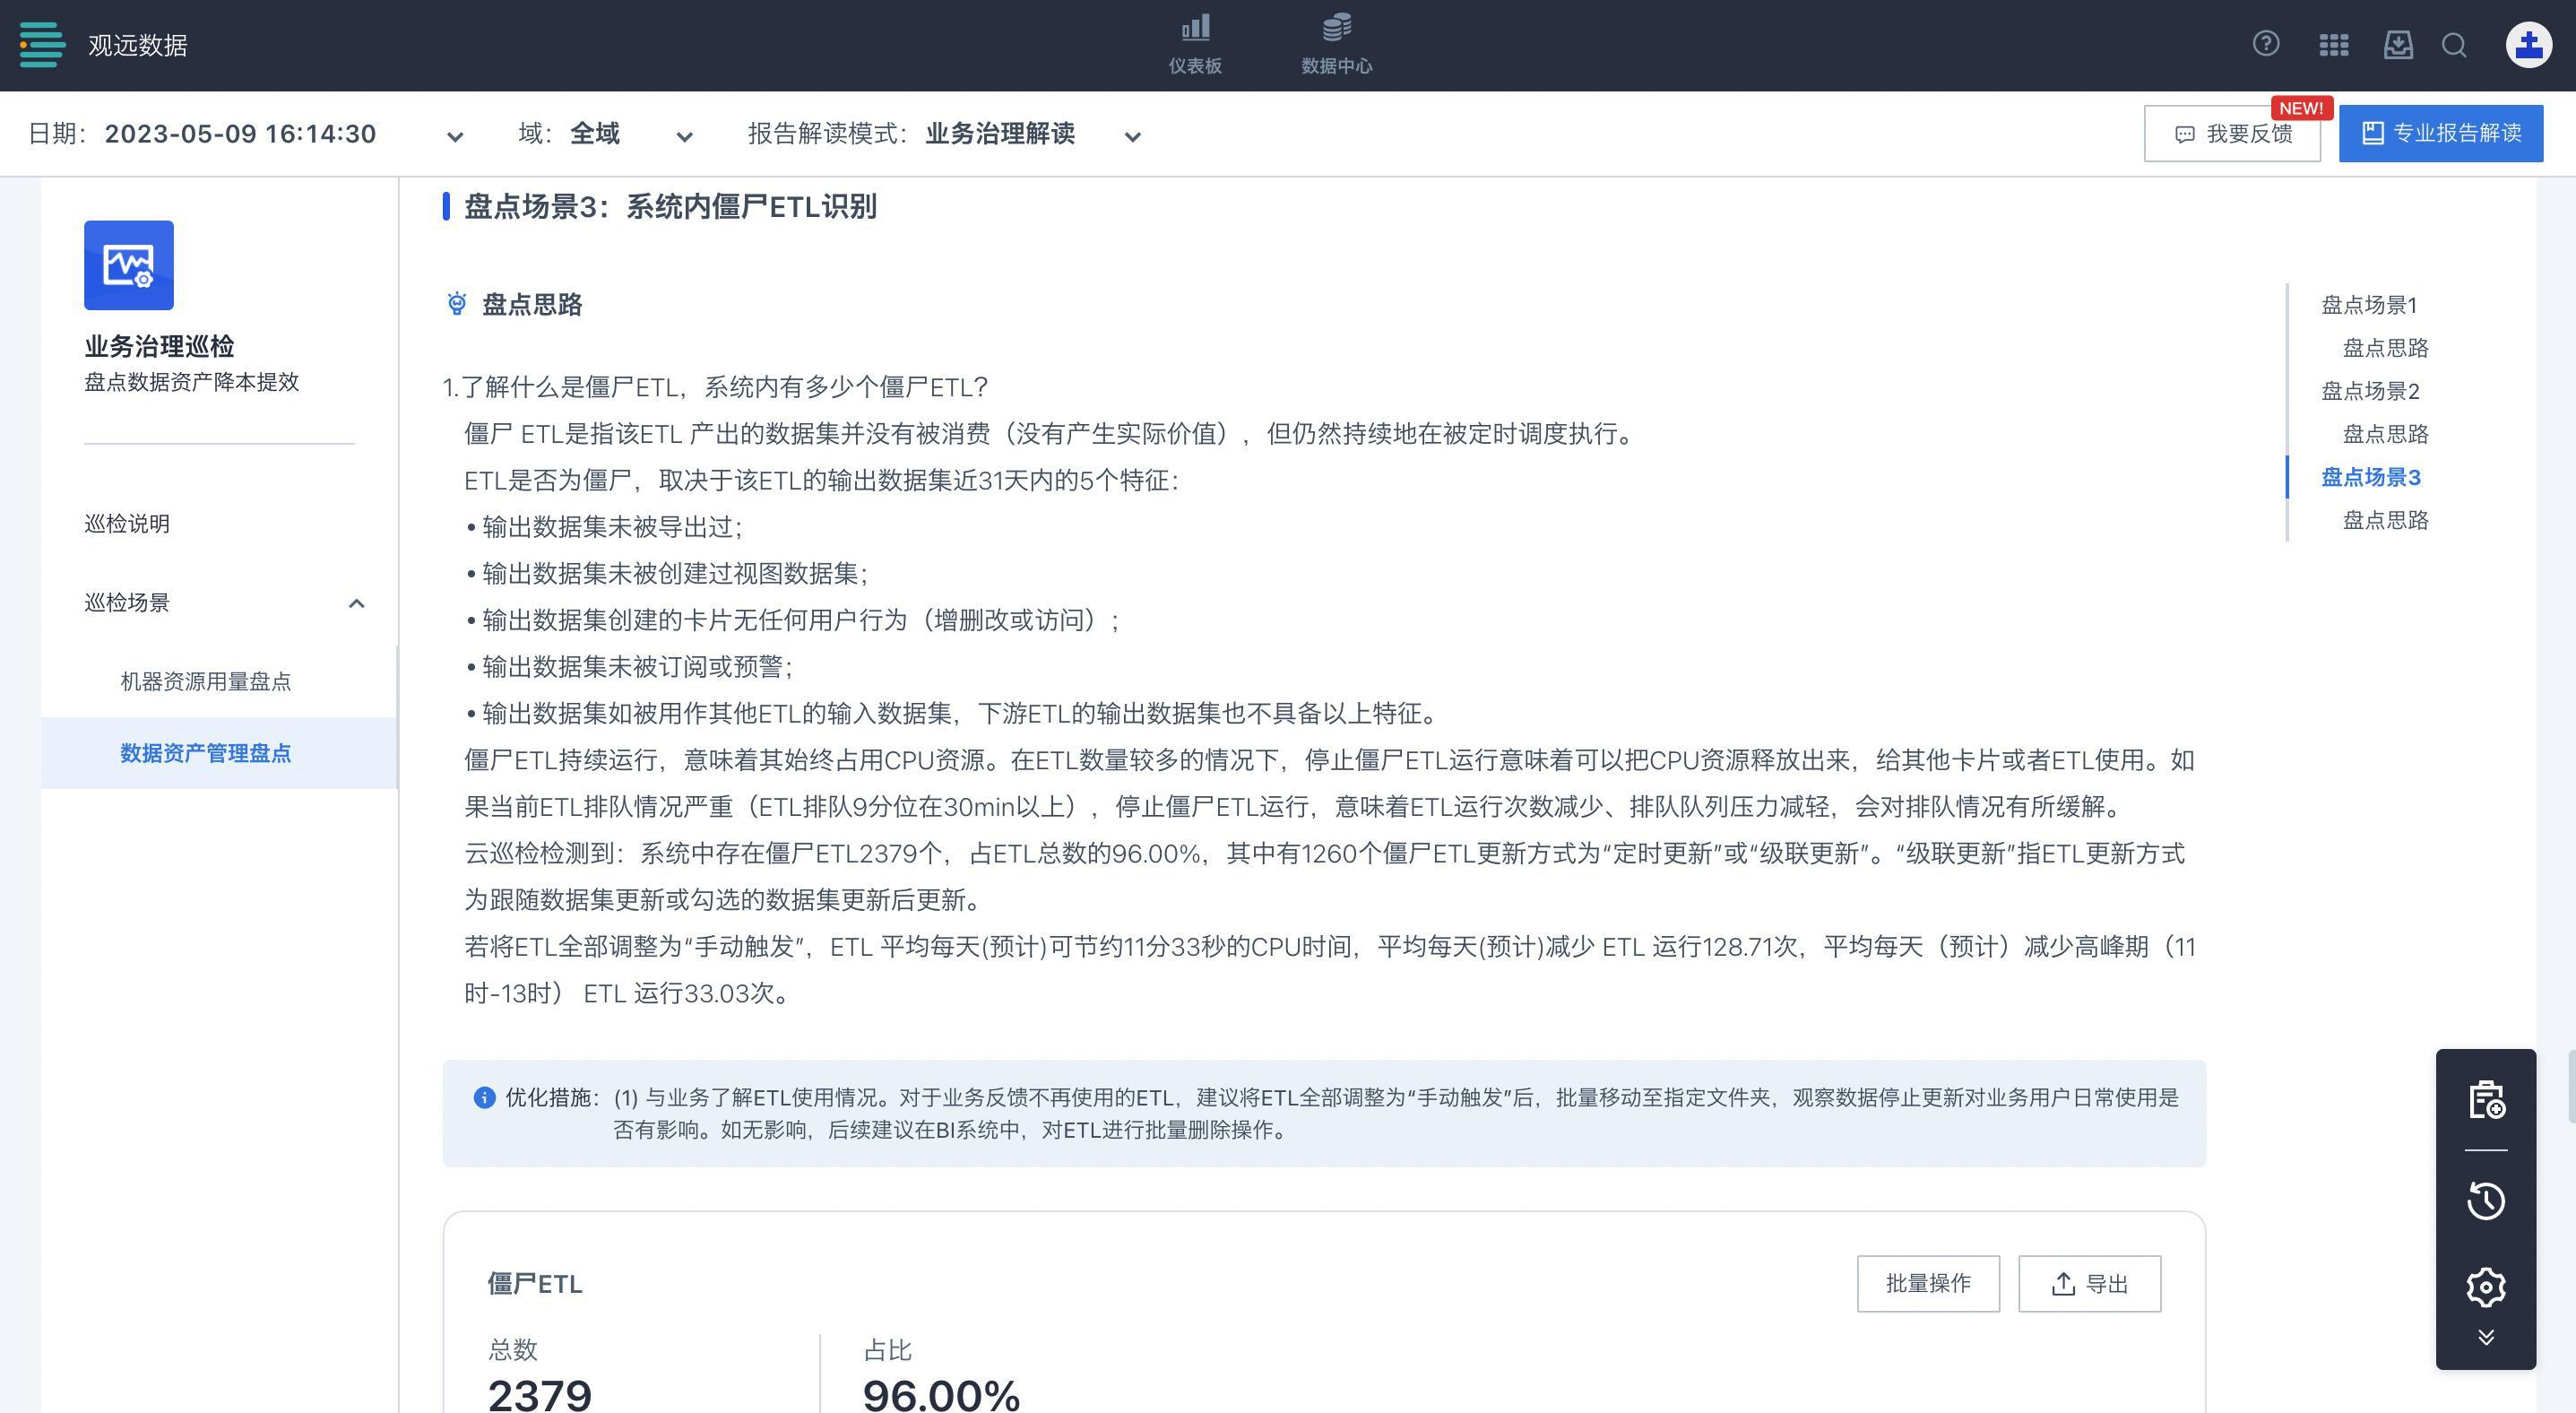
Inventory Scenario 3: Zombie ETL Identification in the System
In large-scale user scenarios, some typical BI usage patterns can be optimized. In this module, users can identify ETLs that continue to run after creation but whose generated datasets and cards have not created value.
By tracing the full governance chain from ETL to dataset to card, users can quickly and conveniently govern zombie ETLs through the batch operation features provided by Cloud Inspection, saving computing resources and improving performance.
Note: If you need this feature, contact your Guandata representative.
Report Update Method
Obtain a Cloud Inspection Report
Click Get Latest Report in the action bar at the lower-right corner of the Cloud Inspection page. After a short wait, the latest report content is usually displayed on the page.
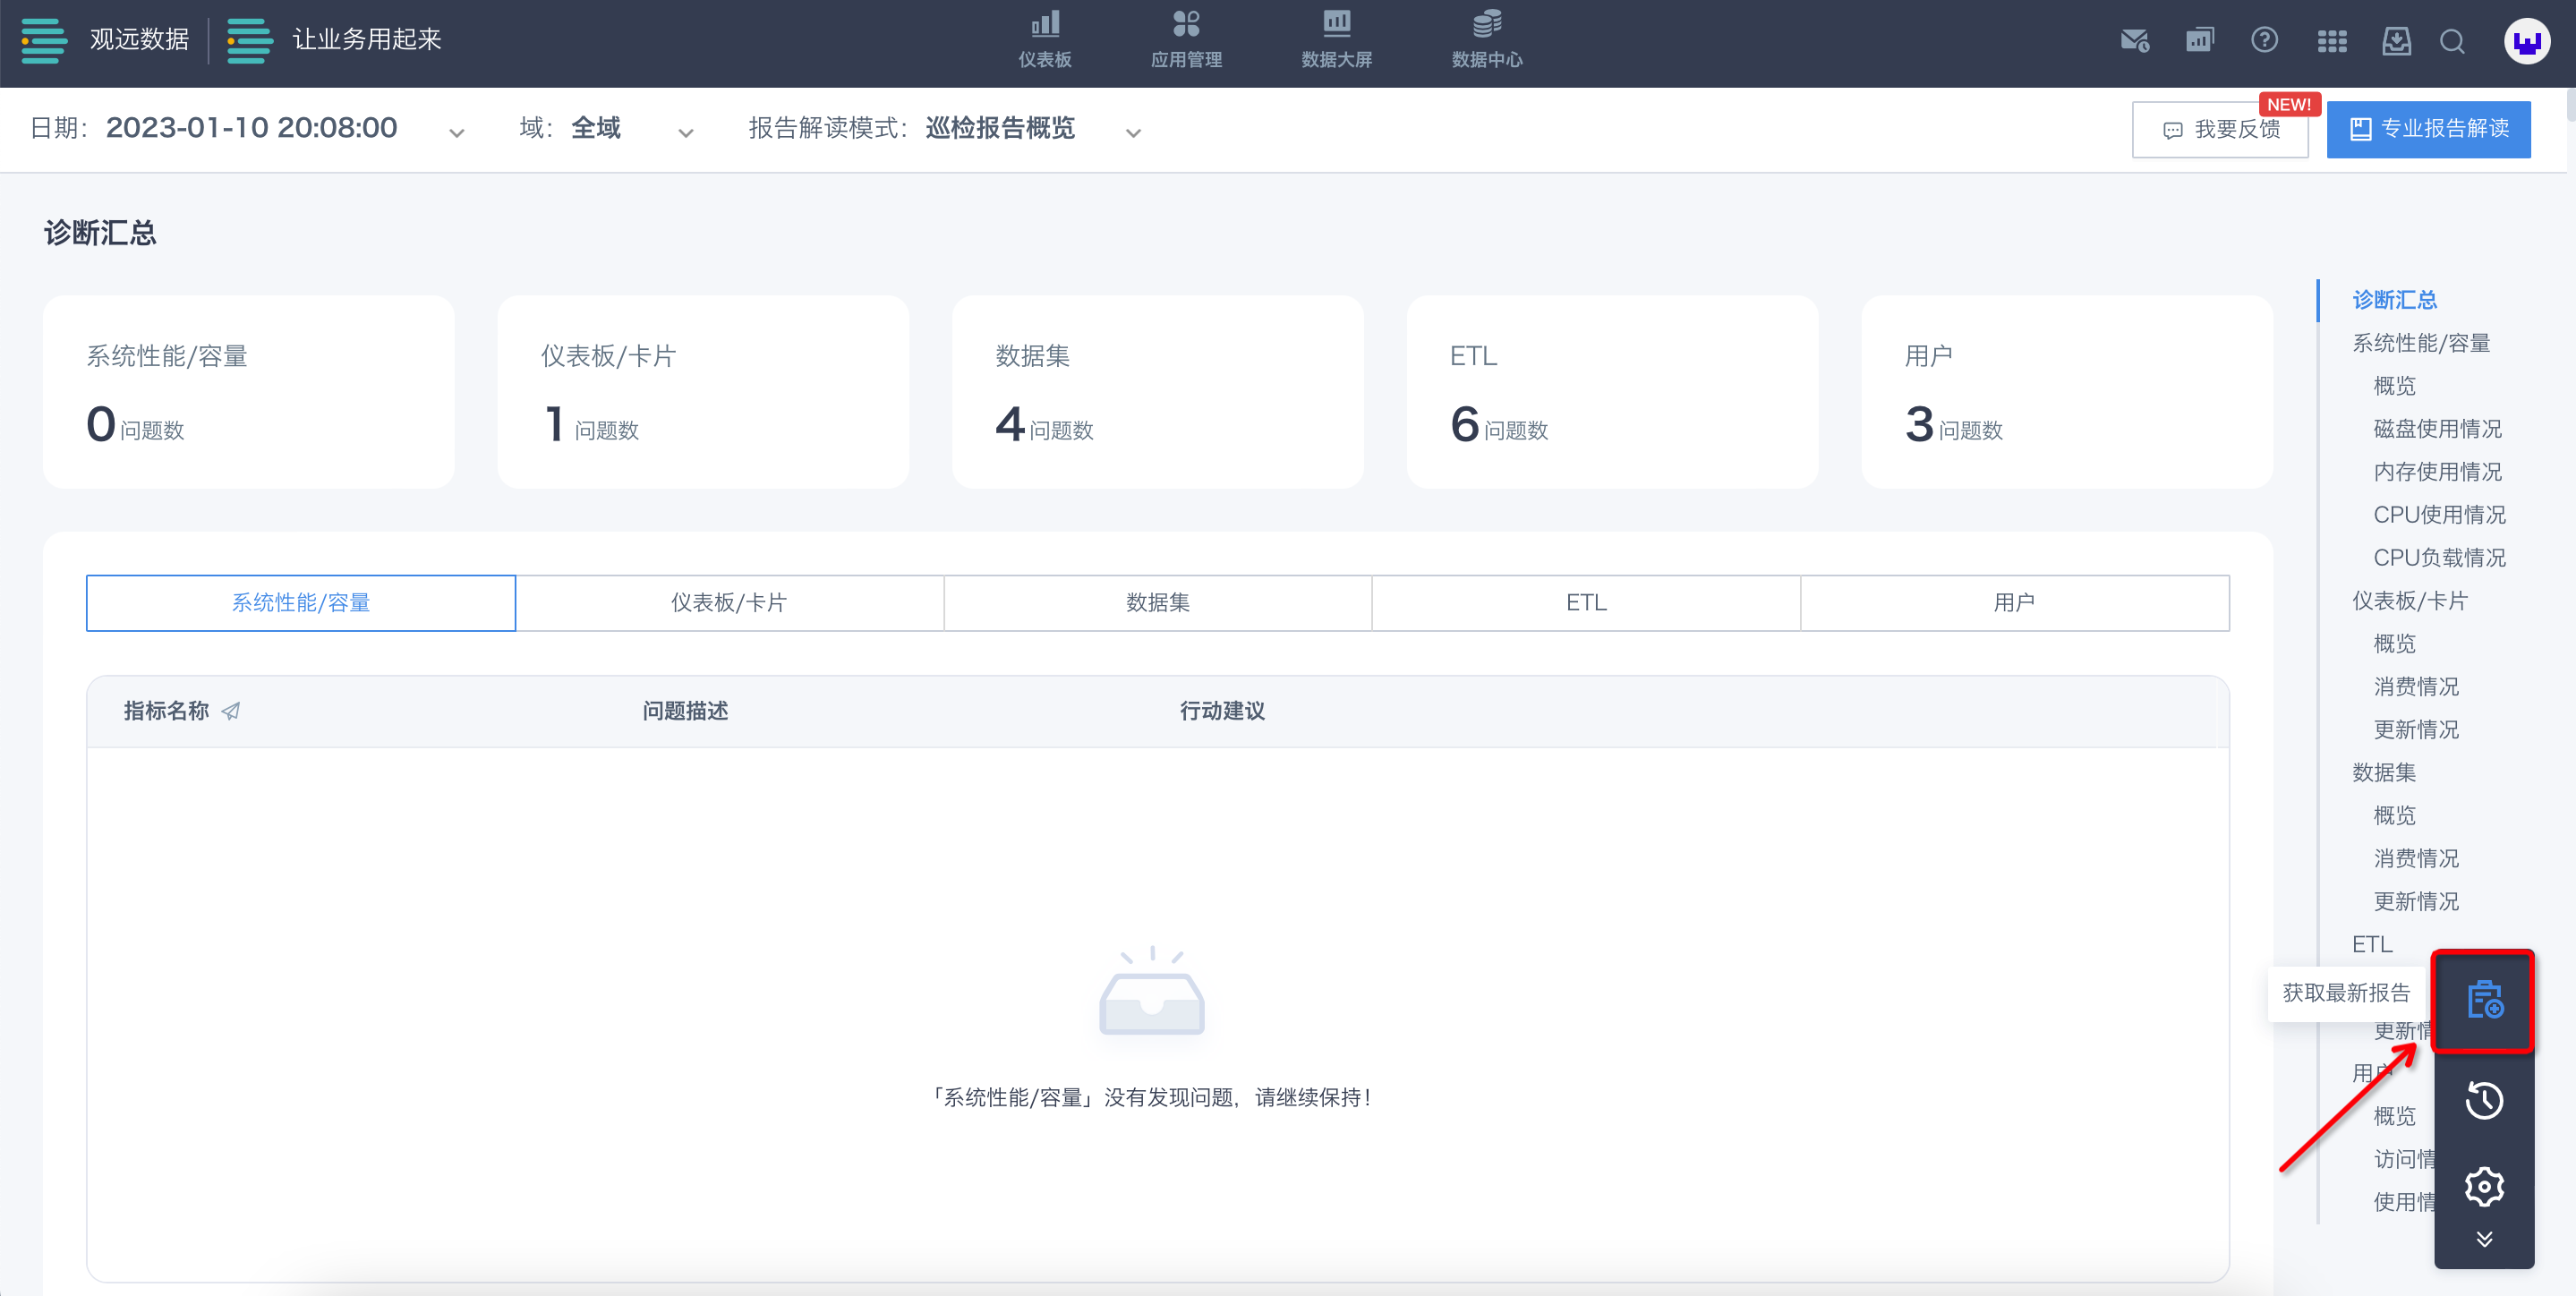
On the report content page, the system performs automatic inspection based on the manually obtained time point and the system running data from the last 30 days, counting backward 30 days from the previous day. After inspection is complete, scroll down to view details.
Update Method Settings
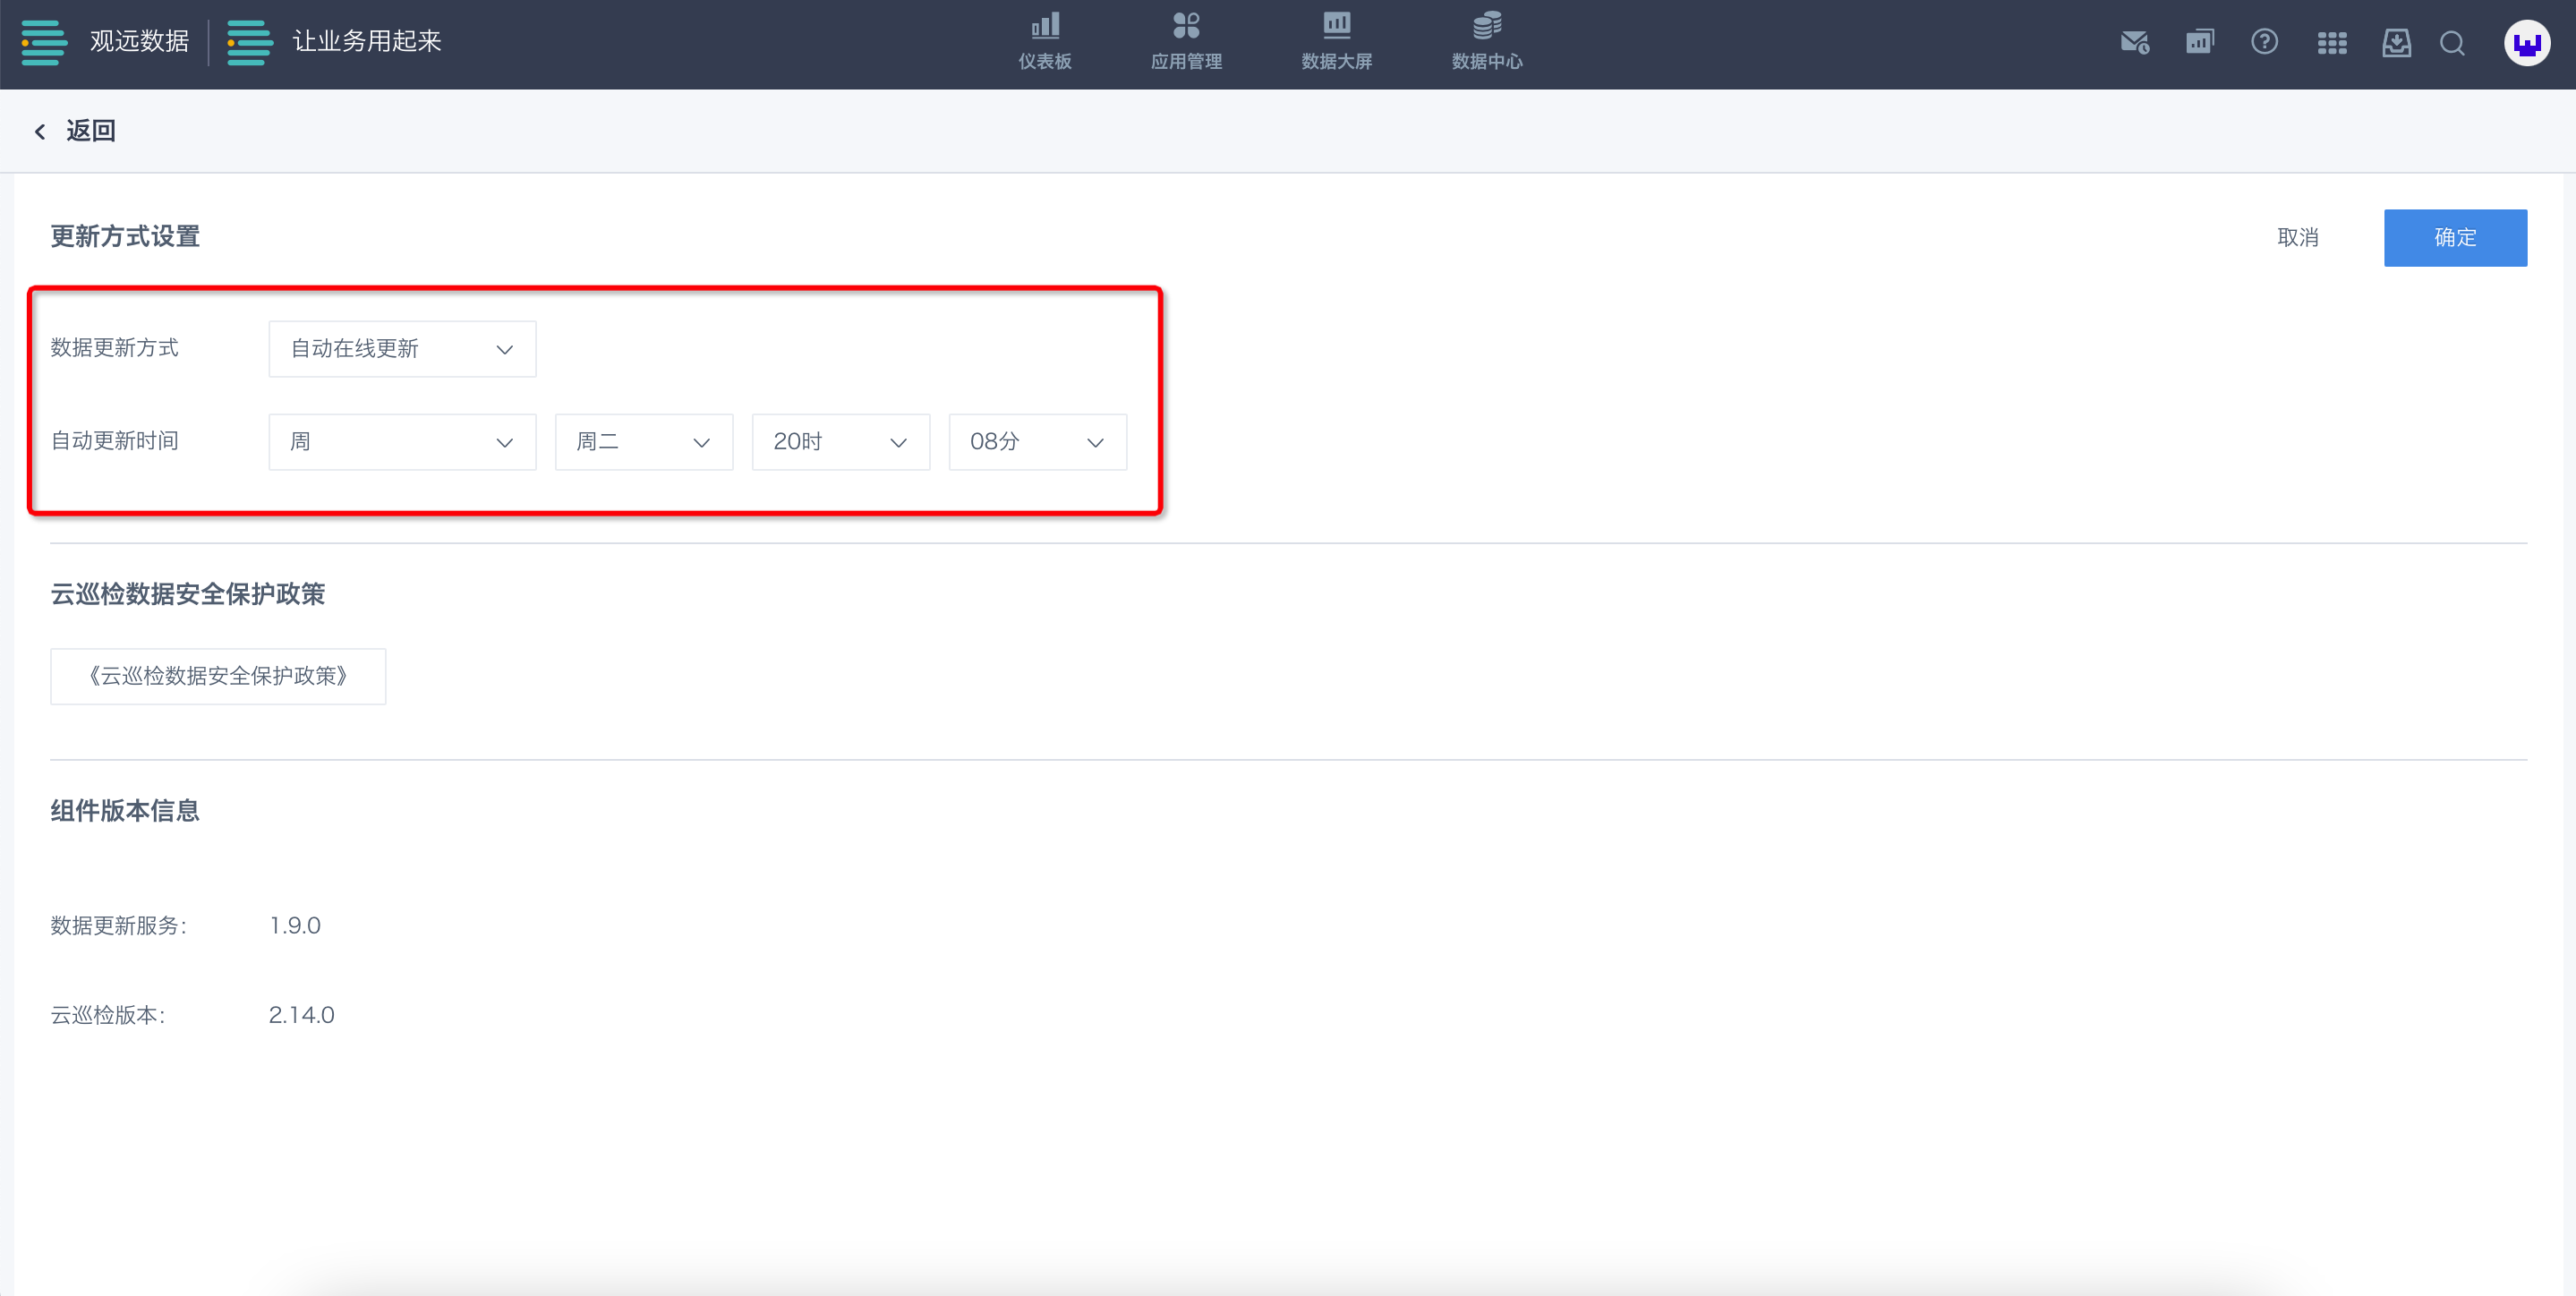
Click Settings in the action bar at the lower-right corner of the Cloud Inspection page to open the settings page.
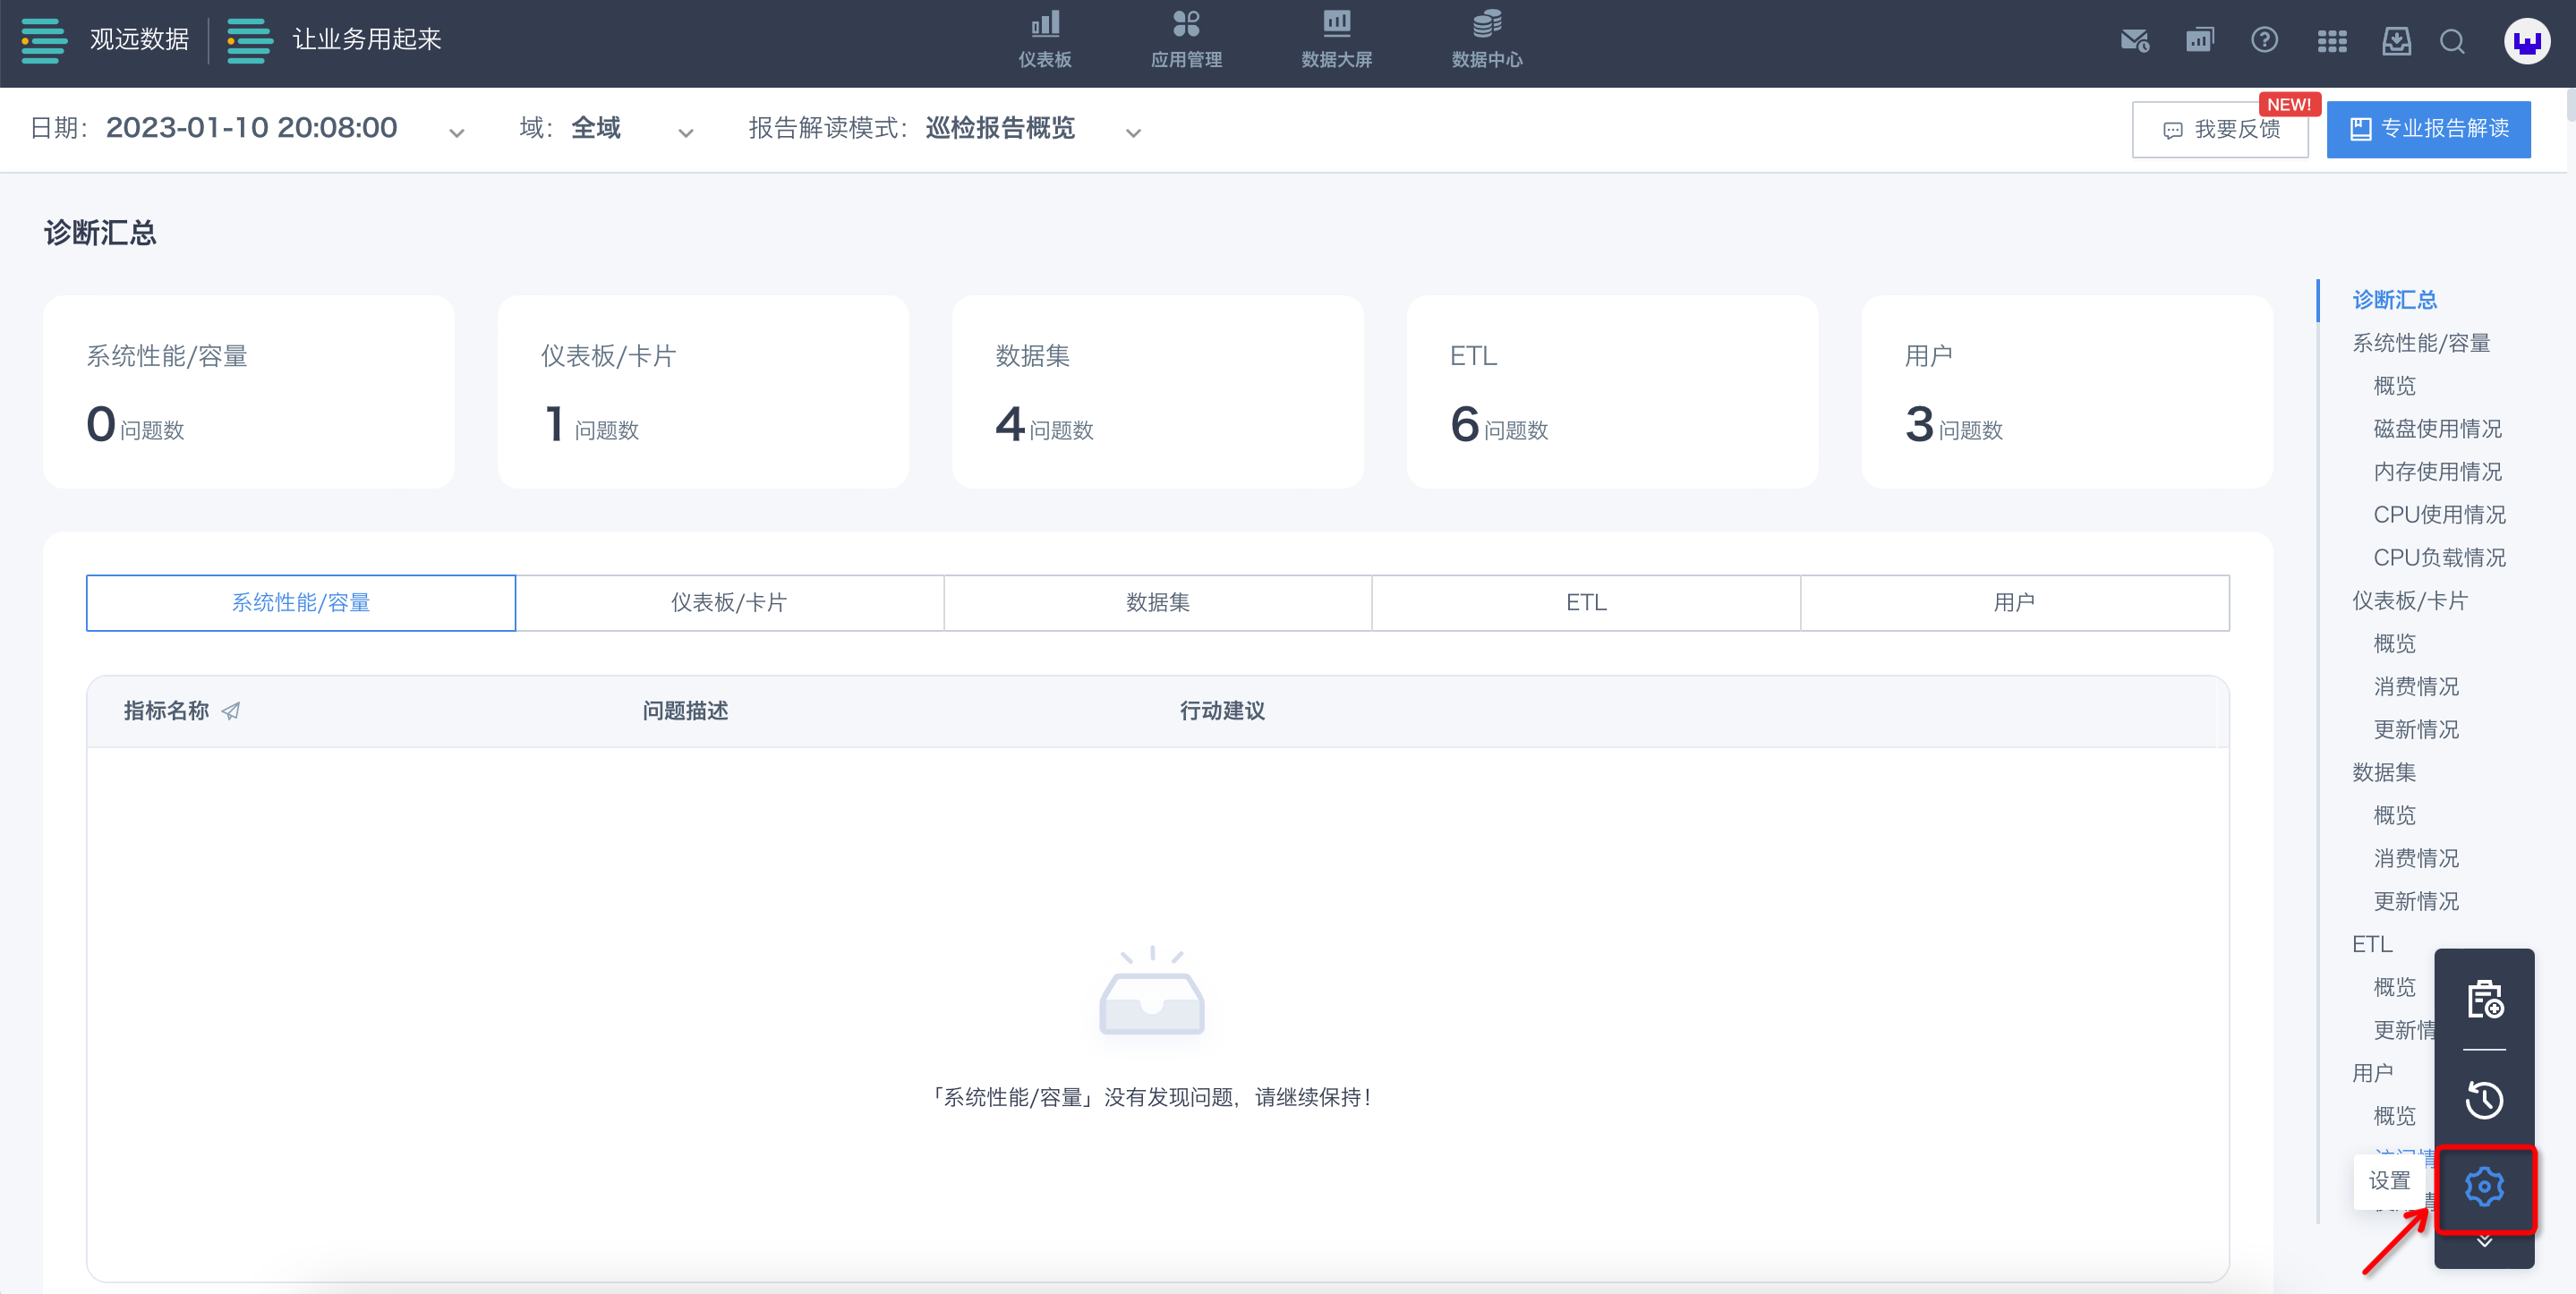
You can select Manual Online Update or Automatic Online Update. If Automatic Online Update is selected, you can set the exact time down to the minute.
View Cloud Inspection Report History
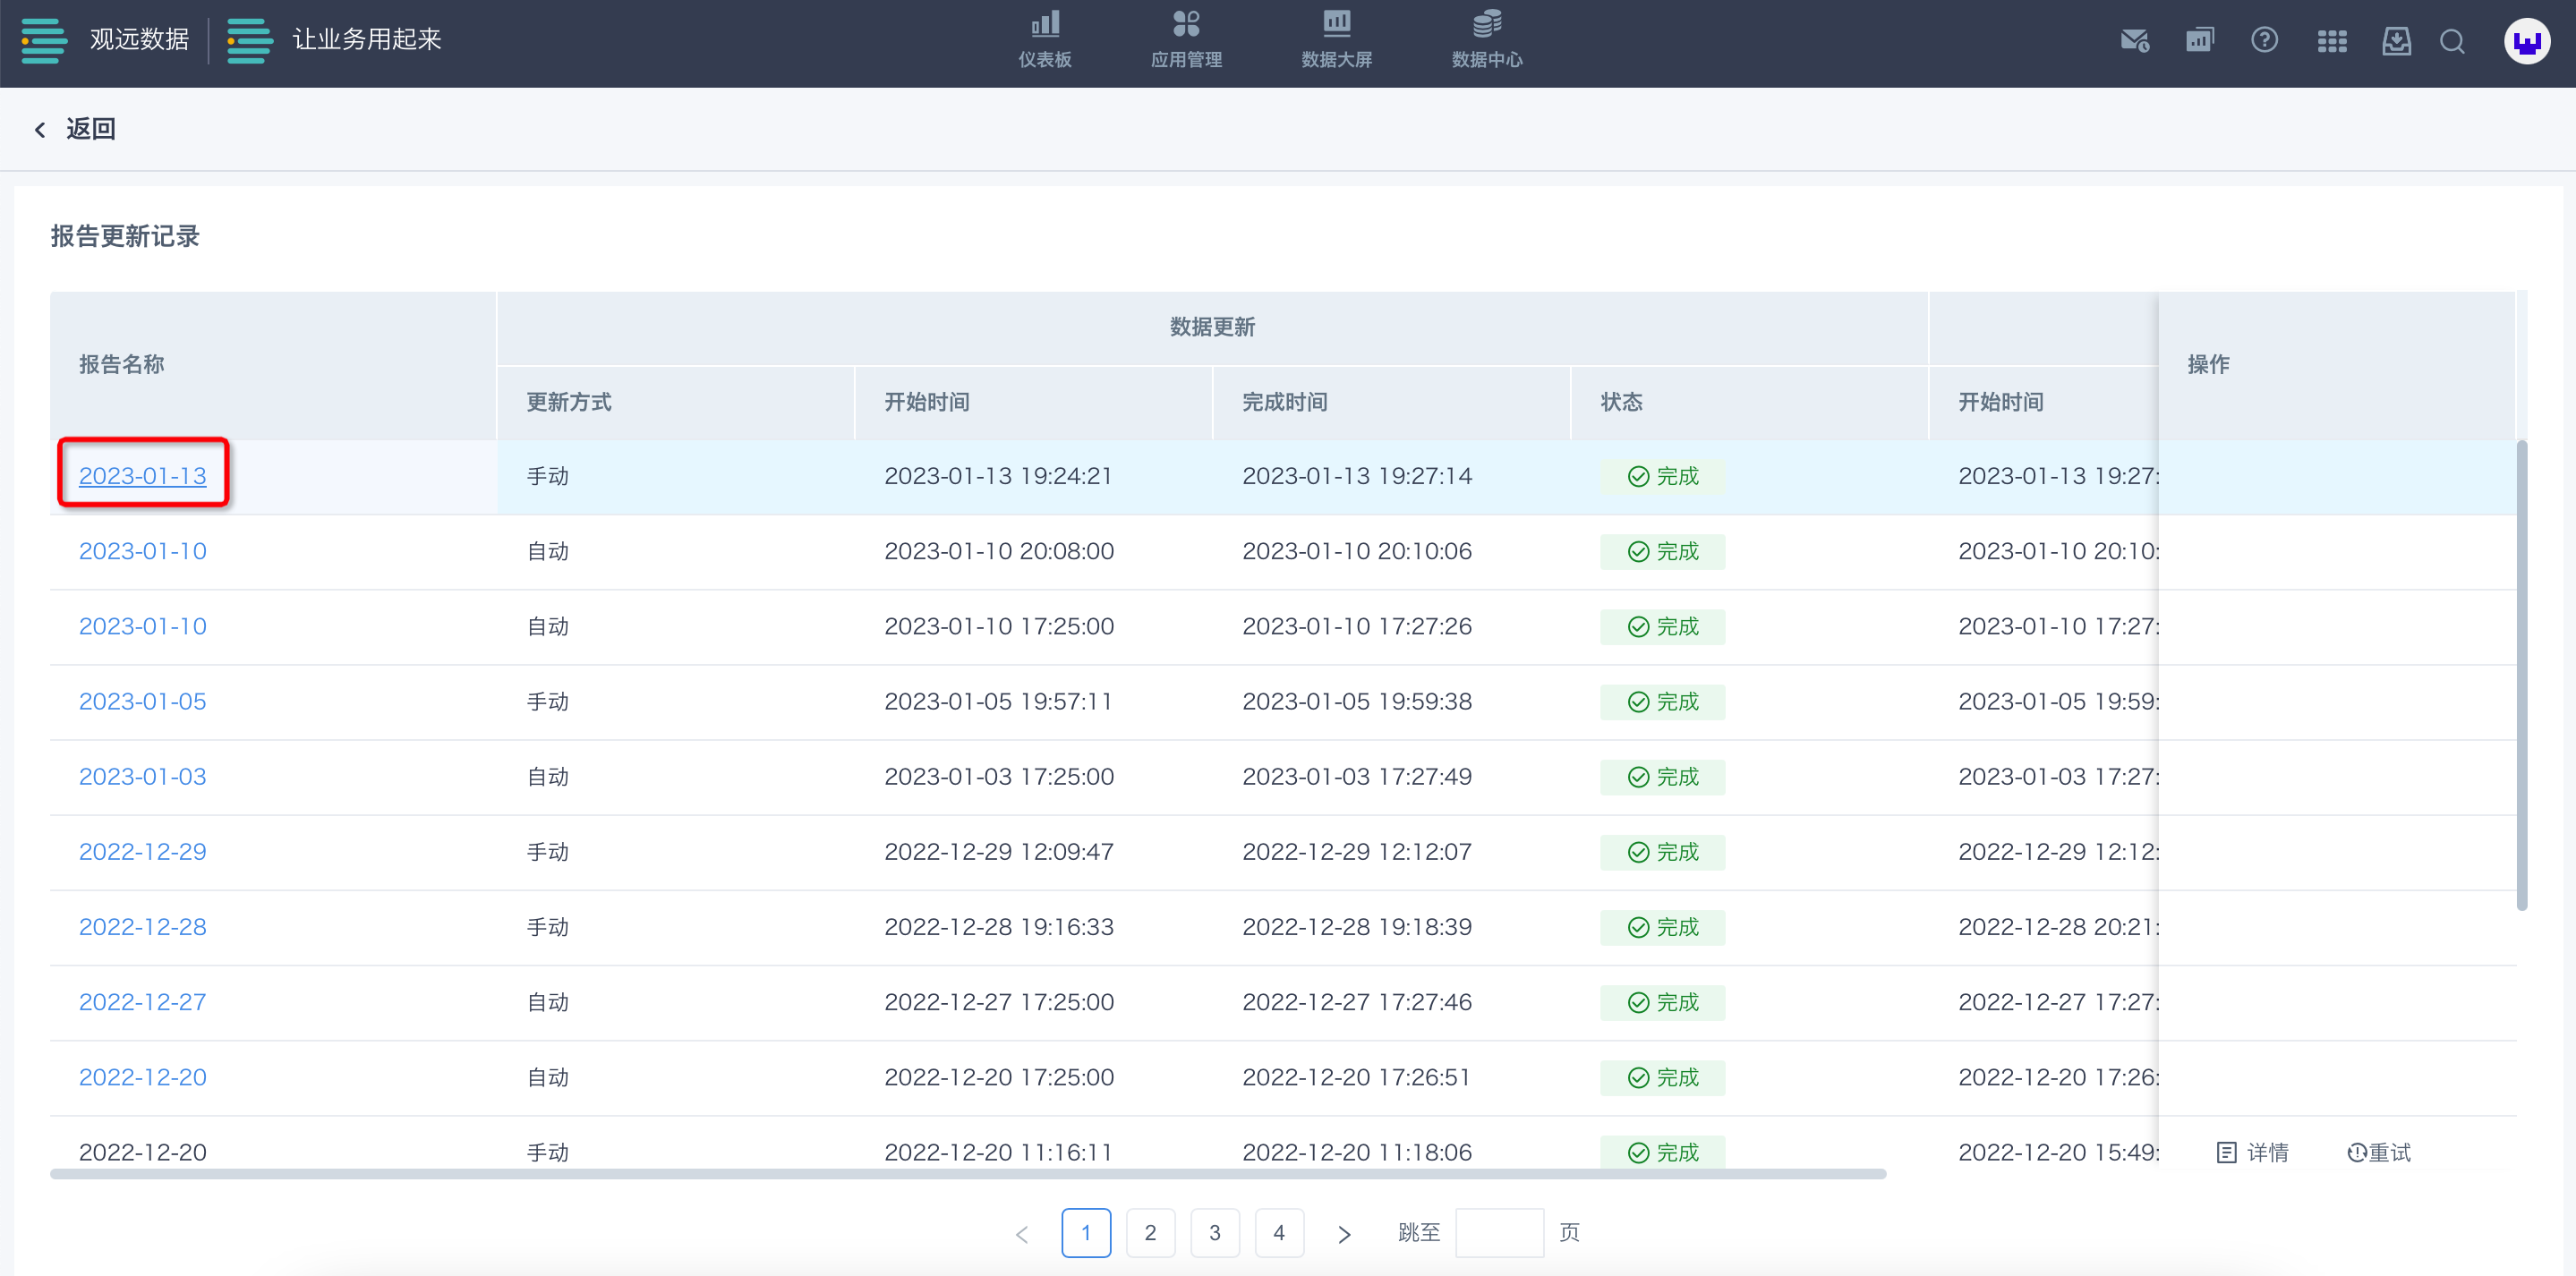
Click Update Records in the action bar at the lower-right corner of the Cloud Inspection page to open the update records page and view the update history list.
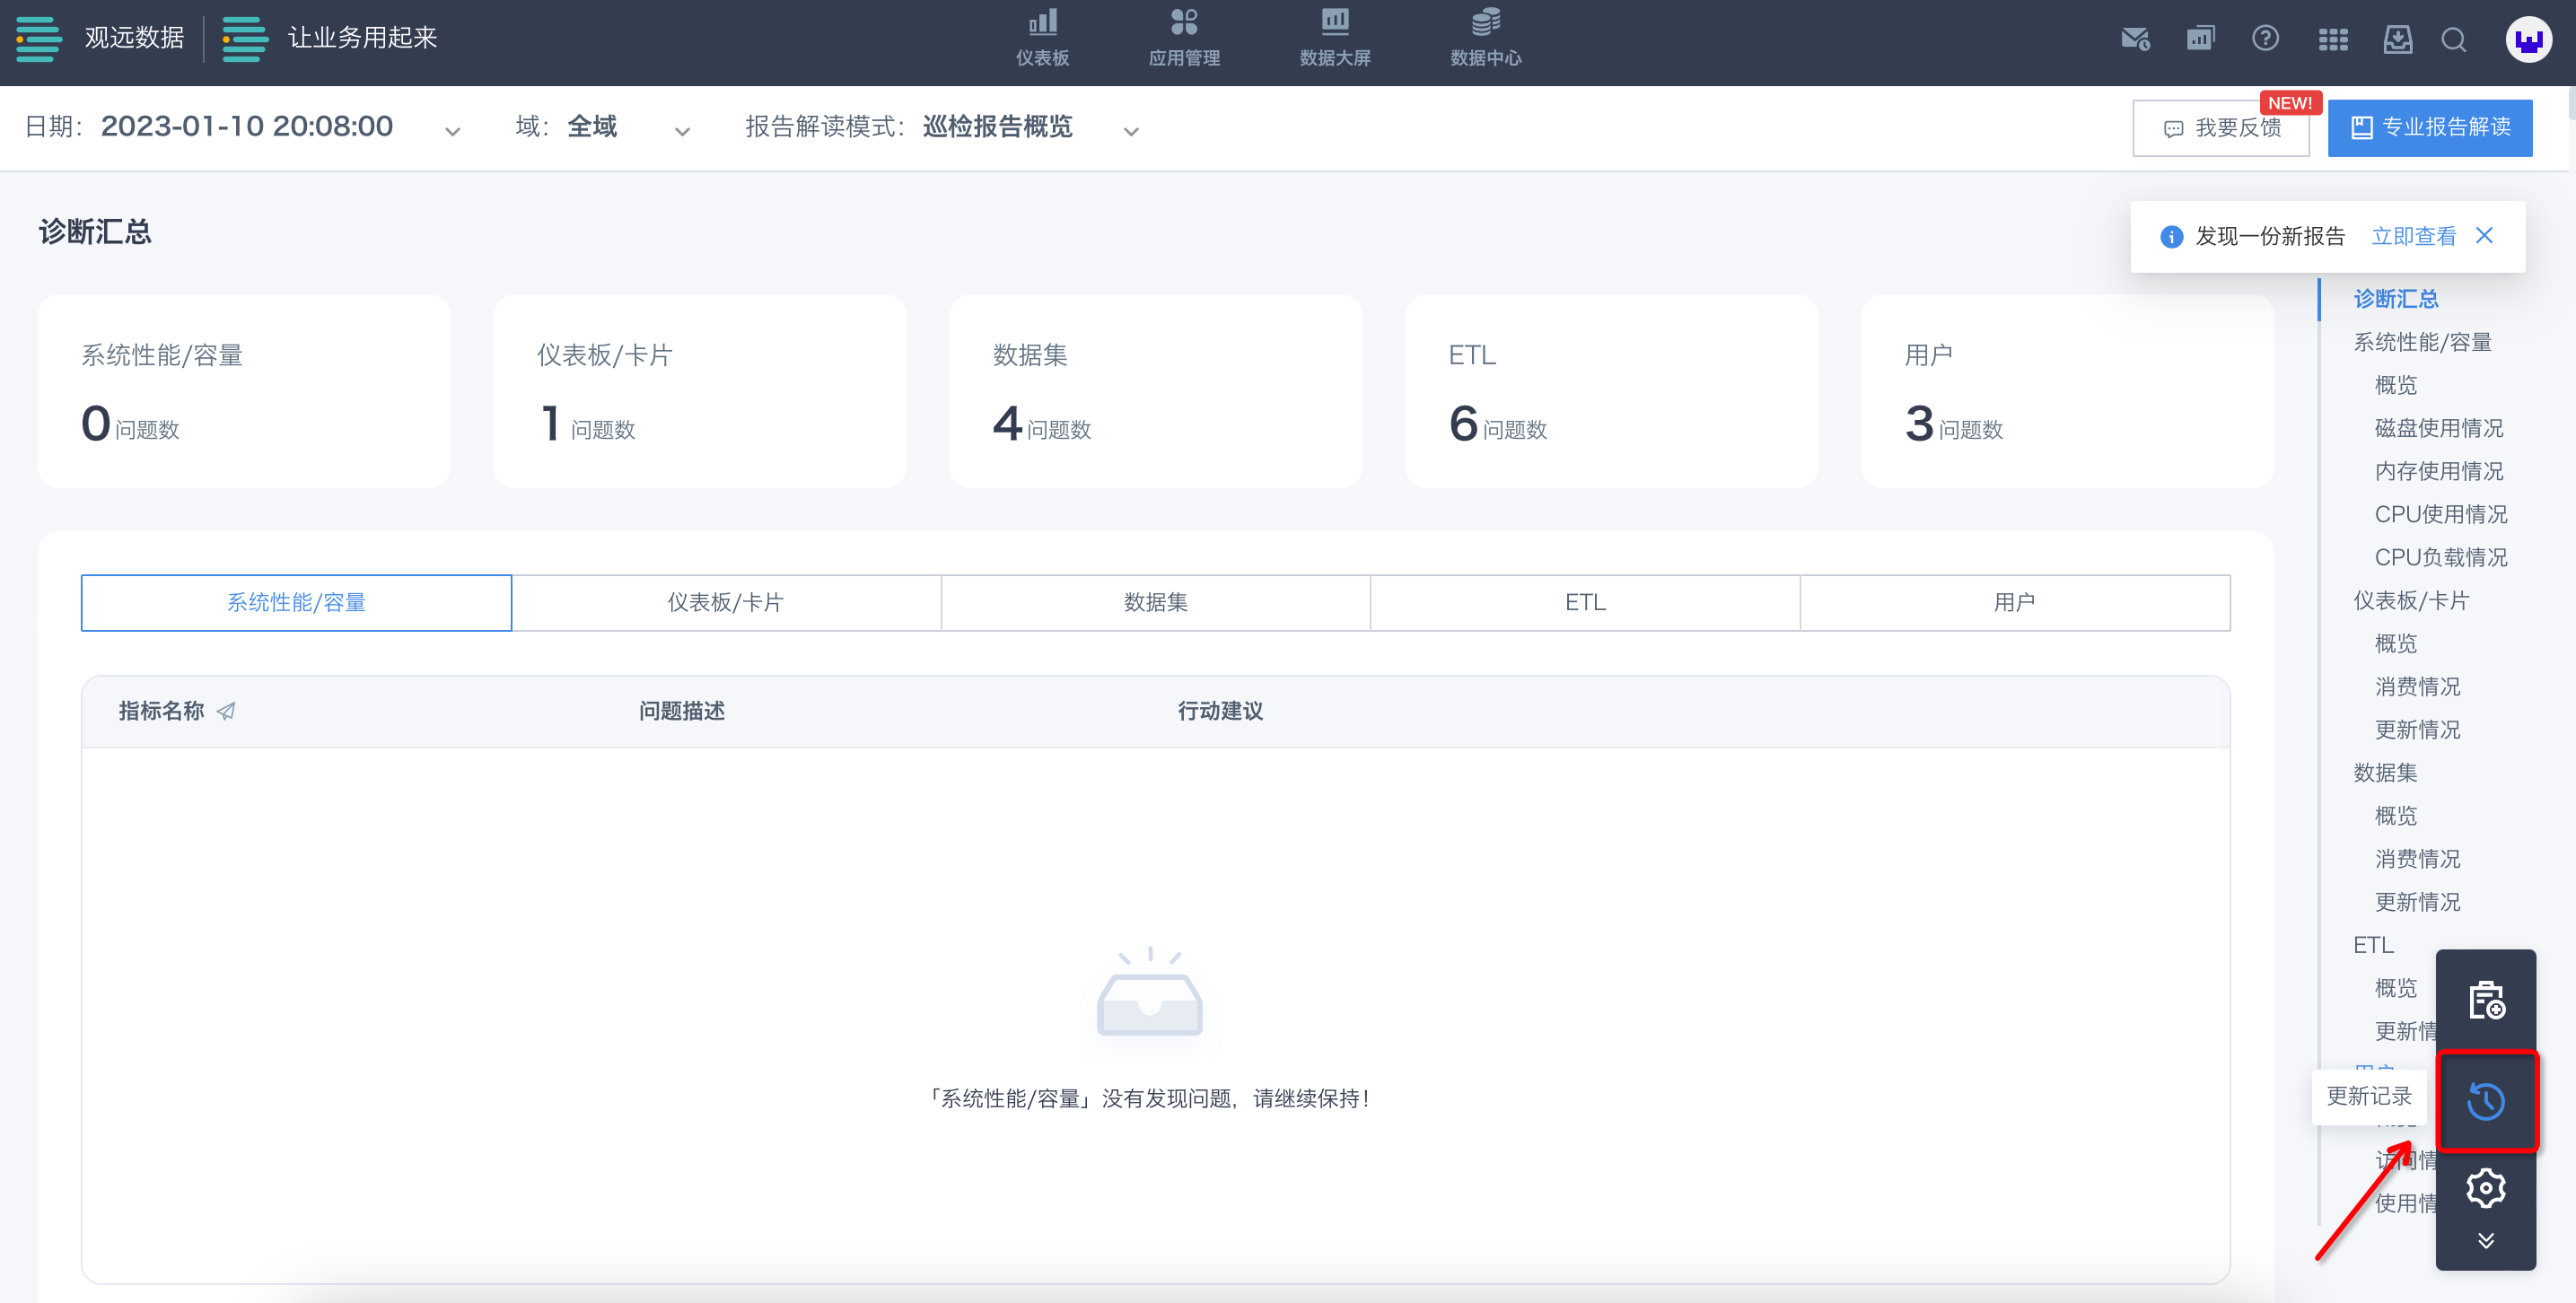
In the update records list, click a specific report name in the first column, Report Name, to open the report details page.
Share and Interpret Cloud Inspection Reports
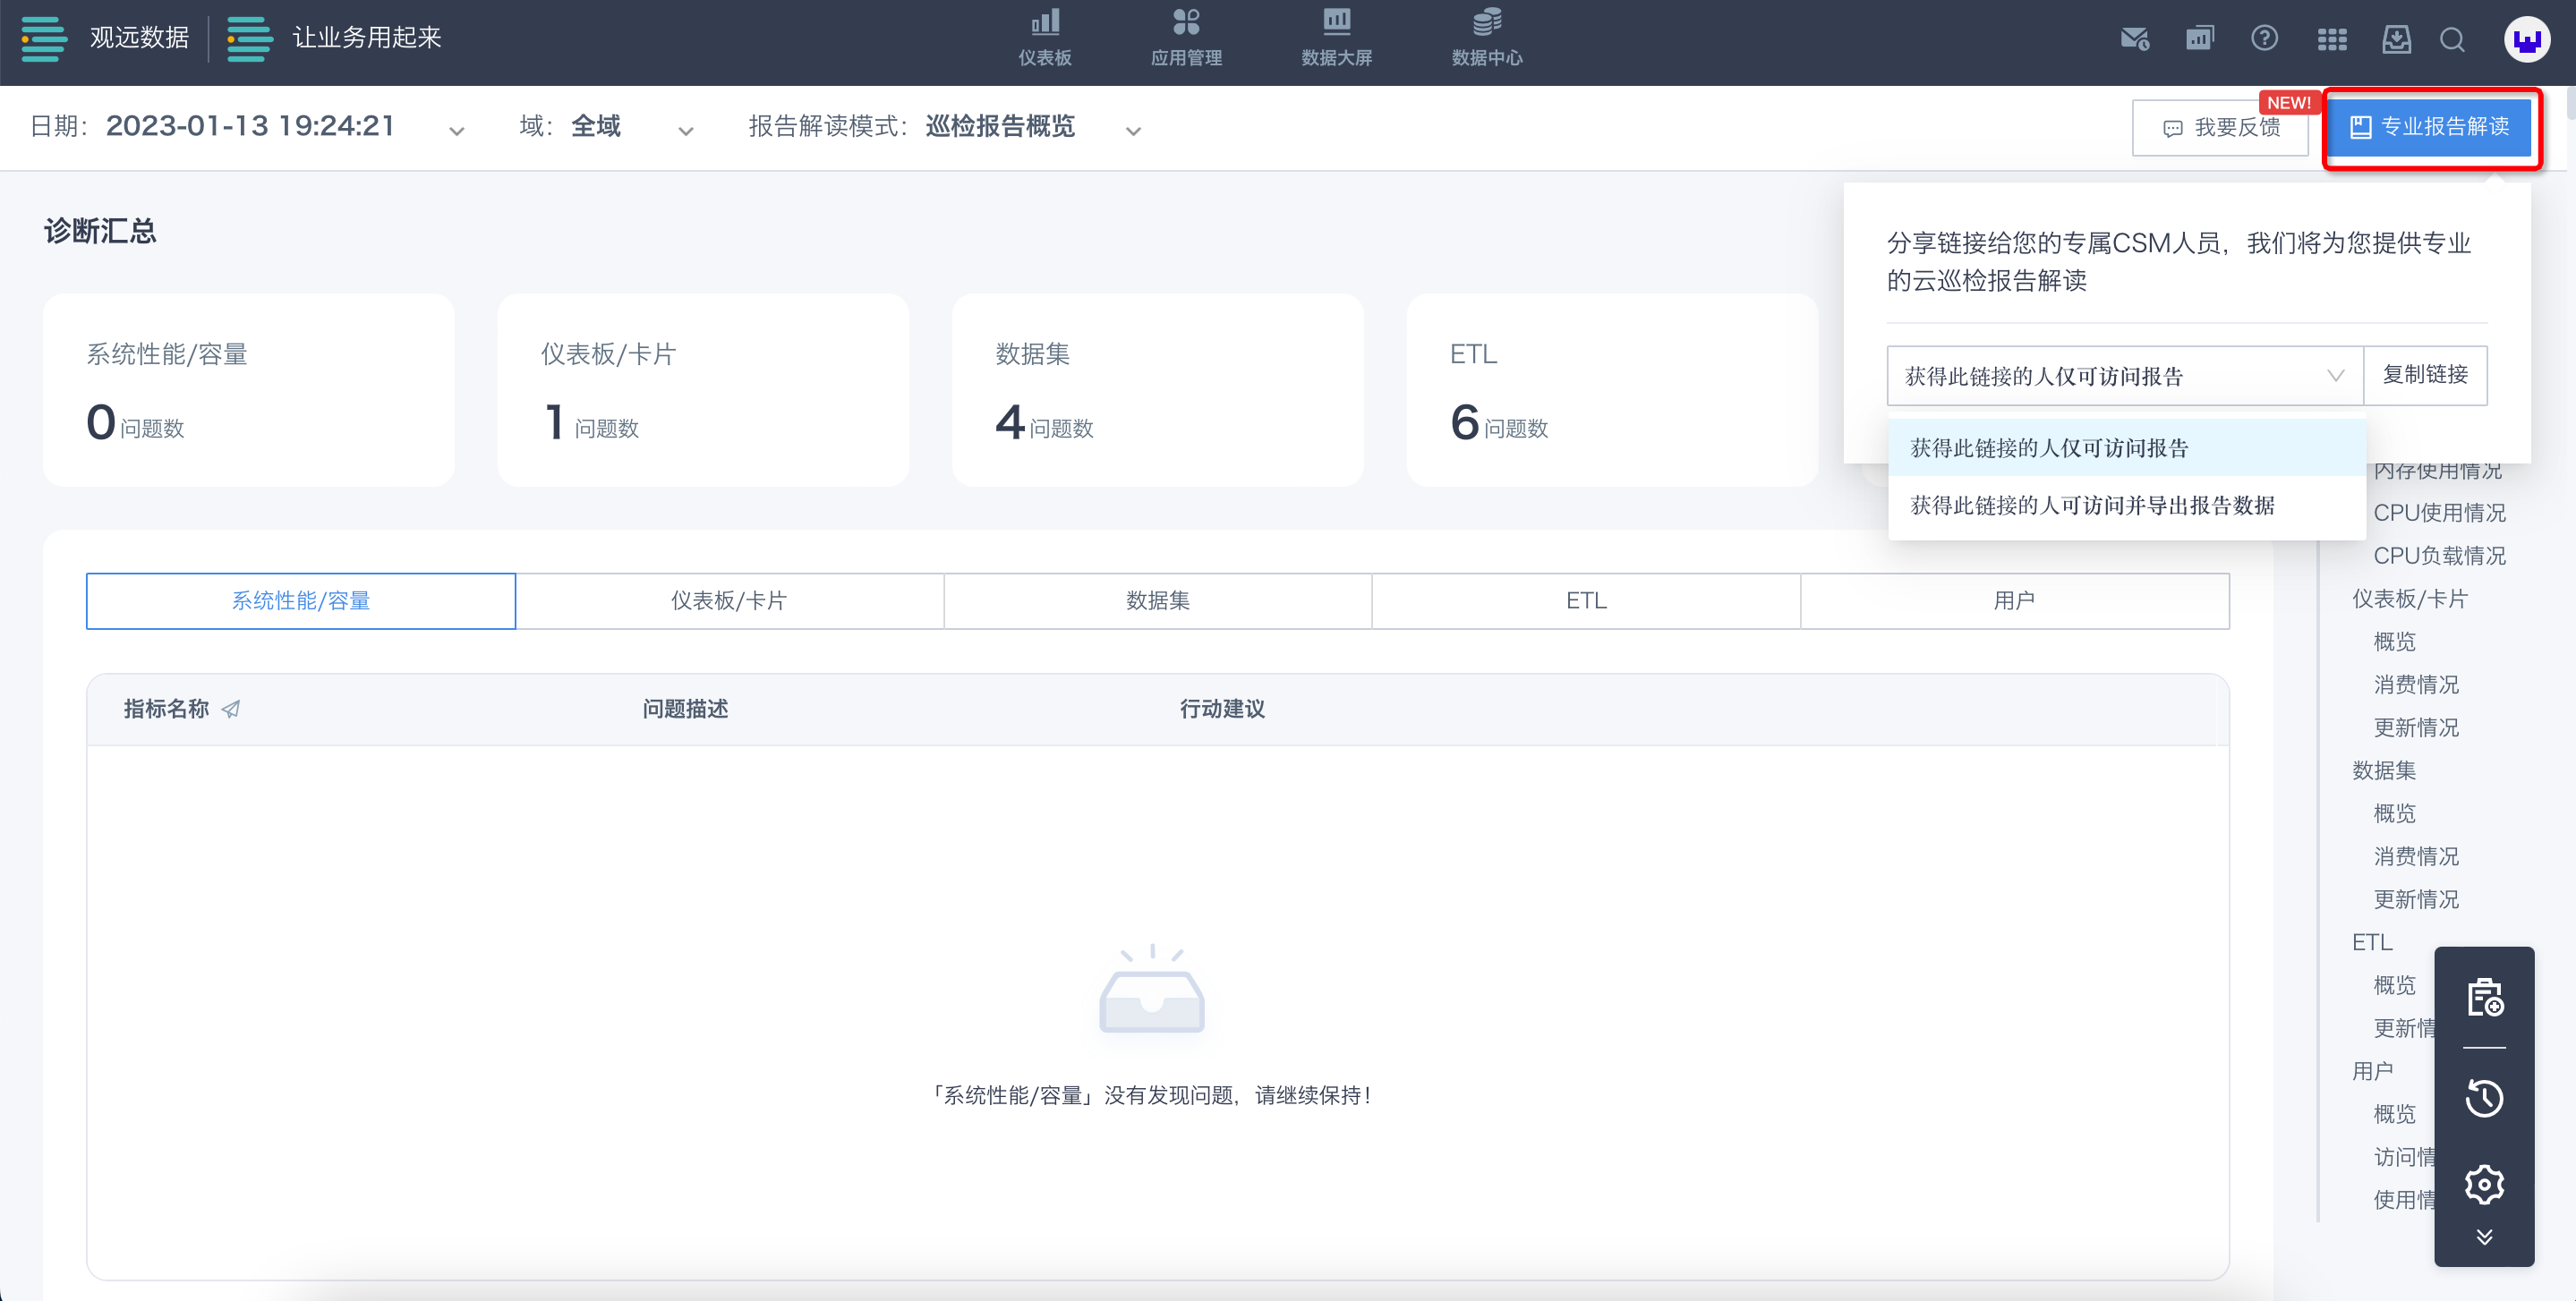
Click Professional Report Interpretation in the upper-right corner of the Cloud Inspection page to copy the report link and share the Cloud Inspection report. Others can open the report and export report data through this link. You can also send the report to Guandata staff for professional interpretation.
Cloud Inspection Report Feedback
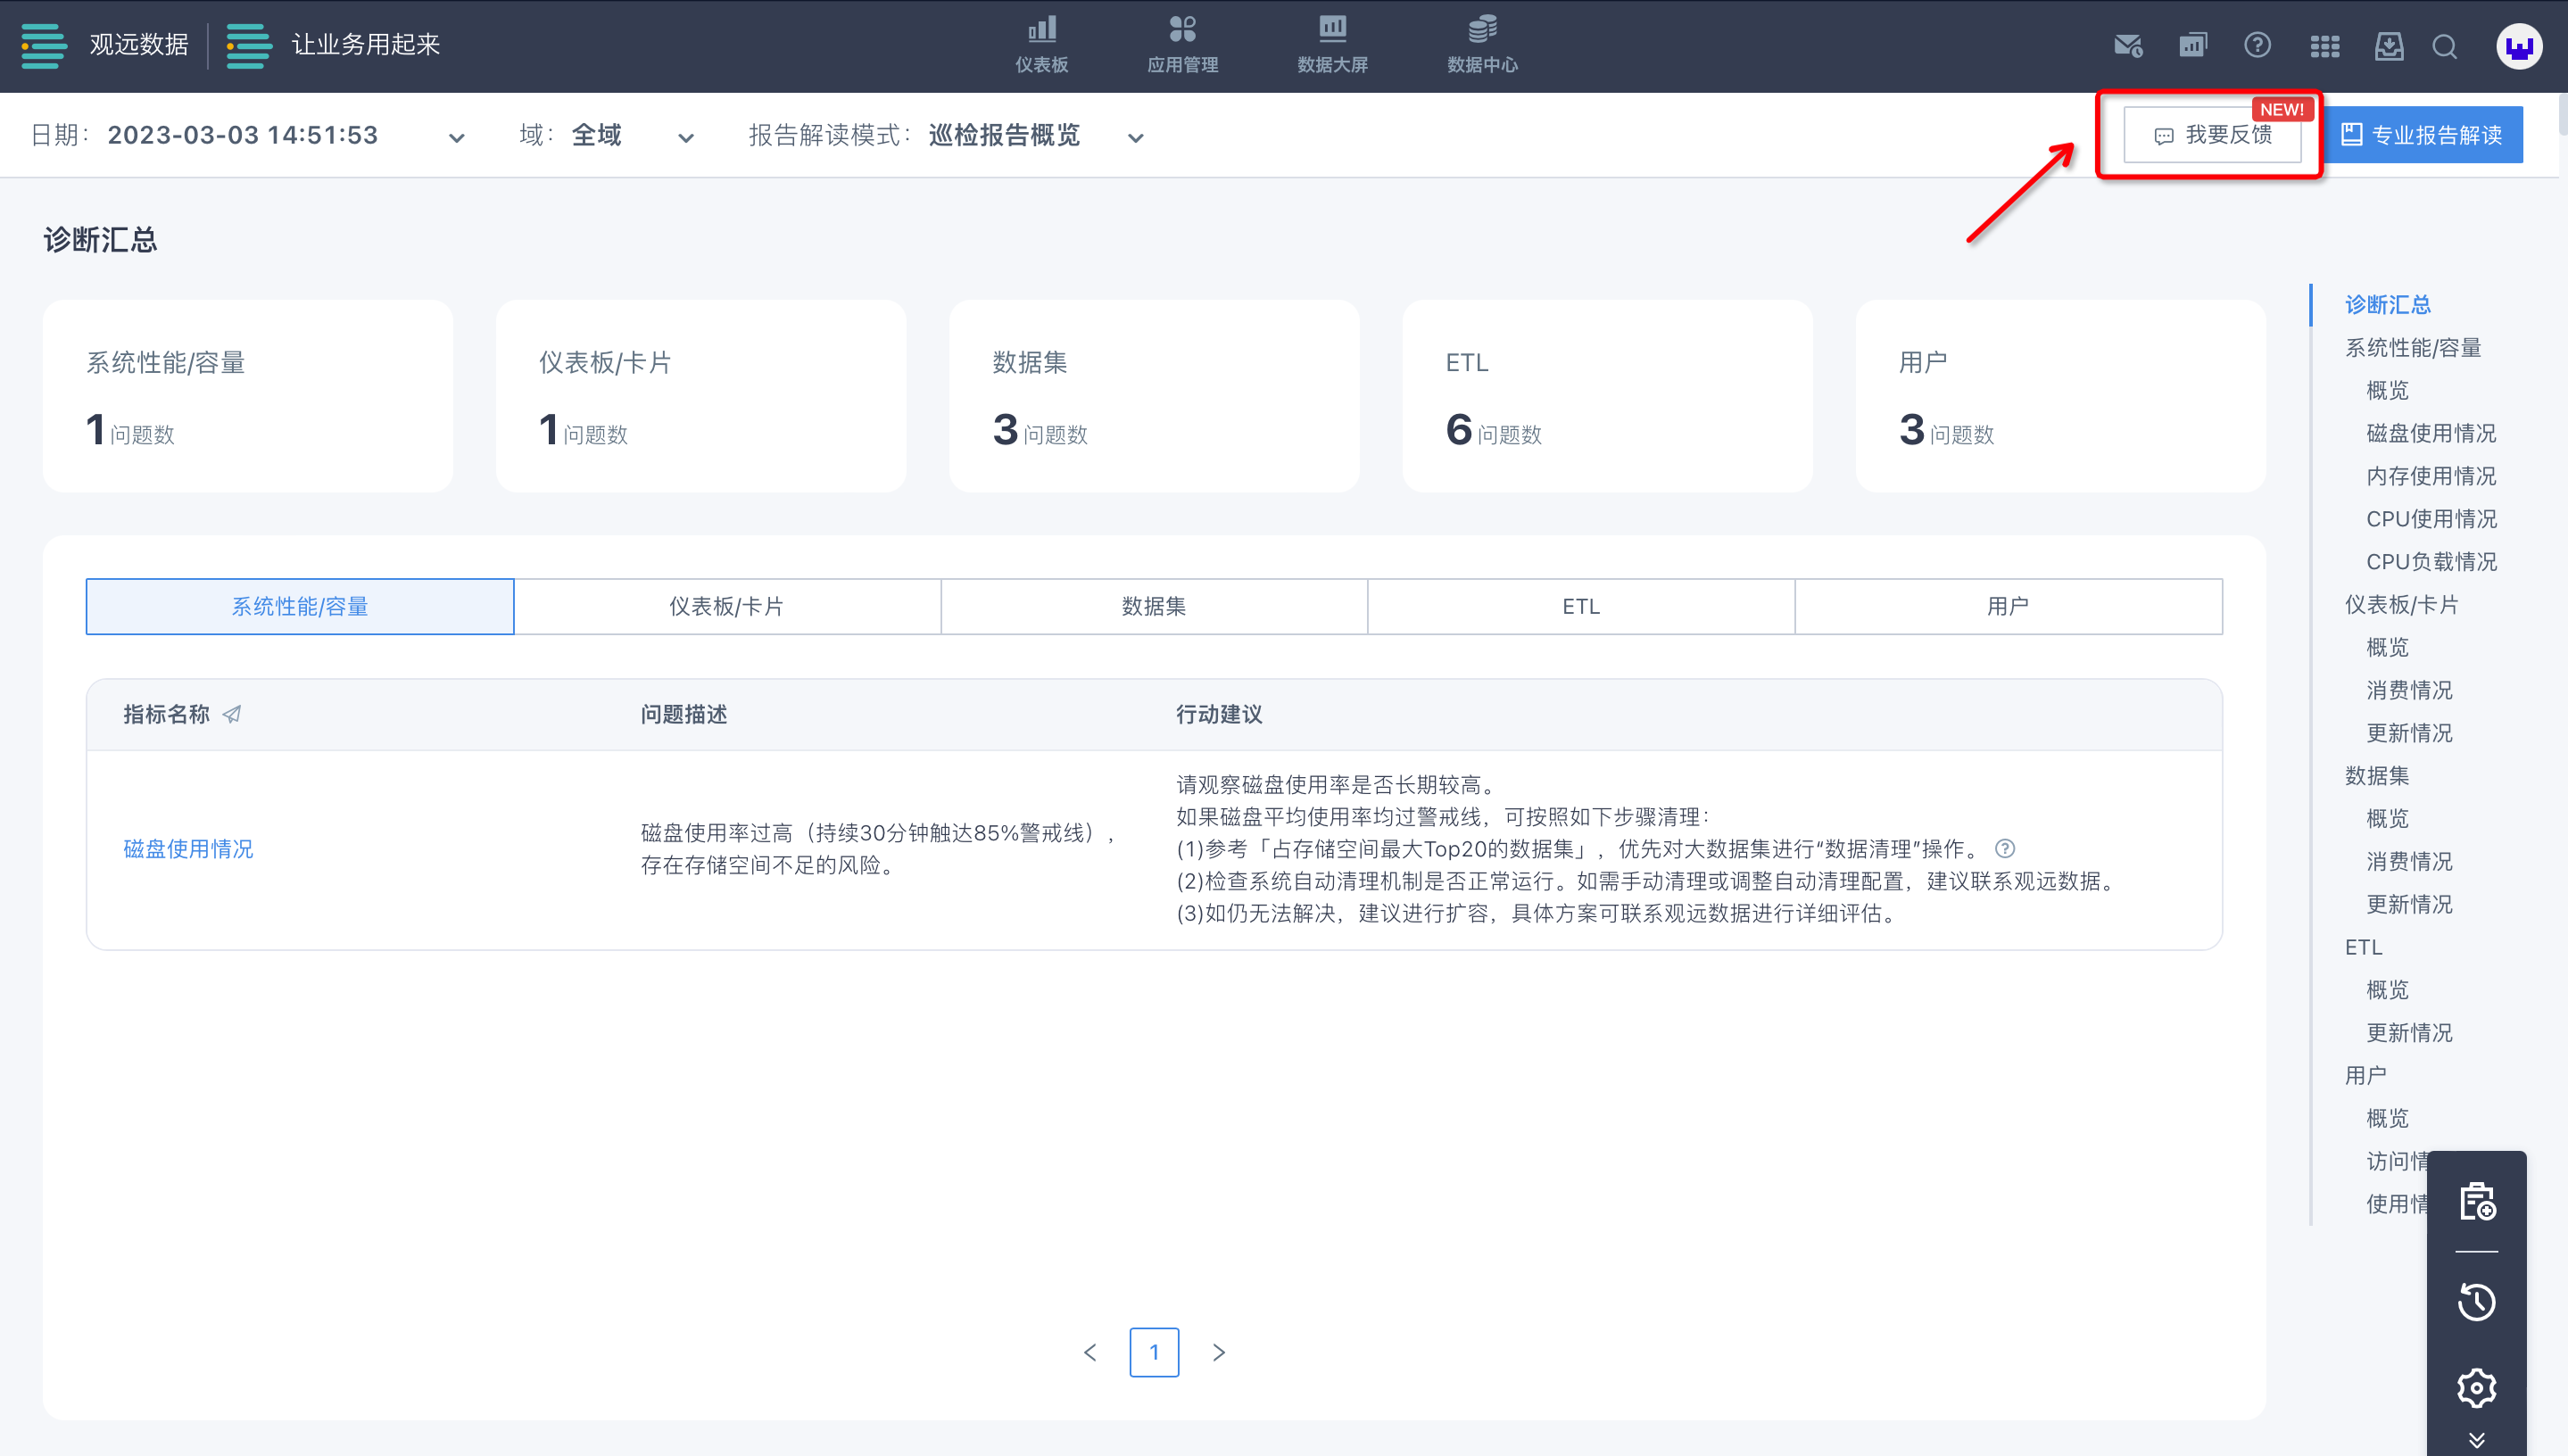
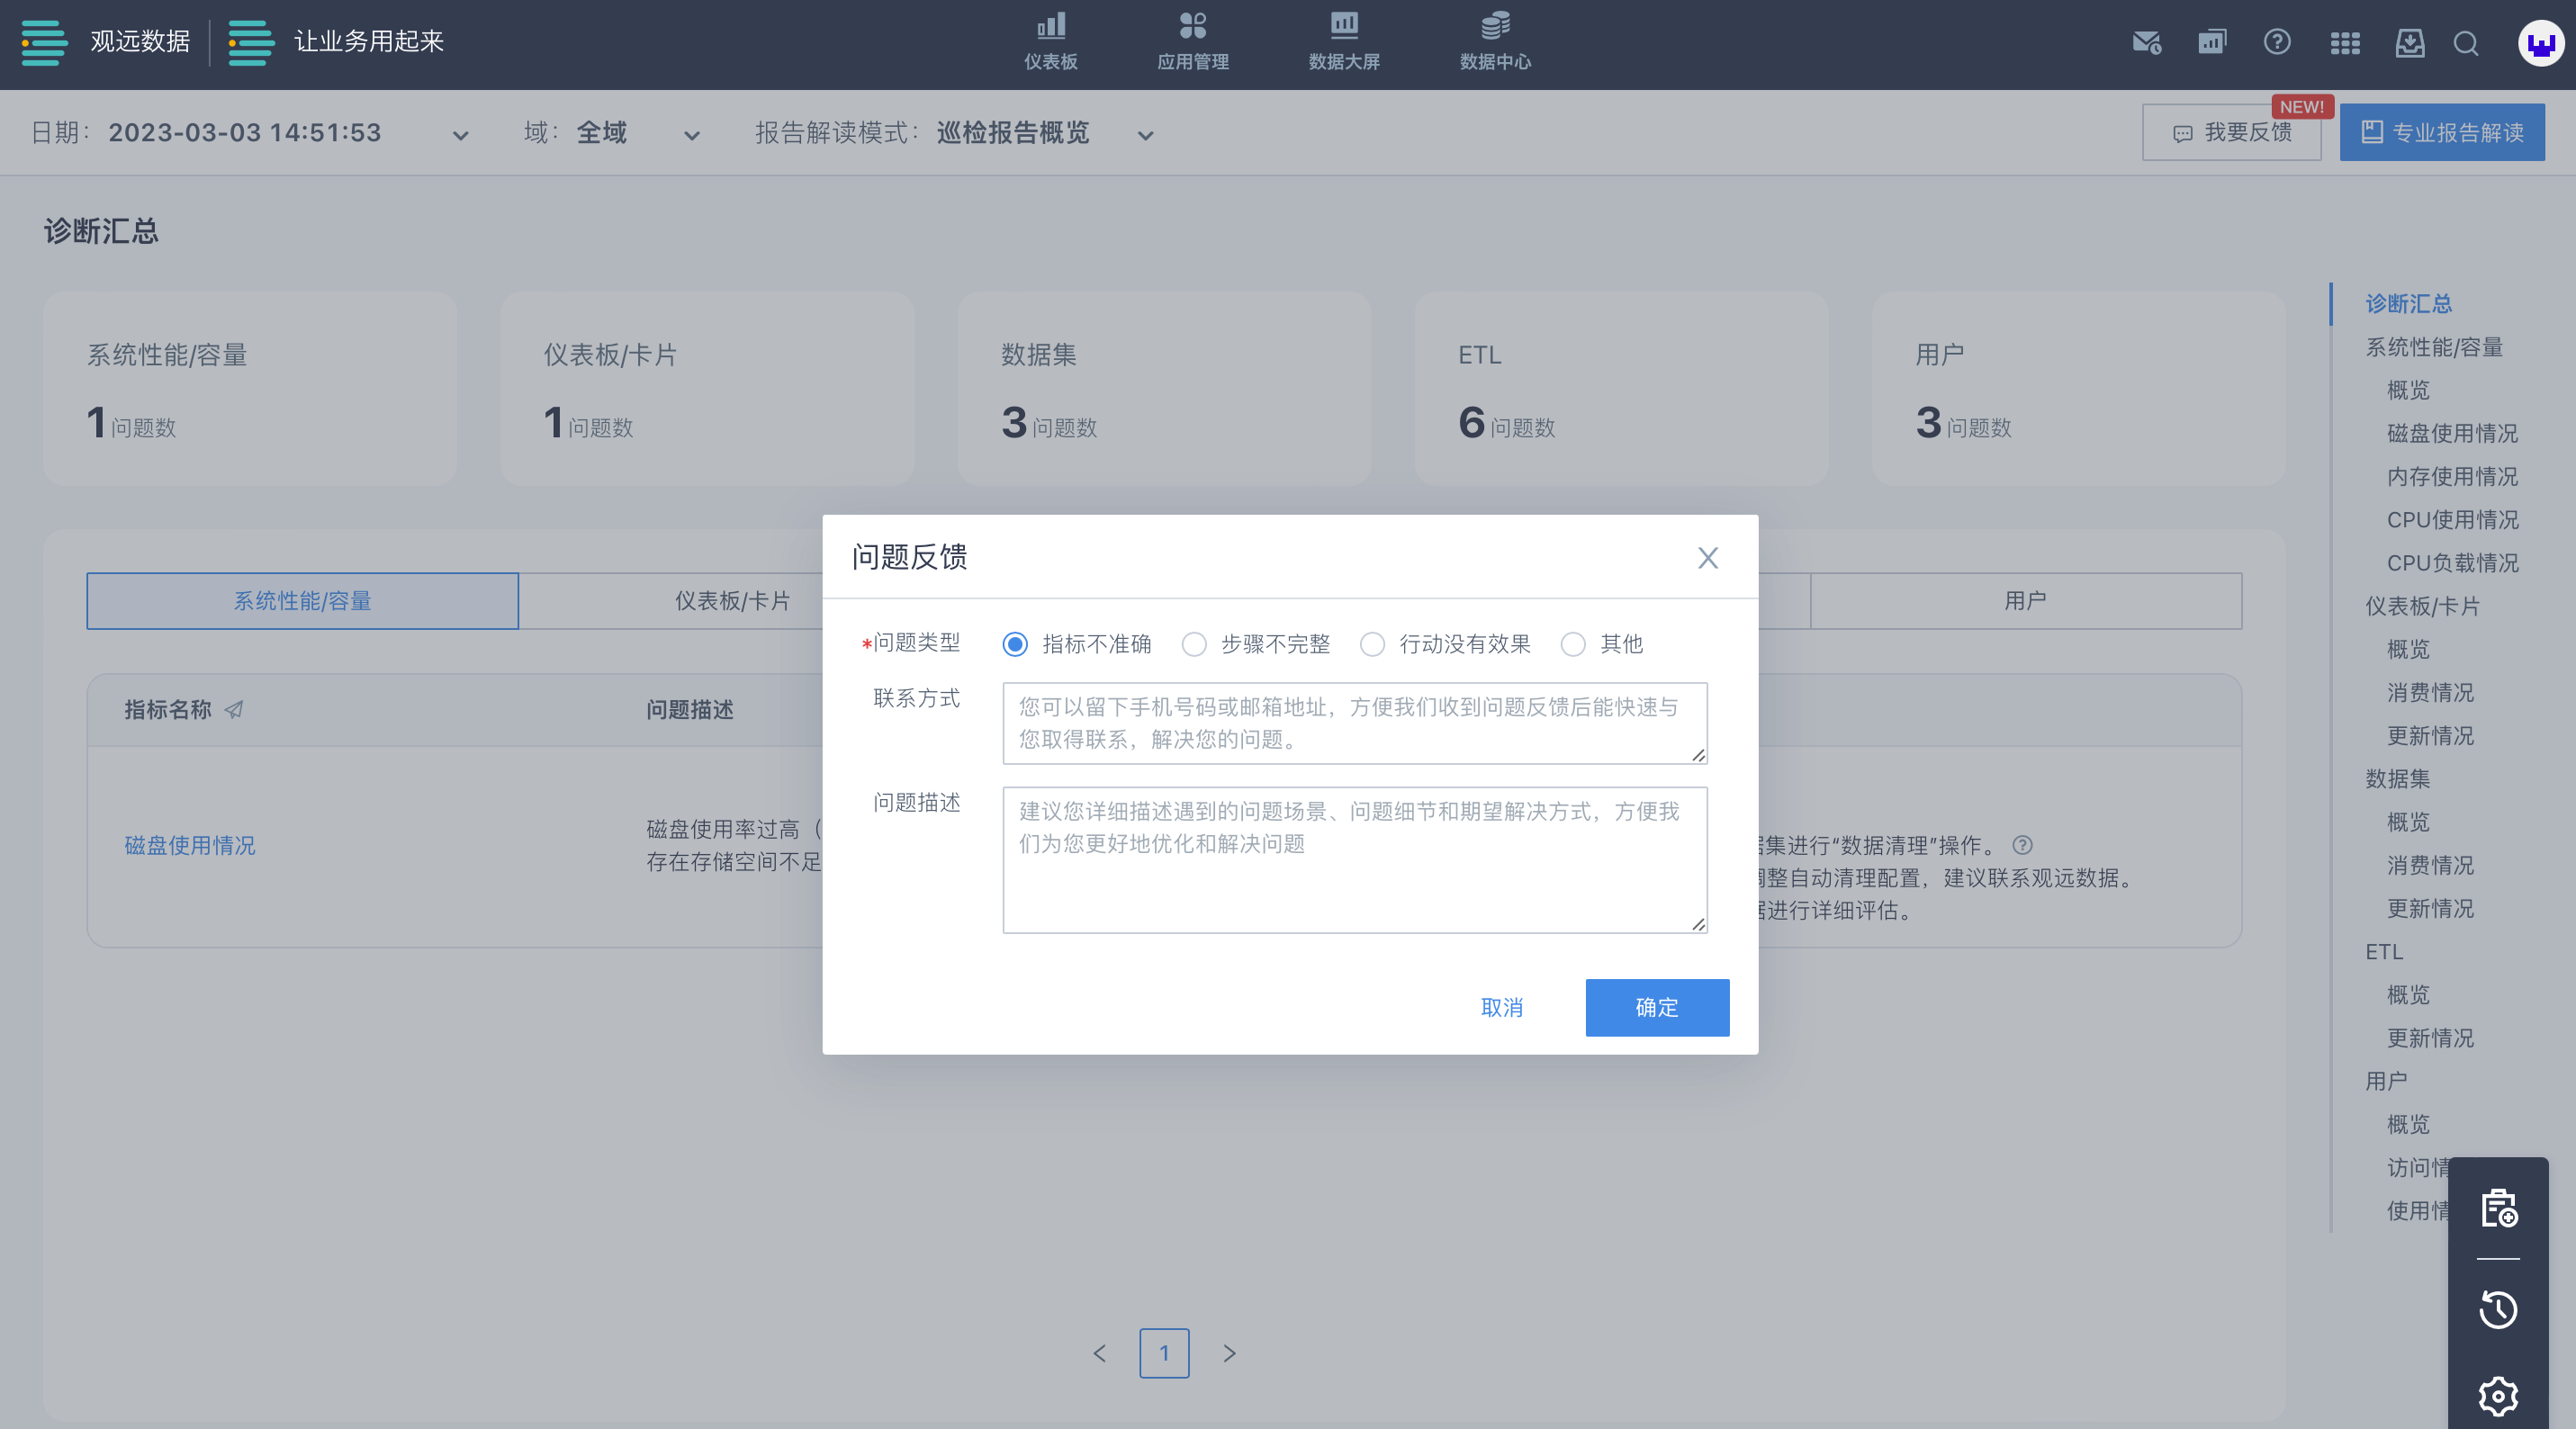
If you have feedback on a Cloud Inspection analysis and diagnosis report during use, click Feedback in the upper-right corner of the Cloud Inspection page and fill in your feedback in detail, including the issue scenario, issue details, expected solution, and other information. After submission, Guandata staff will contact you based on the feedback and help resolve the issue.
Cloud Inspection Advantages
Visual Inspection Report: Clear at a Glance
With a simple click and no other operation, you can view a visual diagnosis report. The system automatically collects statistics for cluster resources and application usage with one click, covering more than 100 inspection metrics without manual data collection. The analysis is comprehensive, the report is clear and well organized, and the overall status is easy to understand.
Rich Operations Experience: Intelligent Interpretation
Built on Guandata's rich operations experience and years of practice serving many customers, Cloud Inspection turns operations expert experience into tools, enabling intelligent interpretation of inspection reports and further diagnosis of system status.
Efficient Action Guide: Practical and Executable
Cloud Inspection combines specific enterprise system information with strategy rules accumulated from Guandata's operations experience to provide more accurate, intelligent, and comprehensive operations recommendations. It gives enterprise users an action guide for system optimization and helps ensure that the system runs continuously, stably, and efficiently.
Cloud Service as a Tool: Zero Cost and Low Barrier
- Zero cost: No local computing resources are consumed; all computation is completed in the cloud.
- Low barrier: As one of Guandata's one-stop services, it requires no-code operations and has a simple process.
- High growth: The Cloud Inspection platform is continuously updated and improved. Feature updates require no extra handling from users and create no additional burden.