Product Advantages
Guandata BI is an end-to-end intelligent BI product built by Guandata for enterprises seeking digital transformation and smarter decision-making.
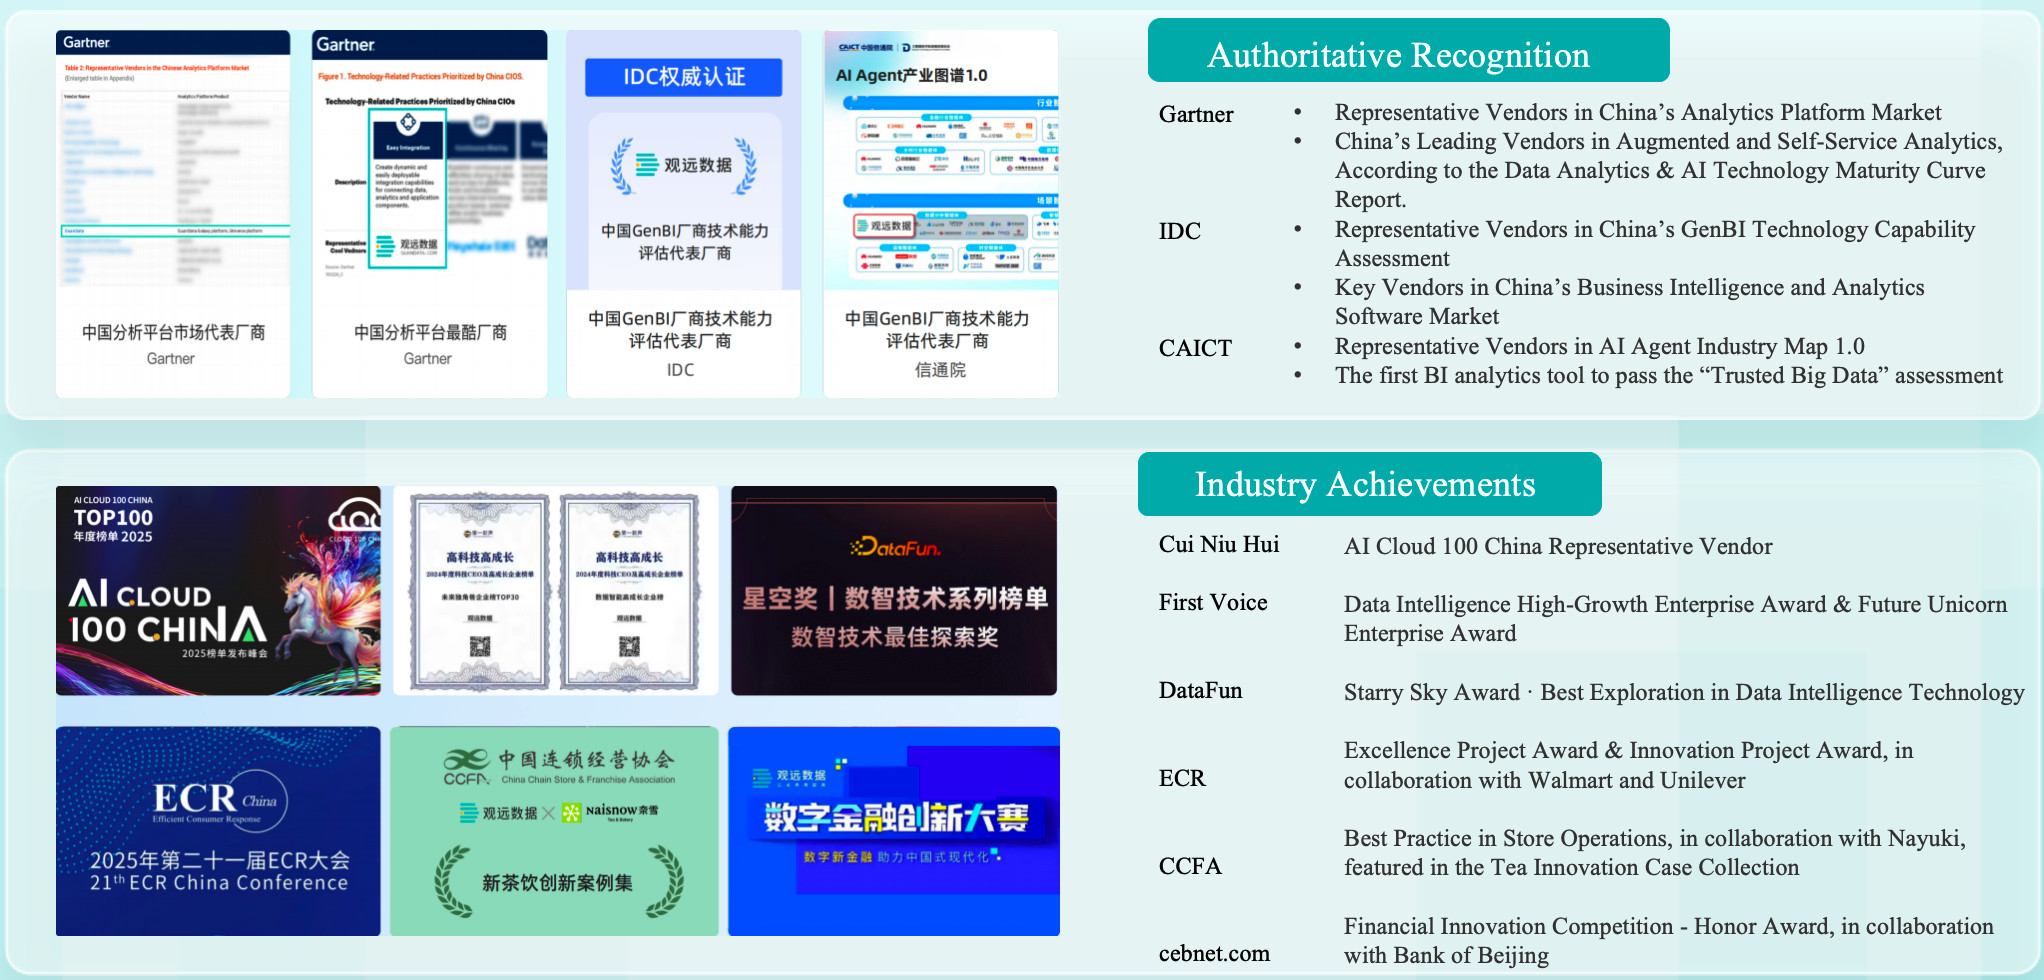
Industry Recognition and Leadership
Guandata BI has been widely recognized by authoritative institutions both in China and internationally.
Full-Scenario Coverage for Efficient Decision-Making
Guandata BI supports enterprise-wide data analysis and decision-making scenarios, covering everyone from executives to frontline employees. It helps reduce data silos, improve overall data utilization, and respond quickly to changing business needs.
- Comprehensive scenario coverage: from executive decision cockpits and business analysis portals to self-service analysis and ad hoc data retrieval for frontline teams
- Combined dual consumption model: a combination of "people find data" (data portals, visual charts, personalized homepages) and "data finds people" (ChatBI, subscriptions, and alerts)
Mobile Collaboration for Decision-Making Anytime, Anywhere
Guandata BI deeply integrates with mainstream workplace platforms to enable comprehensive mobile collaboration, helping enterprises break time and location barriers, access insights anytime, and improve team collaboration efficiency.
- Seamless platform integration: deeply integrated with DingTalk, WeCom, and Feishu, supporting unified accounts with password-free login, report sharing and subscription, metric monitoring and alert pushing, and chatbot interaction
- Custom standalone apps: freely customizable standalone PC and mobile apps that serve as the enterprise data analysis hub connecting all users
- Mobile optimization: mobile components are fully adapted to phone screens to provide the best visual experience
Visual Insights That Drive Better Decisions
Guandata BI provides professional visualization capabilities for management decisions and business insights, helping enterprises lower the barrier to understanding data, quickly identify business trends, and support evidence-based decision-making.
- Interactive analysis and exploration: rich interactions such as drill-down and linkage guide users to independently discover business patterns and root causes
- Smart Insights: key data fluctuations are automatically analyzed and interpreted by the system, which directly highlights underlying causes and offers actionable suggestions for business decisions
Billion-Scale Data with Second-Level Response
Guandata BI delivers powerful data processing capabilities to ensure second-level responses on billion-scale datasets, helping enterprises improve processing efficiency, shorten decision cycles, and support real-time business analysis.
- Query acceleration engine: built-in query acceleration enables direct and fast analysis of datasets at the billion-row scale and beyond, effectively addressing congestion during peak query periods
- Flexible computation modes: supports direct connection, extraction, and high-speed engine modes to meet diverse business analysis needs
- Performance optimization: provides diagnostics and optimization suggestions for slow reports to keep the system running at peak performance
Secure Low-Code Embedding with Flexible Integration
Guandata BI provides secure, flexible, and low-code embedding and integration capabilities, helping enterprises connect with existing systems quickly, reduce integration costs, and protect data security.
- Security and compliance: comprehensive security architecture design ensures system security
- Flexible integration: supports embedding either full pages or individual cards while preserving the consistency of existing system workflows
- Low-code configuration: login authentication, page embedding, and similar tasks can be completed quickly through configuration, reducing development effort
- Multi-tenant support: supports both single-tenant and multi-tenant modes, including tenant data isolation and account management capabilities